2421
Comparison of Single-Slice Liver R2* Estimation with FerriSmart for Assessment of Hepatic Iron overload1Biomedical Engineering, The University of Memphis, Memphis, TN, United States, 2Radiology, Cincinnati Children's Hospital Medical Center, Cincinnati, OH, United States, 3Diagnostic Imaging, St. Jude Children's Research Hospital, Memphis, TN, United States
Synopsis
Keywords: Data Analysis, Liver
FerriScan is considered the gold standard to quantify liver iron content (LIC) by MRI. Recently, FerriSmart, an AI—based algorithm was developed to permit faster postprocessing of R2-based LIC. To our knowledge, FerriSmart results have not been compared to R2*-LIC methods. In this work, R2*, R2*-LIC, and FerriSmart LIC were compared to evaluate their agreement.Introduction
Hepatic iron overload is a severe complication of chronic blood transfusions and measuring liver iron content (LIC) is crucial to guide iron removal therapy. In recent years, MRI methods based on transverse relaxation rates (R2, R2*) are being used clinically to estimate LIC. The current, FDA-approved MR gold standard is FerriScan ® (Resonance Health), which uses a spin echo sequence to measure R2, which is then transformed to LIC via a R2-LIC calibration.1 However, the R2-LIC relationship is not linear and the data has to be sent off-site for processing, which burdens the user with delayed results and costs. In contrast, R2* has a linear relationship with LIC, and can determine LIC on-site, which makes it an attractive alternative.2 Recently, FerriSmart® (Resonance Health), another FDA-approved service, permits online, onsite processing by automating image recognition and R2 analysis by a convolutional neural network.2,3 To our knowledge, there are no studies investigating the relationship between R2* and FerriSmart LIC. Hence, the purpose of this study is to examine the association between R2* and FerriSmart LIC in patients with different HICs covering the clinical range of hepatic iron overload.Methods
67 patients were included in this study with suspected or known iron overload. Patients’ age was 14 (± 6) years, and 54% were female. Patients were scanned with a 1.5-T Siemens MAGNETOM Avanto Fit. Each patient underwent a GRE sequence with TR 200 ms, 20 TEs, TE1 = 1.07 ms, echo spacing = ~0.8 ms, slice thickness = 10mm, flip angle = 35°. T2* maps were calculated by fitting magnitude image to a monoexponential decay using the nonlinear least squares fit method.4 Vessels were excluded using T2*-thresholding. R2*-LIC was calculating by using the Hankins calibration curve.4,5 Linear regression compared R2* and FerriSmart LIC. R2*-LIC was also compared to FerriSmart LIC, with a critical value of 0.05. Agreement between R2*-LIC and FerriSmart LIC was inspected with a Bland-Altman analysis.Results
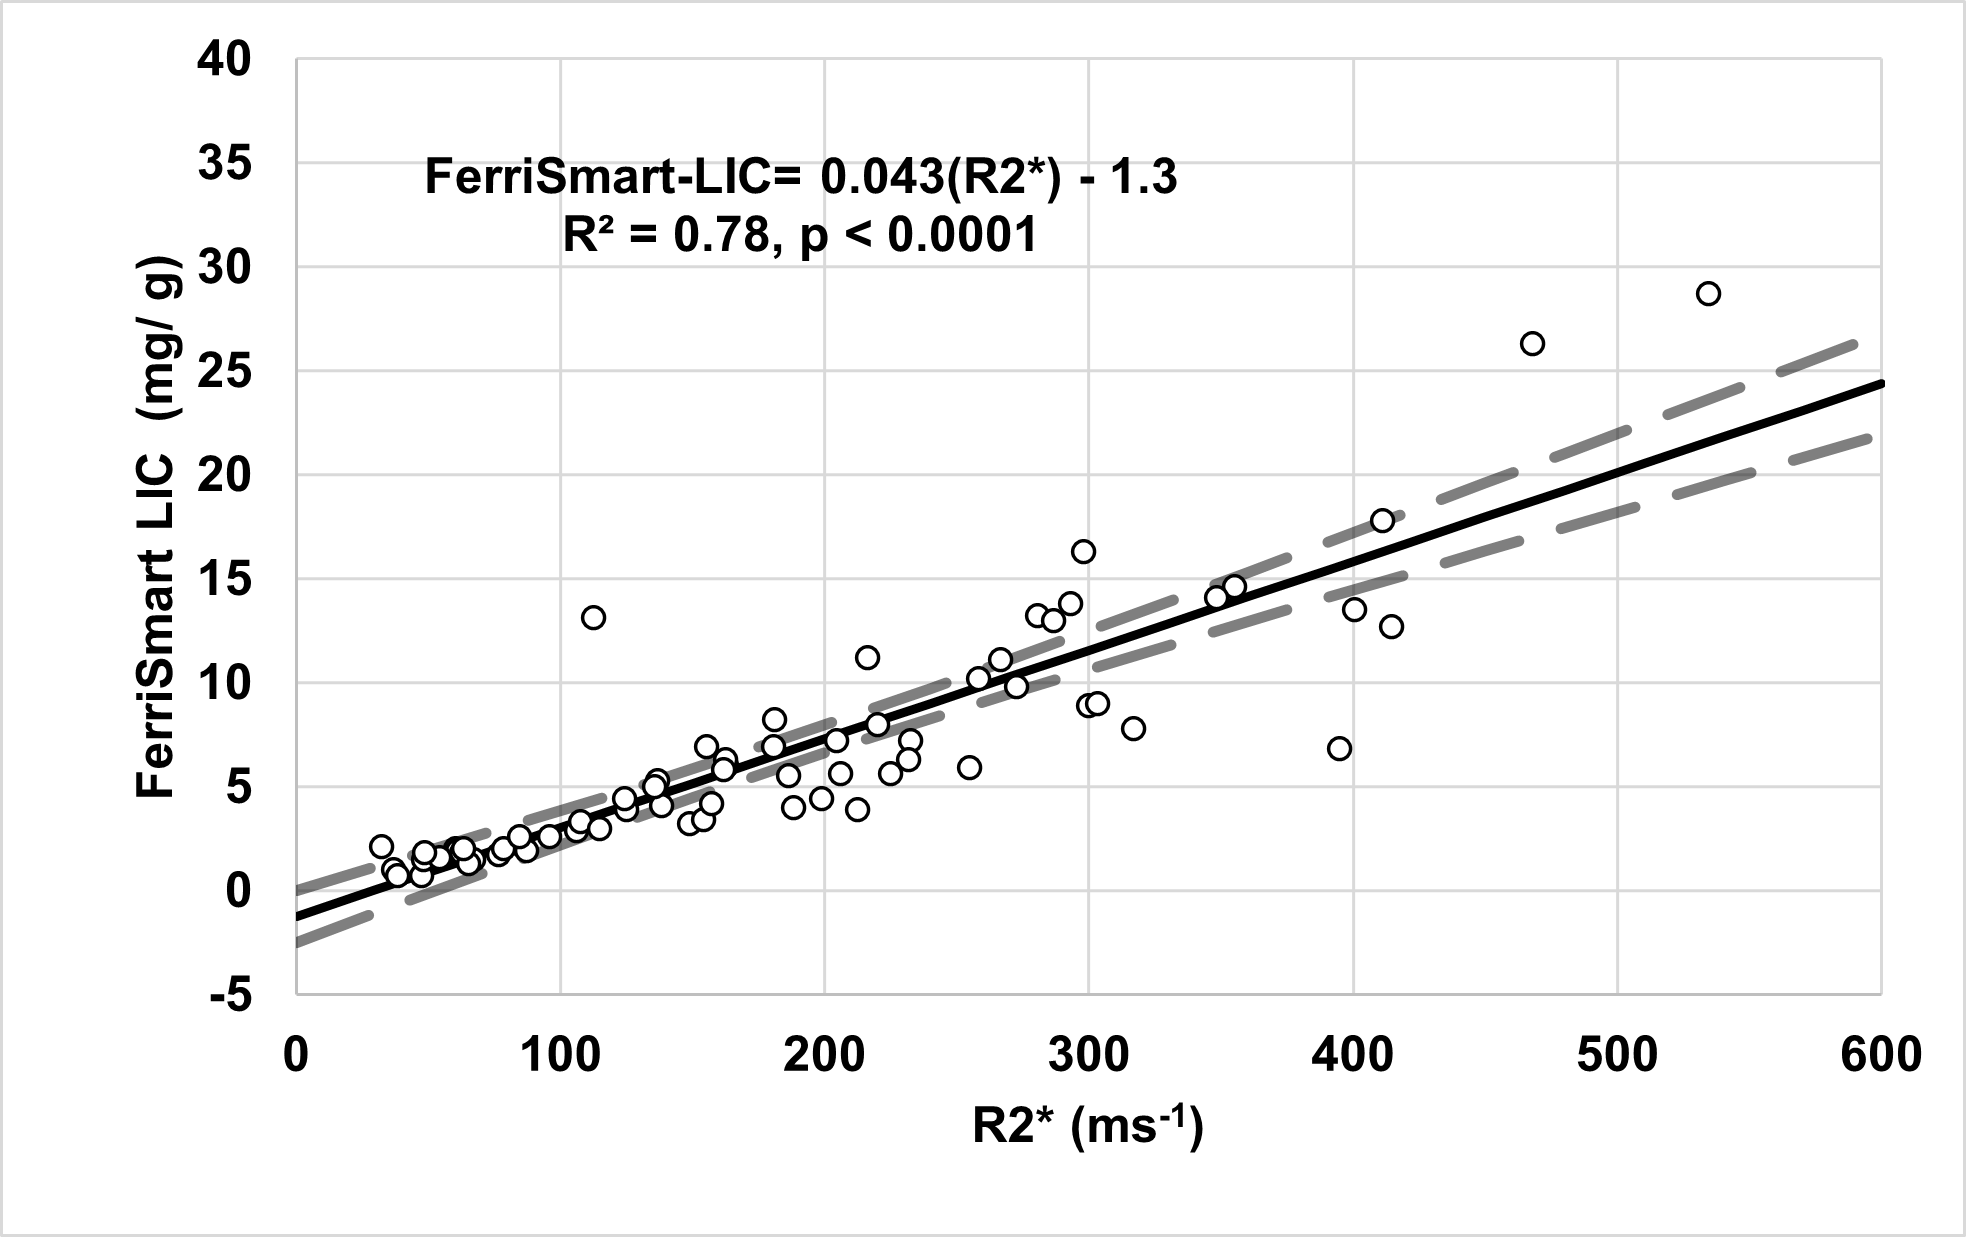
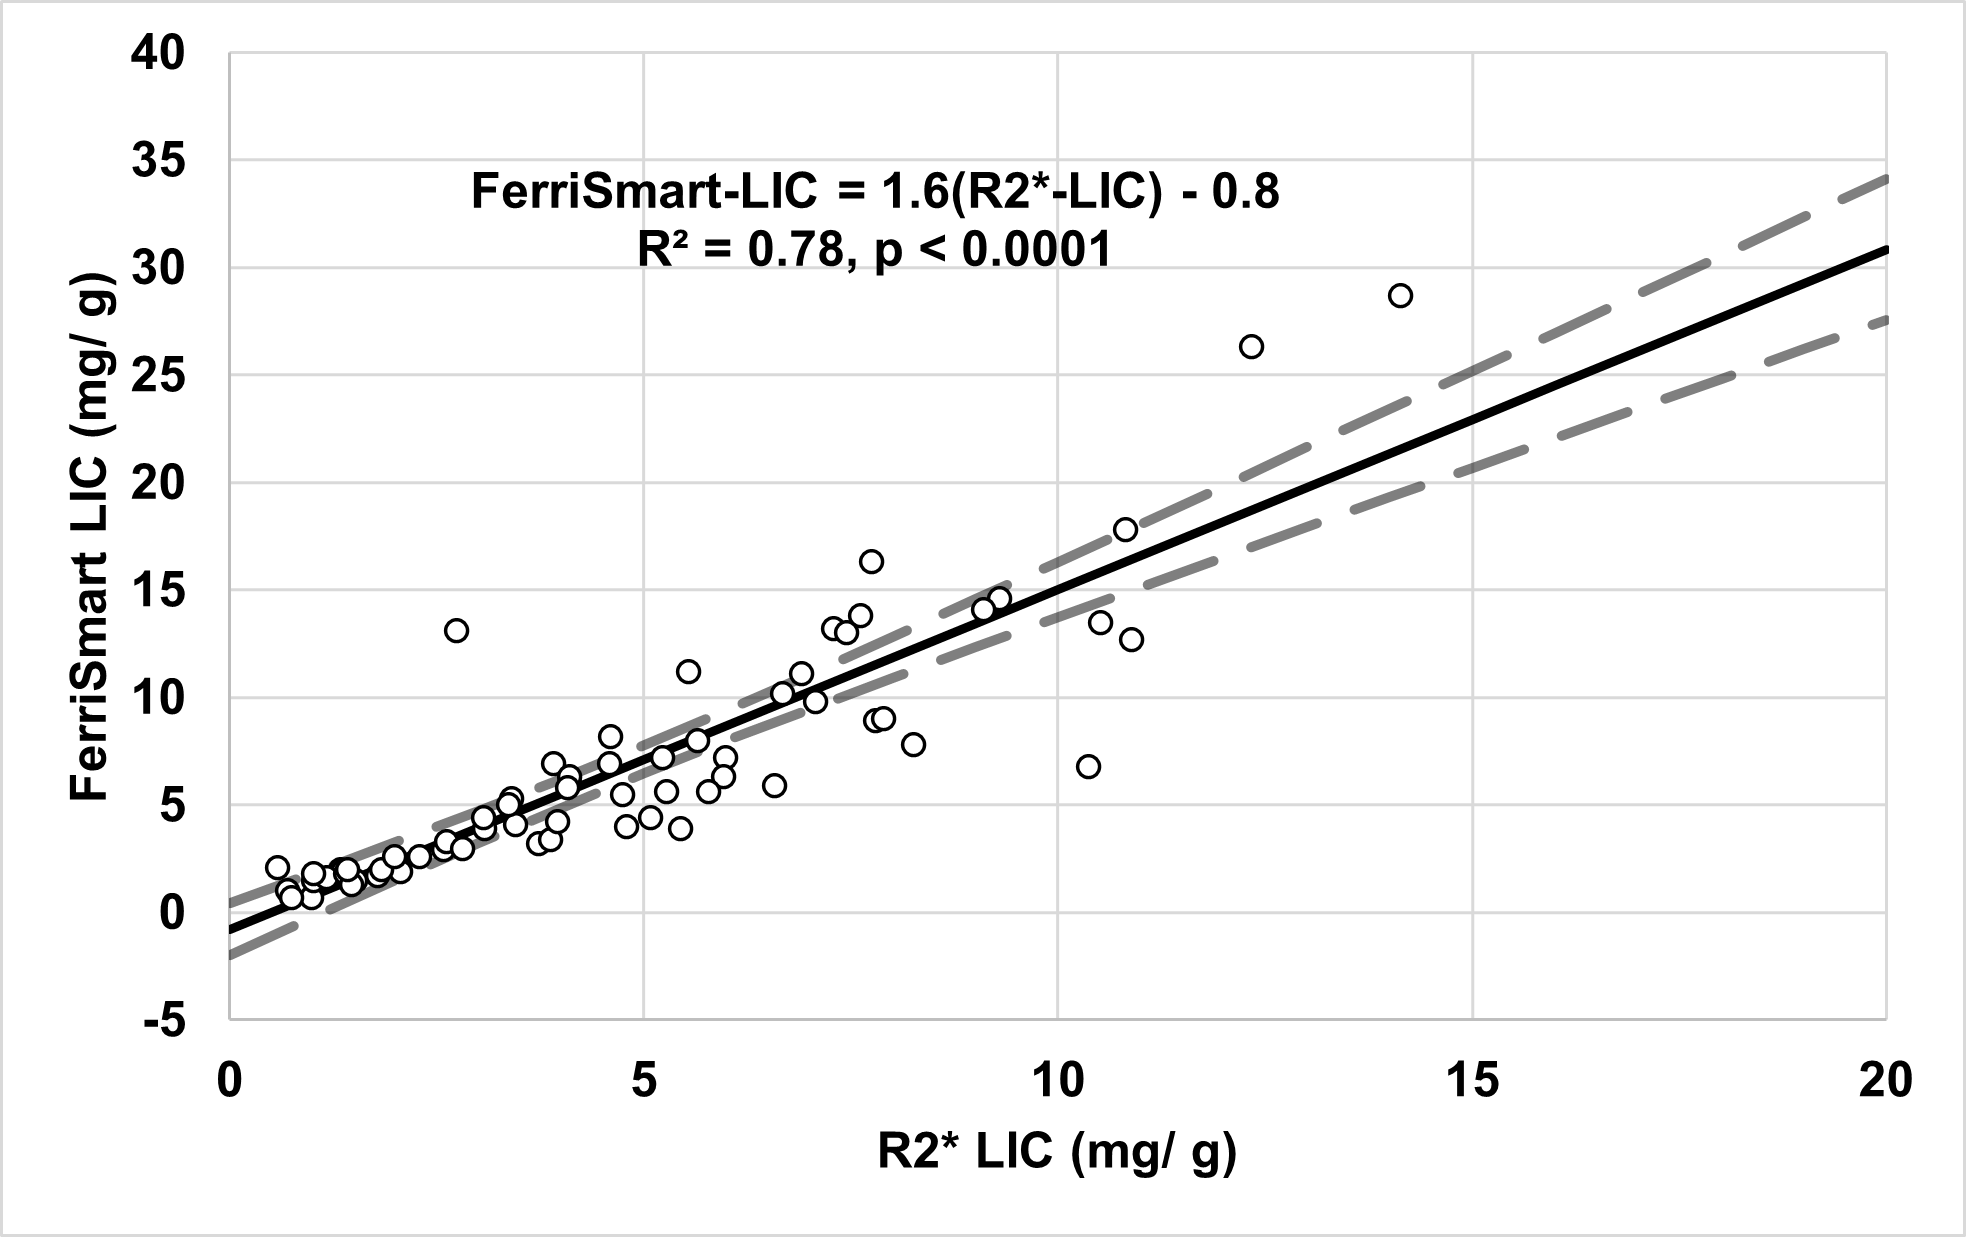
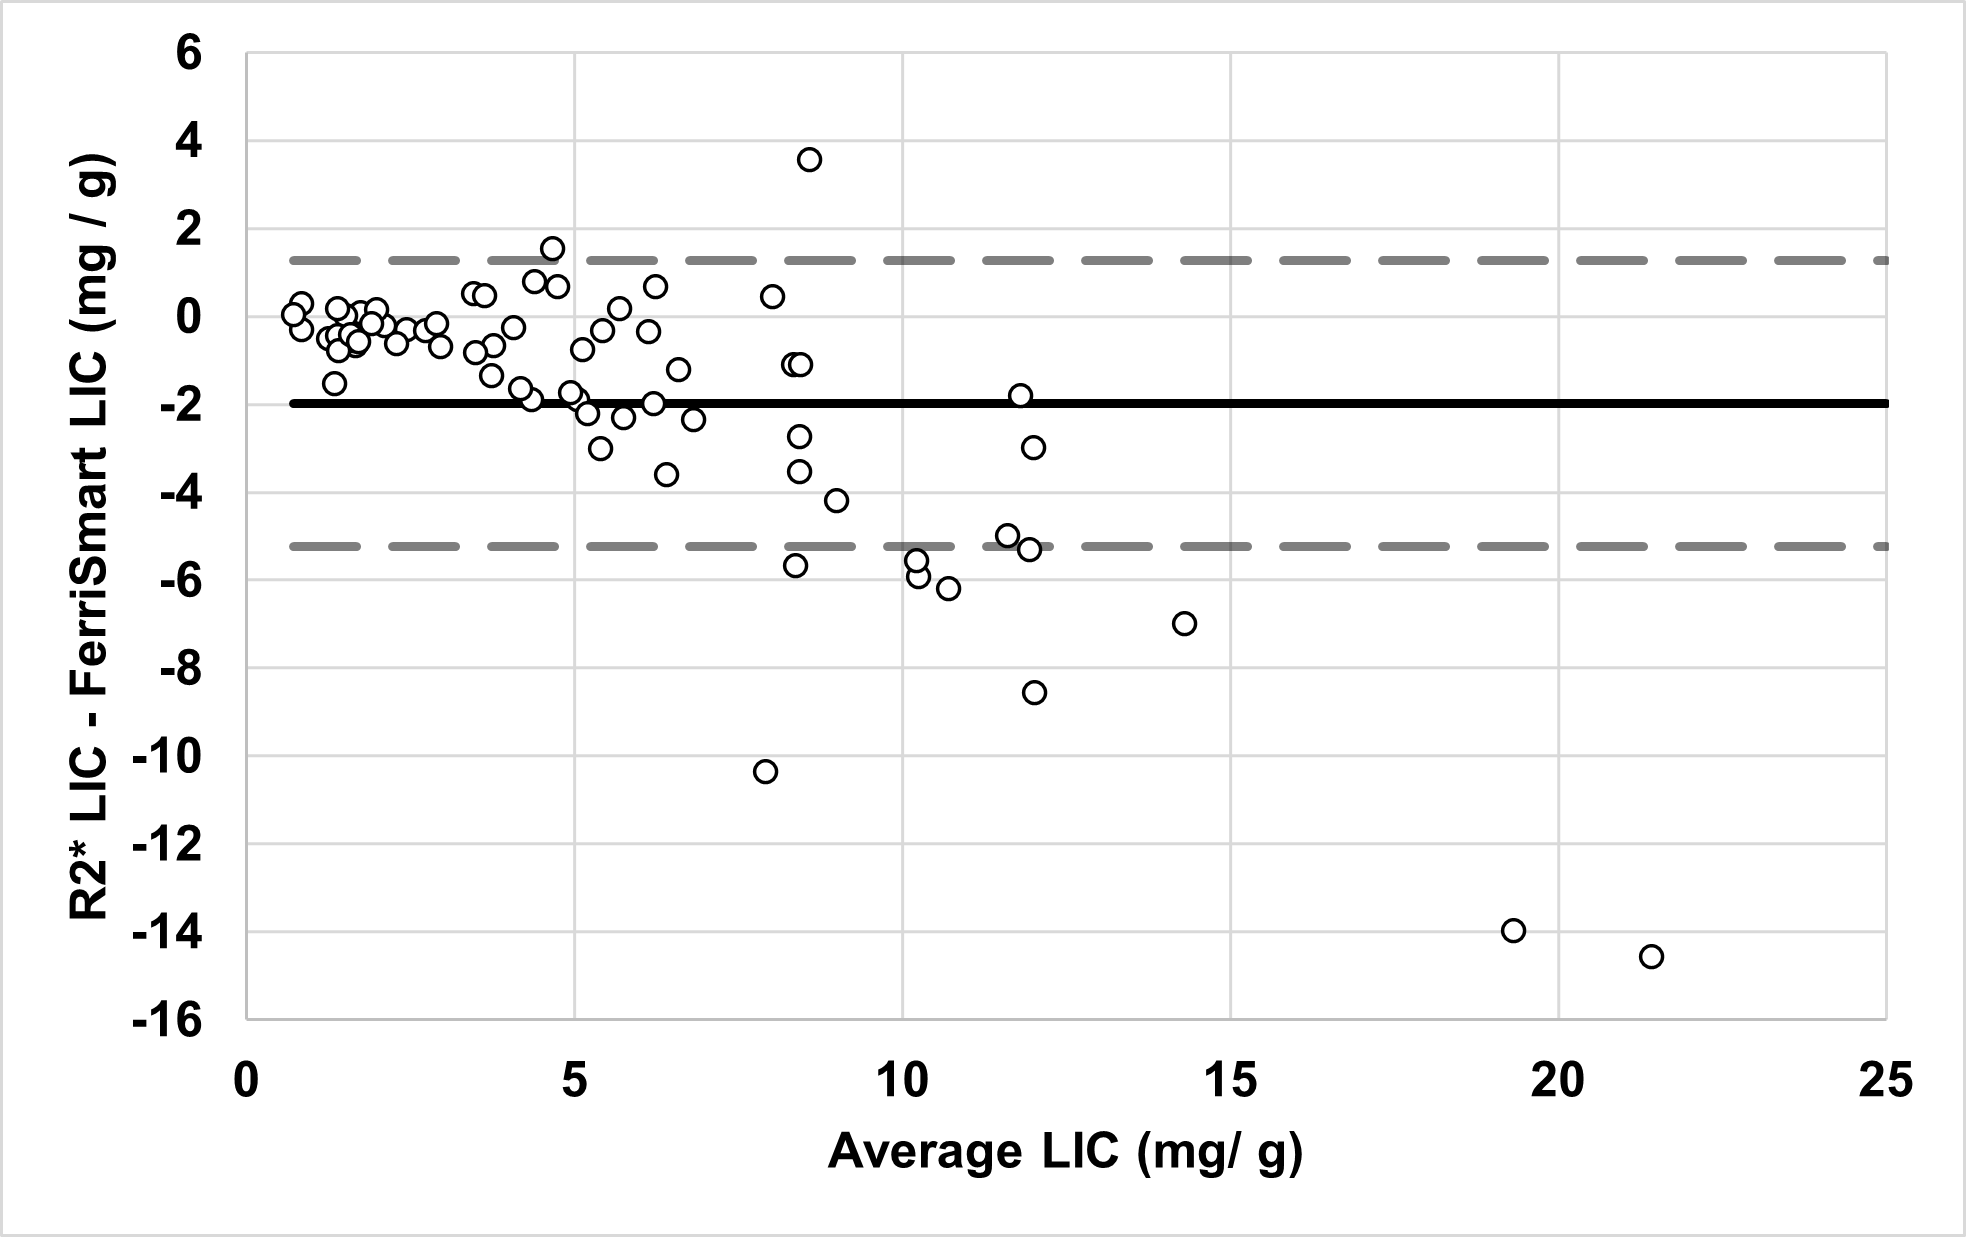
R2* and FerriSmart LIC showed a linear relationship, FerriSmart-LIC = 0.043R2* - 13 mg Fe/ g dry liver , a p < 0.0001 and a coefficient of determination of 0.78 (Fig. 1). Ferrismart-LIC values were higher than R2*-LIC with a slope of 1.6 (Fig. 2). Average difference between the R2*-LIC to FerriSmart-LIC was -2.0 (± 4) mg Fe/ g dry liver , as shown in the Bland-Altman plot in Fig. 3.Discussion
The purpose of this work was to determine the relationship among R2*, R2*-LIC, and FerriSmart LIC.The relationship between R2*-LIC and FerriSmart LIC in this study was similar to other studies investigating the difference between R2*-LIC and FerriScan LIC..3,8,9 This was expected as FerriSmart was intended to perform similarly to FerriScan, except for faster results enabled by AI-driven automated image and data analysis.4 However, the Bland-Altman plot suggests R2-LIC and R2*-LIC showed poor agreement beyond LIC greater than 9 mg Fe/ g dry liver . In our cohort, R2-LIC was overestimated compared to R2*-LIC. A limitation of this study is not knowing the algorithm for FerriSmart segmentation and R2 analysis and using as a black-box model; which warrants further investigation.
Conclusion
There is a need for non-invasive iron quantiifaction for early detection and longitudinal tracking of iron overload. FerrriSmart is a faster alternative to FerriScan due to online and onsite processing capabilities, but no studies have compared FerriSmart with alternative R2*-LIC estimation using different calibration models. In this work, R2*, R2*-LIC and FerriSmart LIC were compared. R2* had a linear relationship with FerriSmart LIC. However, R2*-LIC and FerriSmart showed poor agreement beyond 9 mg Fe / g dry liver. Future work warrants further investigation of FerriSmart reproducibility and comparing to R2*-LIC methods.Acknowledgements
We would like to thank St. Jude Children's Research Hospital for MRI data acquisition.References
1. Rockey DC, Caldwell SH, Goodman ZD, Nelson RC, Smith AD. Liver biopsy. Hepatology. 2009;49(3):1017-1044.
2. Doyle E, Ghugre N, Coates TD, Wood JC. Fixing the MRI R2-iron calibration in liver. American Journal of Hematology. 2020;95(5):E120-E122.
3. Healy GM, Kannengiesser SAR, Espin-Garcia O, Ward R, Kuo KHM, Jhaveri KS. Comparison of Inline R2* MRI versus FerriScan for liver iron quantification in patients on chelation therapy for iron overload: preliminary results. European Radiology. 2021;31(12):9296-9305.
4. K182218 510(k) Premarket Notification. FDA. https://www.accessdata.fda.gov/scripts/cdrh/cfdocs/cfPMN/pmn.cfm?ID=K182218
5. Hankins JS, McCarville MB, Loeffler RB, et al. R2* magnetic resonance imaging of the liver in patients with iron overload. Blood. 2009;113(20):4853-4855.
6. Tipirneni-Sajja A, Song R, McCarville MB, Loeffler RB, Hankins JS, Hillenbrand CM. Automated vessel exclusion technique for quantitative assessment of hepatic iron overload by -MRI. Journal of Magnetic Resonance Imaging. 2018;47(6):1542-1551.
7. Henninger B, Zoller H, Rauch S, et al. R2* Relaxometry for the Quantification of Hepatic Iron Overload: Biopsy-Based Calibration and Comparison with the Literature. Rofo. 2015;187(06):472-479.
8. Garbowski MW, Carpenter J-P, Smith G, et al. Biopsy-based calibration of T2* magnetic resonance for estimation of liver iron concentration and comparison with R2 Ferriscan. Journal of Cardiovascular Magnetic Resonance. 2014;16(1):40.
9. Jhaveri KS, Kannengiesser SAR, Ward R, Kuo K, Sussman MS. Prospective Evaluation of an R2* Method for Assessing Liver Iron Concentration (LIC) Against FerriScan: Derivation of the Calibration Curve and Characterization of the Nature and Source of Uncertainty in the Relationship. Journal of Magnetic Resonance Imaging. 2019;49(5):1467-1474.
Figures