2418
DECOMPOSE-QSM improves the tracking of iron-related neurodegenerative pathology1EECS, University of California, Berkeley, Berkeley, CA, United States, 2University of California, San Francisco, San Francisco, CA, United States, 3Lawrence Berkeley National Laboratory, Berkeley, CA, United States, 4Helen Wills Neuroscience Institute, University of California, Berkeley, Berkeley, CA, United States
Synopsis
Keywords: Data Processing, Quantitative Susceptibility mapping
DECOMPOSE-QSM method is used to extract a sub-voxel level paramagnetic component susceptibility (PCS) in Alzheimer’s disease (AD) related neurodegeneration. Correlation between both PCS and thresholded QSM values with tau PET SUVr are studied. PCS shows stronger association strength with tau PET measures compared to susceptibility measured using only the thresholded positive voxels (positive QSM) in the QSM map in known regions related to tau pathological progression. By separating sub-voxel paramagnetic and diamagnetic sources, DECOMPOSE-QSM provides a more specific and sensitive measure of iron-related pathology.INTRODUCTION
In recent brain studies, Quantitative susceptibility mapping (QSM) has been used to measure Fe content1. However, the QSM of a voxel contains contributions from different sources of susceptibility: paramagnetic, diamagnetic, and neutral. Within one imaging voxel, the paramagnetic susceptibility of Fe may be negated by other diamagnetic sources such as myelin and aggregated proteins. Therefore, to obtain an accurate estimate of Fe it is imperative to separate voxel-level QSM measurement into paramagnetic component susceptibility (PCS) and, diamagnetic components susceptibility (DCS) on a sub-voxel level. This can be accomplished by a susceptibility compartmentalization algorithm such as DECOMPOSE-QSM2. In dementia caused by Alzheimer’s Disease (AD), tau neurofibrillary tangles (NFT) may colocalize Fe3. To get an accurate relationship between tau NFT accumulation and Fe, the association between tau positron emission tomography (PET) and a more sensitive measure of Fe is needed. In this work, regions of interest (ROIs) affected by tau pathology in patients located on the AD continuum are explored in terms of the association between tau PET and Fe accumulation. Fe accumulation has been assessed in two different metrics: the mean of all the positive QSM voxels in an ROI (denoted by positive QSM) and the mean PCS of the ROI. Association strength between positive QSM vs tau PET and PCS vs tau PET are compared. We show that the mean PCS results in a stronger association compared to positive QSM.METHODS
Data acquisitionMRI and PET data were collected at the memory and aging center (MAC) of the UCSF from patients with varying diagnoses (n = 23). All patients included in the study have positive tau PET with either mild cognitive impairment or amnestic dementia caused by AD. Demographic details: - Male/Female (10/13), age (65.71 ± 11.33), and MMSE (22.08 ± 4.91) displayed as mean ± standard deviation.
MRI scan
Multi-echo GRE with 8 echoes data was collected on a SIEMENS Prisma 3T scanner with TE1/ΔTE/TE8 of 4/5/39 ms and a native resolution of 0.86×0.86×2 mm3. T1 weighted structural image was acquired using an MPRAGE sequence with TE/TR of 2.9/2300ms and a resolution of 1×1×1 mm3. The MPRAGE image for each subject was segmented using Freesurfer 5.34,5 for normalizing the tau PET images and defining the ROIs for analysis.
tau PET
After intravenous injection of Flortaucipir (FTP, tau PET tracer), CT and tau PET scans were collected and processed using the standard procedure on a Siemens Biograph PET/CT scanner. Details of PET analysis can be found elsewhere6.
QSM and DECOMPOSE-QSM processing
QSM was calculated using STAR-QSM in STISuite7. The details of QSM reconstruction can be found elsewhere8. DECOMPOSE2 algorithm was used to compartmentalize voxel susceptibility into PCS and DCS.
ROI choice
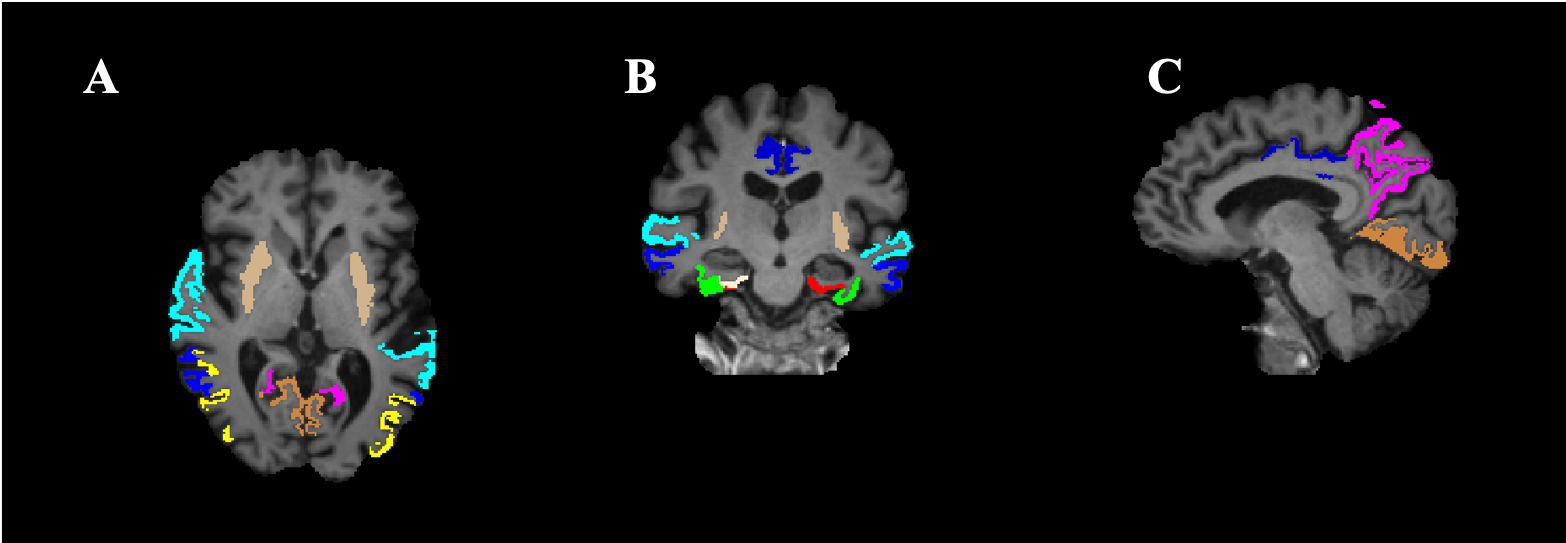
ROIs most frequently affected by tau pathology9,10 in the AD continuum were chosen for analysis. Some of those ROIs were excluded from the analysis because of noise or other artifacts. The ROIs are shown in Fig. 3.
Image registration and warping
Image registration was performed using ANTs11. Brain extraction was performed using FSL12. Freesurfer-produced ROI masks were warped to QSM, DECOMPOSE-QSM, and tau-PET image space to extract ROI mean metric values.
Statistical analysis
R and Rstudio were used for statistical analyses. Multiple comparisons based on permutation statistics were applied for the correction of the p-values13.
RESULTS
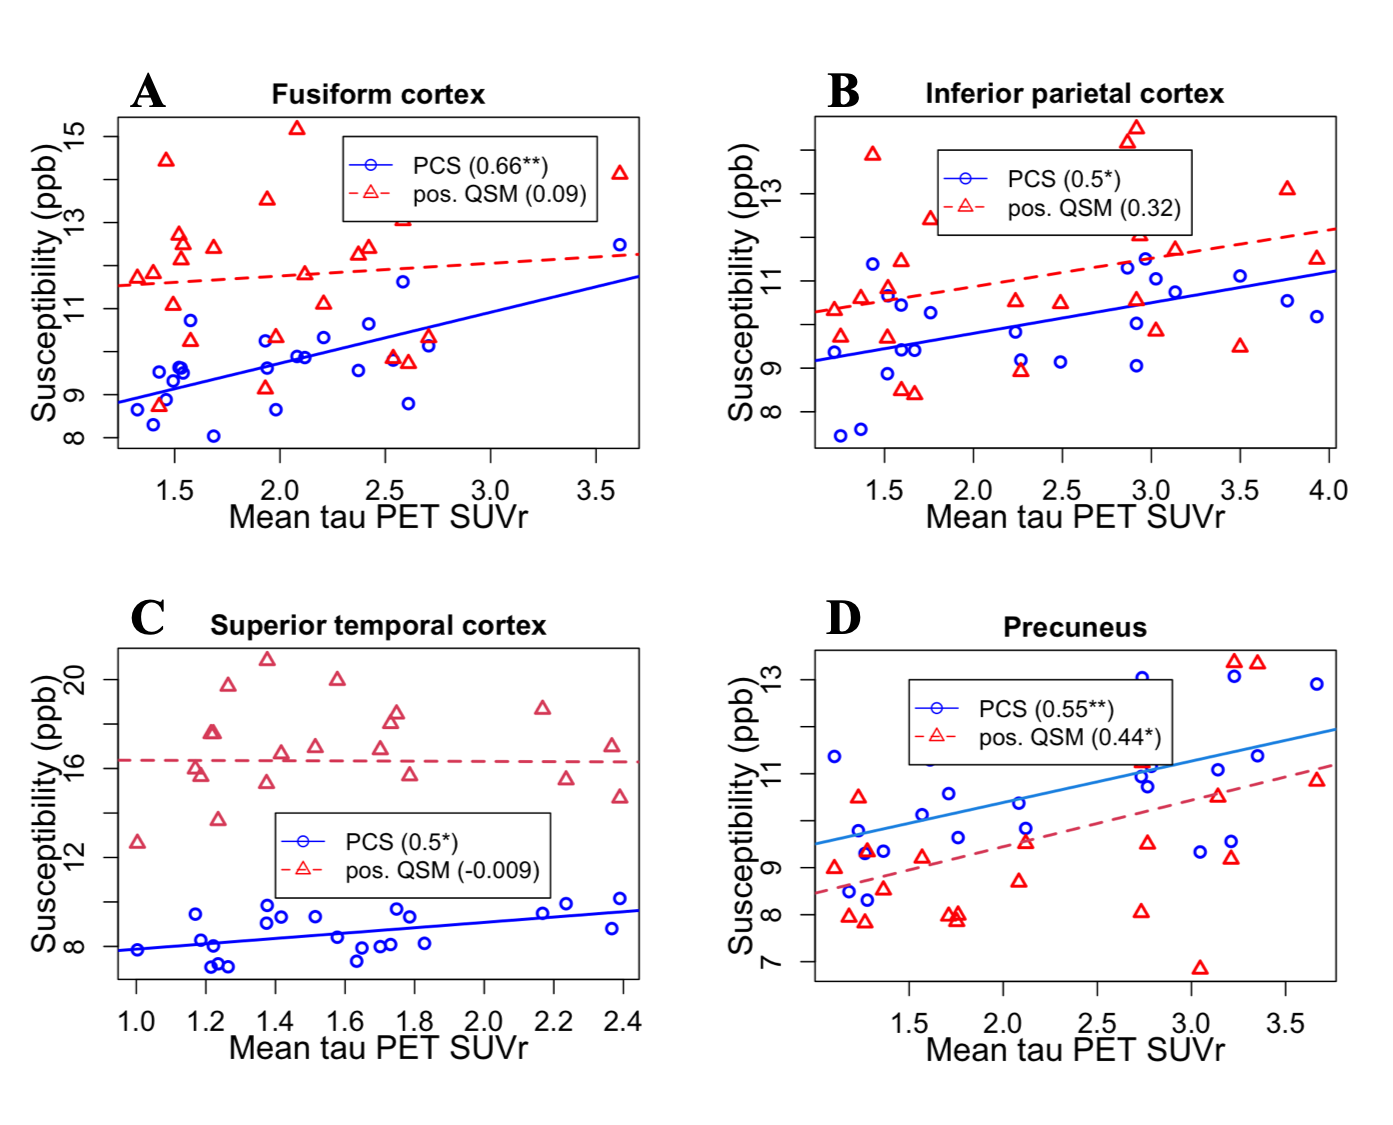
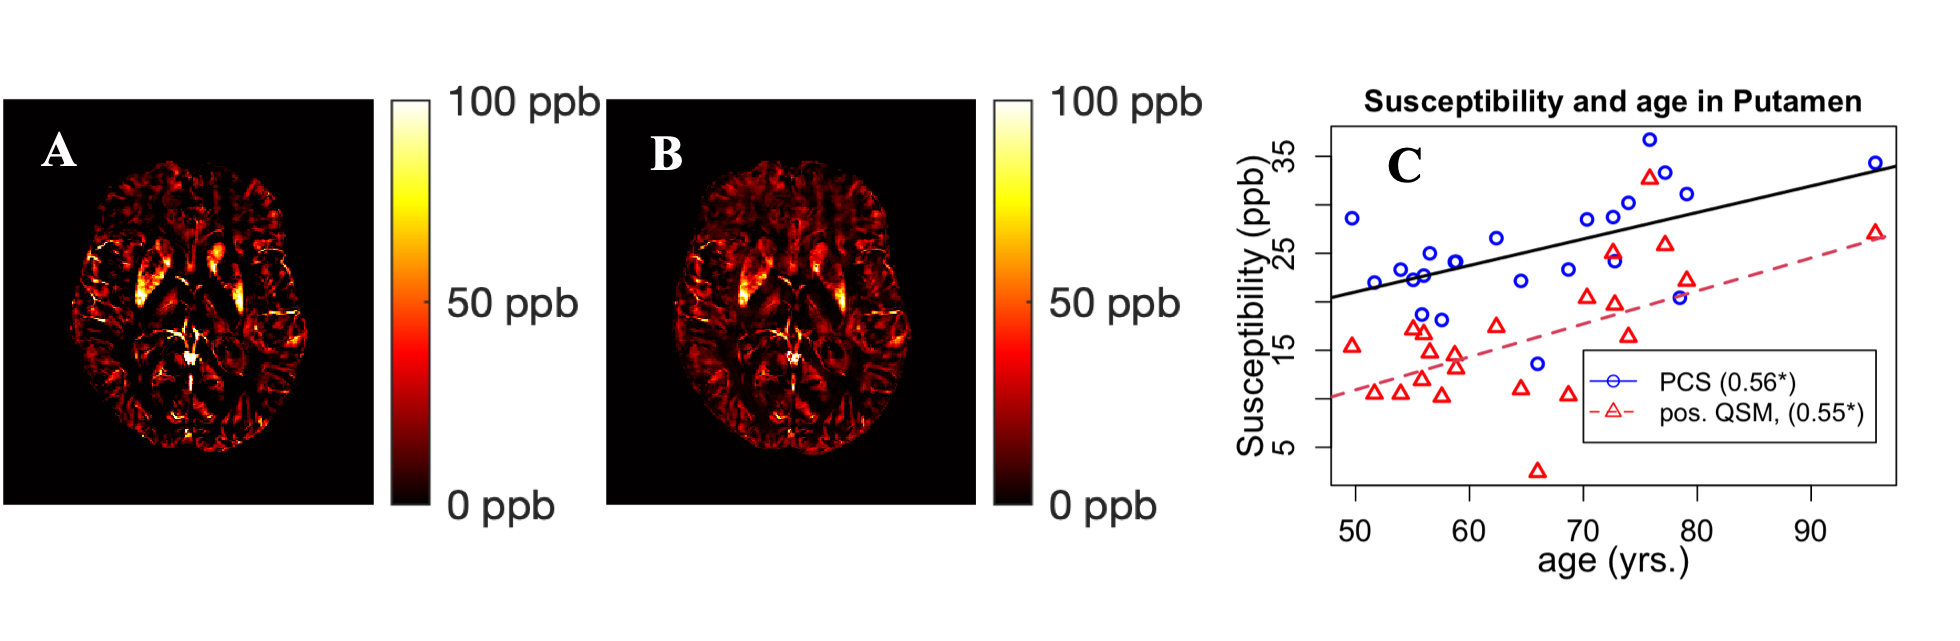
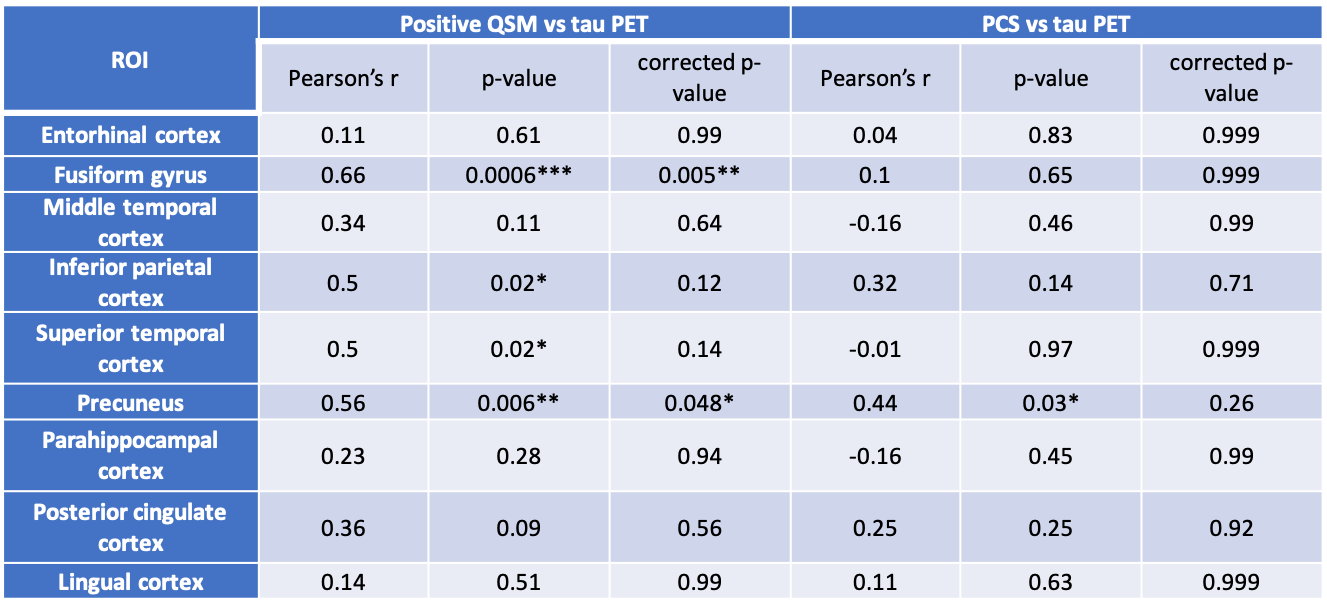
In the fusiform cortex, inferior parietal cortex, superior temporal cortex, and precuneus mean tau PET demonstrates a stronger association with PCS compared to positive QSM as evidenced by the correlation coefficients in Fig. 1. In other ROIs, a similar trend is seen as presented in Tab. 1. The association between PCS and tau PET is generally positive. In Fig. 2(a) the positive QSM map of a mid-axial slice for a patient with AD dementia is shown to contrast with the corresponding PCS map in Fig. 2(b). In Fig. 2(c) for subcortical putamen ROI, both positive QSM and PCS show a similar positive association with age.DISCUSSION
Sub-voxel-level PCS is a more sensitive measure of Fe accumulation compared to voxel-level positive QSM because it is free from the interference of the diamagnetic sources of susceptibility in the same voxel. Tau PET SUVr shows a strong positive Pearson correlation coefficient in the chosen ROIs because of the potential colocalization of Fe with these plaques3. The sensitivity of PCS is more evidenced by the visibly more continuous distribution of paramagnetic susceptibility across the brain slice in Fig. 2(b) when compared to that of the positive QSM in Fig. 2(a). A positive association between PCS and age in putamen also confirms the dependence of paramagnetic susceptibility on the Fe content in this subcortical ROI14. Because of a limited number of subjects, the analysis presented here suffers from a loss of statistical significance. A similar analysis performed using a larger set of data and other imaging modalities may reveal more meaningful information about AD pathological progression.CONCLUSION
PCS maps showing a stronger association in tau pathology-affected ROIs may pave ways to measure pathological changes in these regions using non-invasive MRI modalities more reliably.Acknowledgements
This work was supported in part by the Alzheimer's Drug Discovery Foundation through grant GC-201810-2017383 and the National Institute of Aging of the National Institutes of Health under Award Number R01AG070826. The content is solely the responsibility of the authors and does not necessarily represent the official views of the National Institutes of Health. The authors acknowledge all the researchers at the UCSF MAC involved in the collection and partial processing of the data.References
1. Langkammer, C. et al. Quantitative susceptibility mapping (QSM) as a means to measure brain iron? A post mortem validation study. Neuroimage 62, 1593–1599 (2012).
2. Chen, J., Gong, N., Chaim, K. T., Otaduy, M. C. G. & Liu, C. Decompose quantitative susceptibility mapping ( QSM ) to sub- voxel diamagnetic and paramagnetic components based on gradient-echo MRI data. Neuroimage 118477 (2021) doi:10.1016/j.neuroimage.2021.118477.
3. Spotorno, N. et al. Relationship between cortical iron and tau aggregation in Alzheimer’s disease. Brain 143, 1341–1349 (2020).
4. Fischl, B. Freesurfer. https://surfer.nmr.mgh.harvard.edu/.5. Fischl, B. FreeSurfer. Neuroimage 62, 774–781 (2012).
6. Adams, J. N., Maass, A., Harrison, T. M., Baker, S. L. & Jagust, W. J. Cortical tau deposition follows patterns of entorhinal functional connectivity in aging. Elife 8, 1–22 (2019).
7. Liu, C. STISuite. https://people.eecs.berkeley.edu/~chunlei.liu/software.html.
8. Liu, C. et al. Quantitative Susceptibility Mapping: Contrast Mechanisms and Clinical Applications. Tomography 1, 3–17 (2015).
9. Insel, P. S., Mormino, E. C., Aisen, P. S., Thompson, W. K. & Donohue, M. C. Neuroanatomical spread of amyloid β and tau in Alzheimer’s disease: implications for primary prevention. Brain Commun. 2, 1–11 (2020).
10. Cho, H. et al. In vivo cortical spreading pattern of tau and amyloid in the Alzheimer disease spectrum. Ann. Neurol. 80, 247–258 (2016).
11. Avants, B., Tustinson, N. & Johnson, H. ANTs. http://stnava.github.io/ANTs/.
12. Analysis Group, FMRIB & Oxford. fsl. https://fsl.fmrib.ox.ac.uk/fsl/fslwiki.
13. Mumford, J. Day 32: Permutation tests that control for multiple comparisons. https://www.youtube.com/watch?v=zg0tmnGGwBI&t=801s.
14. Li, W. et al. Differential developmental trajectories of magnetic susceptibility in human brain gray and white matter over the lifespan. Hum. Brain Mapp. 35, 2698–2713 (2014).
Figures