2416
Classification of low- and high-grade gliomas through multimodal temporal MRI and PET data1Biomedicine and Prevention, University of Rome Tor Vergata, Rome, Italy, 2Surgery and Cancer, Imperial College London, London, United Kingdom, 3Department of Surgery and Cancer, Imperial College London, London, United Kingdom, 4Computational Oncology Group - Department of Surgery and Cancer, Imperial College London, London, United Kingdom, 5Institute for Global Health Innovation, Imperial College London, London, United Kingdom, 6Centre for Clinical Brain Sciences, University of Edinburgh, Edimburgh, United Kingdom, 7Imperial College Healthcare NHS Trust, London, United Kingdom, 8Department of Radiology, Athinoula A. Martinos Center for Biomedical Imaging, Boston, NY, United States
Synopsis
Keywords: Data Processing, Modelling, Deep Learning, convolutional filters
Stratifying human brain gliomas using imaging techniques is extremely challenging. Valuable insight into the characterization and classification of gliomas can be provided by integrating two imaging modalities, i.e. 18F-FPIA PET and MRI. This study introduces a new approach for glioma stratification based on the extraction of temporal features from tissue time activity curves (TACs) extracted from dynamic PET/MRI data. We exploit tissue-specific biochemical properties embedded in the TACs through deep learning and achieve good discrimination results while foregoing pharmacokinetic fitting and hence invasive measurement of the AIF.Introduction
Gliomas are the most common primary brain tumours, and there is wide interest in imaging techniques able to stratify such lesions1. 18F-fluoropivalate (FPIA) PET/MRI integrates two imaging modalities that can help the discrimination of brain gliomas2. Both PET and MRI dynamic acquisitions provide maps of the spatiotemporal concentration of the tracer/contrast agent in vivo, conveying information about the delivery of the compound to tissue, its interaction with the target as well as its washout. Therefore, tissue time activity curves (TACs), along with the information about the concentration of the agent in the plasma, are typically employed for pharmacokinetic fitting. The primary disadvantage of this strategy is the necessity for invasive arterial blood sample collection as well as a priori choice of the pharmacokinetic model, which in turn is tracer dependent and non-univocous.We propose an alternative approach to glioma stratification based on the analysis of dynamic intensity patterns. In particular, we evaluate the potential of temporal features extracted from multimodal (i.e. dynamic PET and MRI images) TACs in discriminating high-grade gliomas (HGGs) from low-grade gliomas (LGGs) through deep learning models.
Materials and Methods
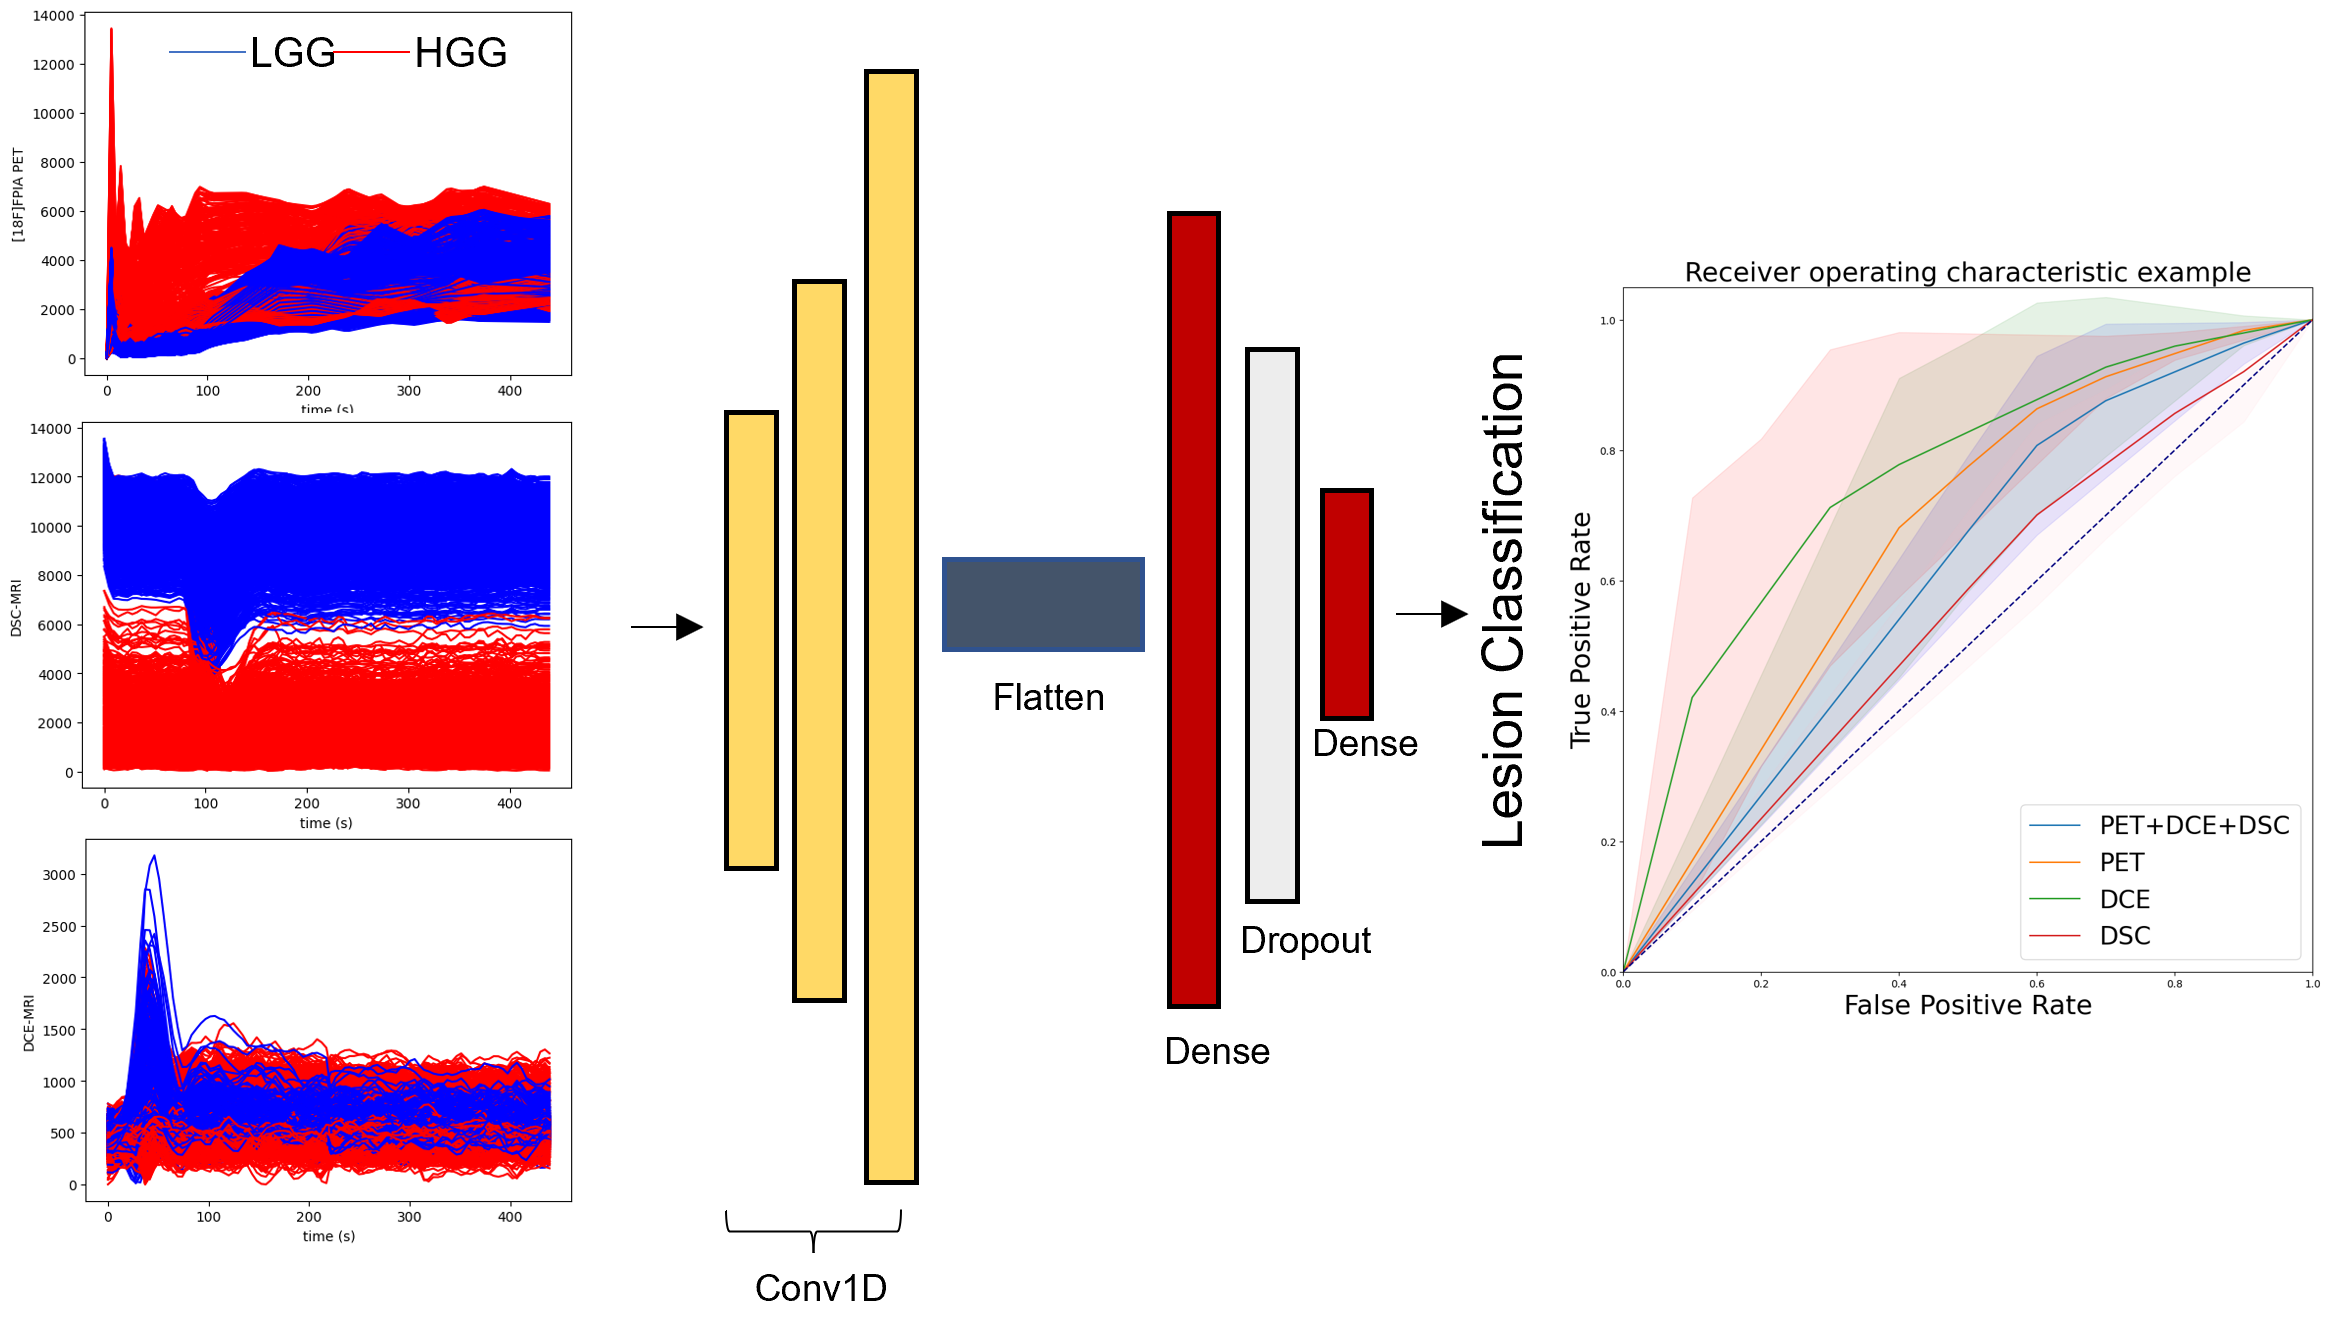
Dataset: 10 patients (4 low (WHO grade II) 6 high-grade (WHO grade III, IV) gliomas; age 31 to 79, mean (+/-SD) 59 ±15.9) were recruited for this study. 18F-FPIA PET/MR images were acquired on a Signa PET/MR scanner (GE Healthcare). For each patient, an average of 25202 (±14337) TACs were extracted voxelwise from dynamic contrast-enhanced (DCE), dynamic susceptibility contrast (DSC) and dynamic 18F-FPIA PET images using a lesion mask generated manually by an expert radiologist. TACs were linearly resampled onto a uniform time axis (96 time points) and standardized.Model and Implementation: The model consisted in three mono-dimensional convolutional layers using a gelu, tanh and relu activation functions, respectively. The filter size was set to 8, 16 and 32, the kernel sizes to 4 and the strides to 5. The output of the last convolutional layer was flattened into one fully connected layer with 64 neurons using a relu activation function followed by 0.25 Dropout layer and the last softmax layer for classification (Figure 1). All experiments were conducted using Python version 3.8, the Keras deep learning library, using TensorFlow as the backend. We employed a Linux machine and two Nvidia Pascal TITAN X graphics cards with 12 GB RAM each. The data was split into training and test sets (80/20), and hyperparameter optimization within the train set was performed in a threefold cross validation fashion. An early stopping method was used to select the optimum number of training epochs and the batch size (Keras callback function monitoring the loss function with patience set to 10). Performances were evaluated on test set using both mono- and multimodal TACs to assess the contribution of each imaging modality.
Results
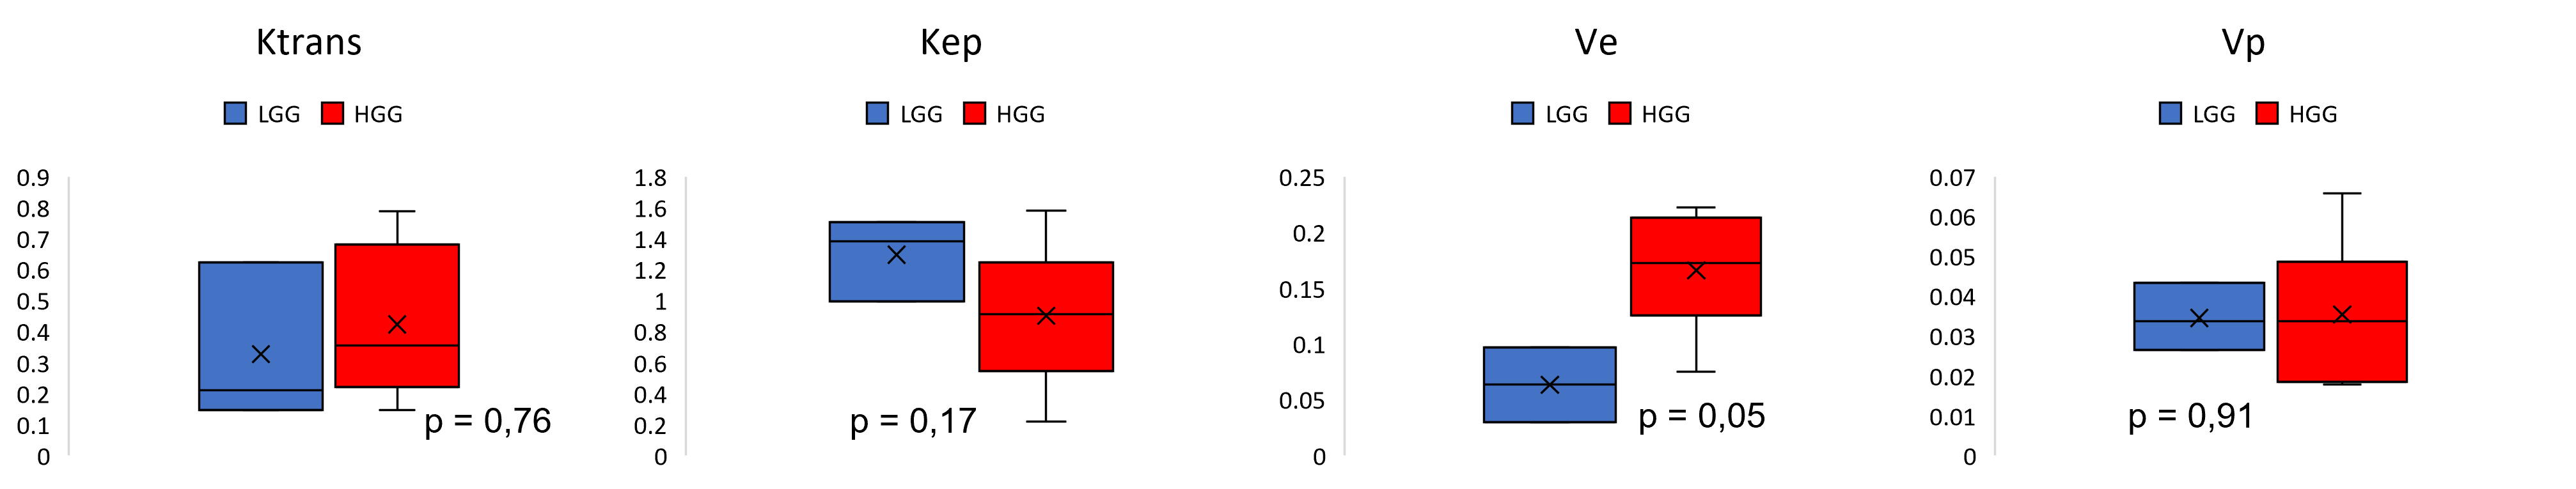
Multimodal and monomodal TACs (from one single modality at a time, e.g. PET, DCE and DSC) were used to train the model multiple times, validation results are summarized in Table 1. Performances are expressed in terms of area under the receiver operating characteristic curve (AUC), accuracy, precision and recall. The AUCs are also plotted in Figure 1. Comparable performances were obtained from both single and multimodal TAC classification, except for DCE-TACs which delivered the highest accuracy (88%) and an AUC of 0.8 (Table 1, Figure 1). The worst performance was obtained by DSC-TACs which delivered 61% accuracy and 0.53 AUC. Interestingly, DCE-derived perfusion parameters obtained fitting five pharmacokinetic models (Toft’s3, extended Toft’s3, shutter speed4, extended shutter speed5 and non-exchange model)6 and averaged over the whole lesion were not statistically different between LGG and HGG (p > 0.05, Figure 2).Discussion and Conclusions
Gliomas are the most frequent primary brain tumours, and stratifying their behaviour is a growing field of research. 18F-FPIA PET/MRI allows the assessment of several tumour characteristics such as cell proliferation (using fluoropivalate)2 whose crucial source of nutrition is thought to be provided by fatty acids, and their blood brain barrier integrity (through the evaluation of gadolinium-based contrast agent perfusion and permeability, i.e. DCE and DSC-MRI sequences). Dynamic PET/MRI acquisitions contain information about time evolution of the signal and how it is affected by the biochemical properties of the tissue under investigation. However, full quantification of dynamic PET/MRI data requires both information about tracer/contrast agent concentration in plasma (AIF), and a priori election of the kinetic model. In turn, this can affect the reproducibility and reliability of pharmacokinetic studies, which often show discordant results.Our pilot study, even if limited by the small sample size, introduces a promising new approach for the classification of tumor grade based on time series processing7, hence overcoming the challenge of pharmacokinetic model fitting6,8, which in the case of PET often includes arterial cannulation for AIF calculation8.
Acknowledgements
All authors declare that they have no known conflicts of interest in terms of competing financial interests or personal relationships that could have an influence or are relevant to the work reported in this paper. The Titan V GPUs employed in this research were generously donated to NT by NVIDIA. Matteo Ferrante and Tommaso Boccato are PhD students enrolled in the National PhD in Artificial Intelligence, XXXVII cycle, course on Health and life sciences, organized by Università Campus Bio-Medico in Rome (Italy). Marianna Inglese is supported by the NANOINFORMATIX project which has received funding from the European Union’s Horizon 2020 research and innovation programme under grant agreement No 814426. The authors also acknowledge support from Imperial-NIHR-Biomedical-Research-Centre and Imperial-Experimental-Cancer-Medicine’s-Centre awards.References
1. Gao, H. & Jiang, X. Progress on the diagnosis and evaluation of brain tumors. Cancer Imaging 13, 466–481 (2013).
2. Dubash, S. R. et al. Clinical translation of 18F-fluoropivalate – a PET tracer for imaging short-chain fatty acid metabolism: safety, biodistribution, and dosimetry in fed and fasted healthy volunteers. Eur J Nucl Med Mol Imaging 47, 2549–2561 (2020).
3. Tofts, P. S. et al. Estimating kinetic parameters from dynamic contrast-enhanced T(1)-weighted MRI of a diffusable tracer: standardized quantities and symbols. J Magn Reson Imaging 10, 223–232 (1999).
4. Yankeelov, T. E., Rooney, W. D., Li, X. & Springer, C. S. Variation of the relaxographic ‘shutter-speed’ for transcytolemmal water exchange affects the CR bolus-tracking curve shape. Magn Reson Med 50, 1151–1169 (2003).
5. Li, X., Rooney, W. D. & Springer, C. S. A unified magnetic resonance imaging pharmacokinetic theory: intravascular and extracellular contrast reagents. Magn Reson Med 54, 1351–1359 (2005).
6. Inglese, M. et al. Reliability of dynamic contrast-enhanced magnetic resonance imaging data in primary brain tumours: a comparison of Tofts and shutter speed models. Neuroradiology 61, 1375–1386 (2019).
7. Inglese, M., Duggento, A., Boccato, T., Ferrante, M. & Toschi, N. Spatiotemporal learning of dynamic positron emission tomography data improves diagnostic accuracy in breast cancer. Annu Int Conf IEEE Eng Med Biol Soc 2022, 186–189 (2022).
8. Parker, G. J. M. et al. Experimentally-derived functional form for a population-averaged high-temporal-resolution arterial input function for dynamic contrast-enhanced MRI. Magn Reson Med 56, 993–1000 (2006).
Figures