2405
qMRpy: a cross-platform, extensible and easy-to-use open-source Python toolbox for efficient estimation of quantitative MR properties1IRCCS Stella Maris, Pisa, Italy
Synopsis
Keywords: Software Tools, Software Tools
Quantitative MRI methods improve tissue characterization and allow for better longitudinal assessment, but need efficient and reliable fitting routines. Currently available qMR frameworks, while covering a wide range of applications, suffer either from a relatively low efficiency or require non-trivial compilation steps. Here, we propose an open-source framework for qMR quantification which maintains a good computational efficiency without sacrificing the readability and customizability of the code.Introduction
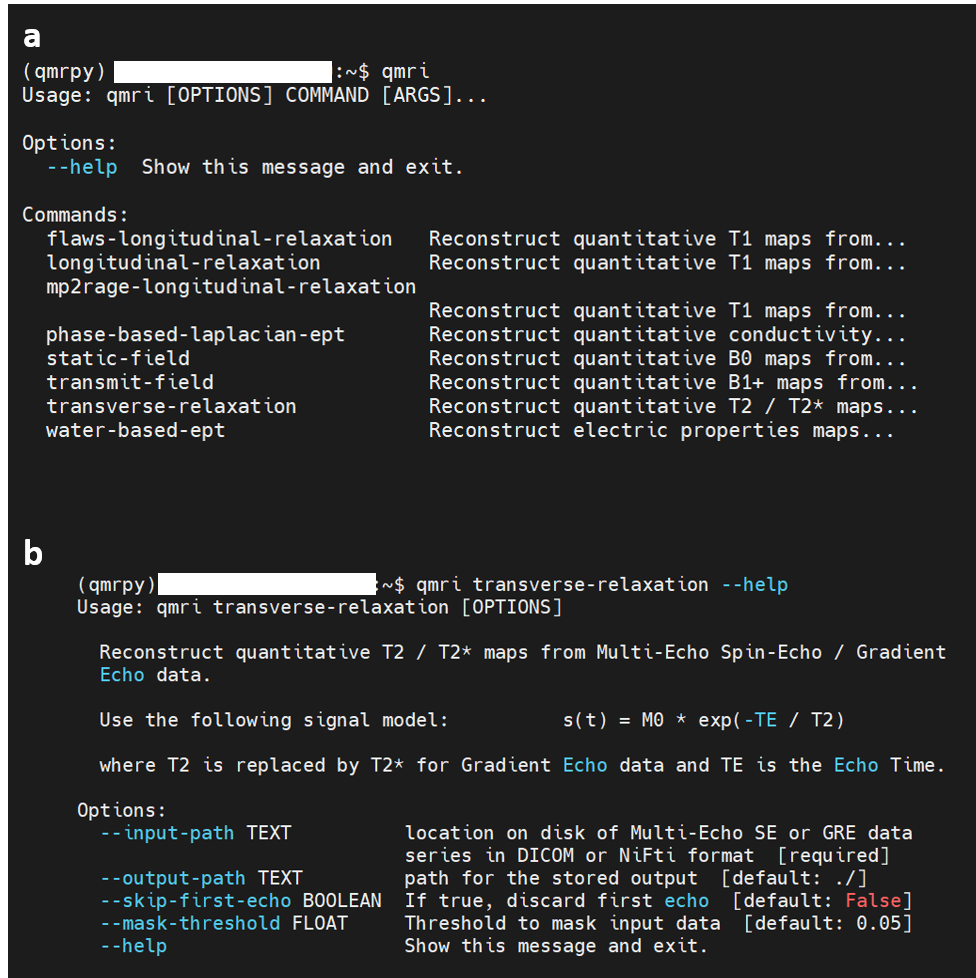
Quantitative MRI methods can improve specificity and reproducibility of the diagnosis1, but it needs the availability of efficient and reliable routines to calculate the desired maps of tissue properties by fitting the appropriate signal model to the acquired data. Several frameworks providing fitting routines for different quantitative methods are currently available, such as qMRLab2 and QUIT3, which cover a wide range of applications and provide easy-to-use interfaces. However, these frameworks either suffer from a relatively low computational efficiency2 requiring expensive additional toolboxes to achieve reasonable reconstruction times, or rely on low-level language extensions3 which require potentially non-trivial compilation steps, thus limiting the cross-platform portability. In addition, support for DICOM format is absent in these frameworks, therefore limiting the compatibility of the reconstructed maps with vendor-provided viewers. Here, we propose a Numba accelerated Python-based qMRI framework, which maintains cross-platform portability while achieving a good computational efficiency. Our framework includes flexible handling of both DICOM and NIfTI files and provides an user-friendly Command Line Interface for integration in automatic pipelines. The framework will be made publicly available under https://github.com/FiRMLAB-Pisa/qmr-py to interested researchers.Methods
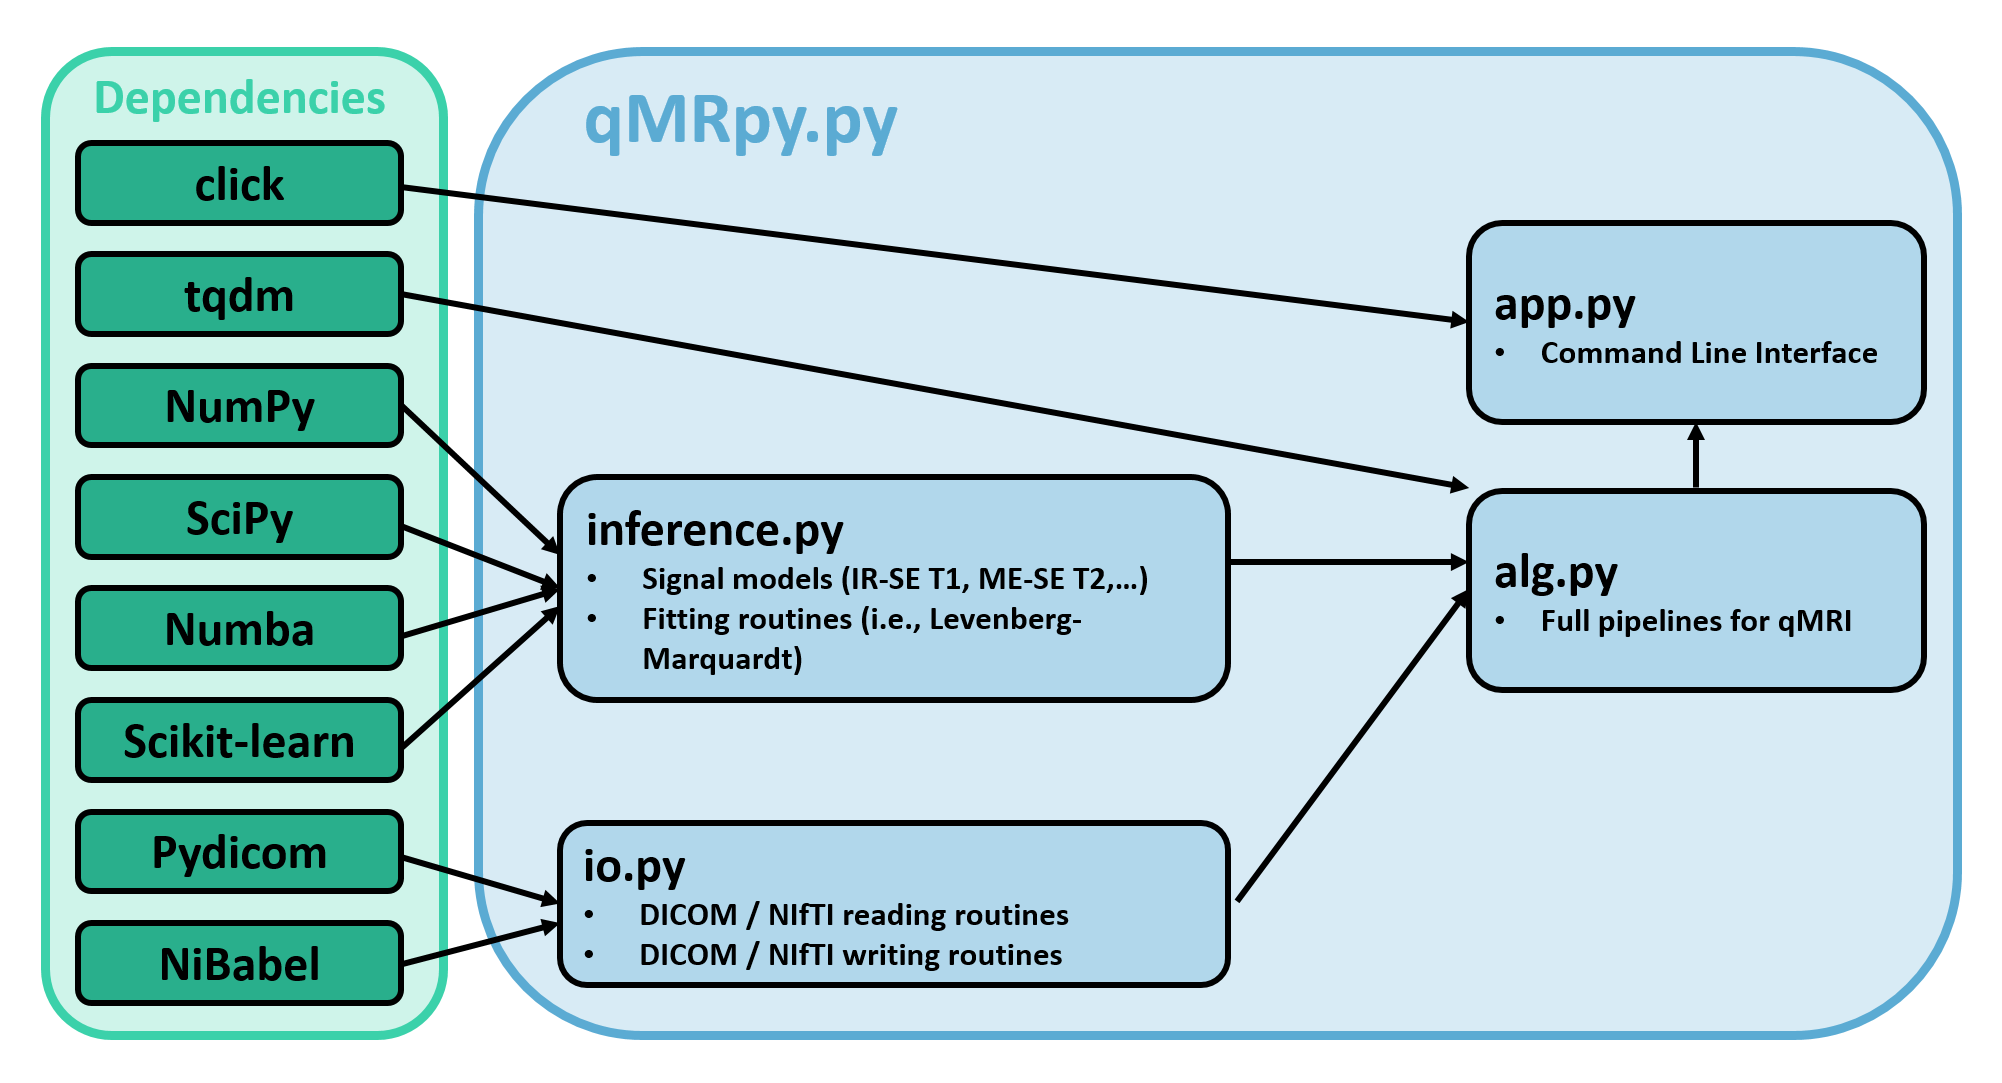
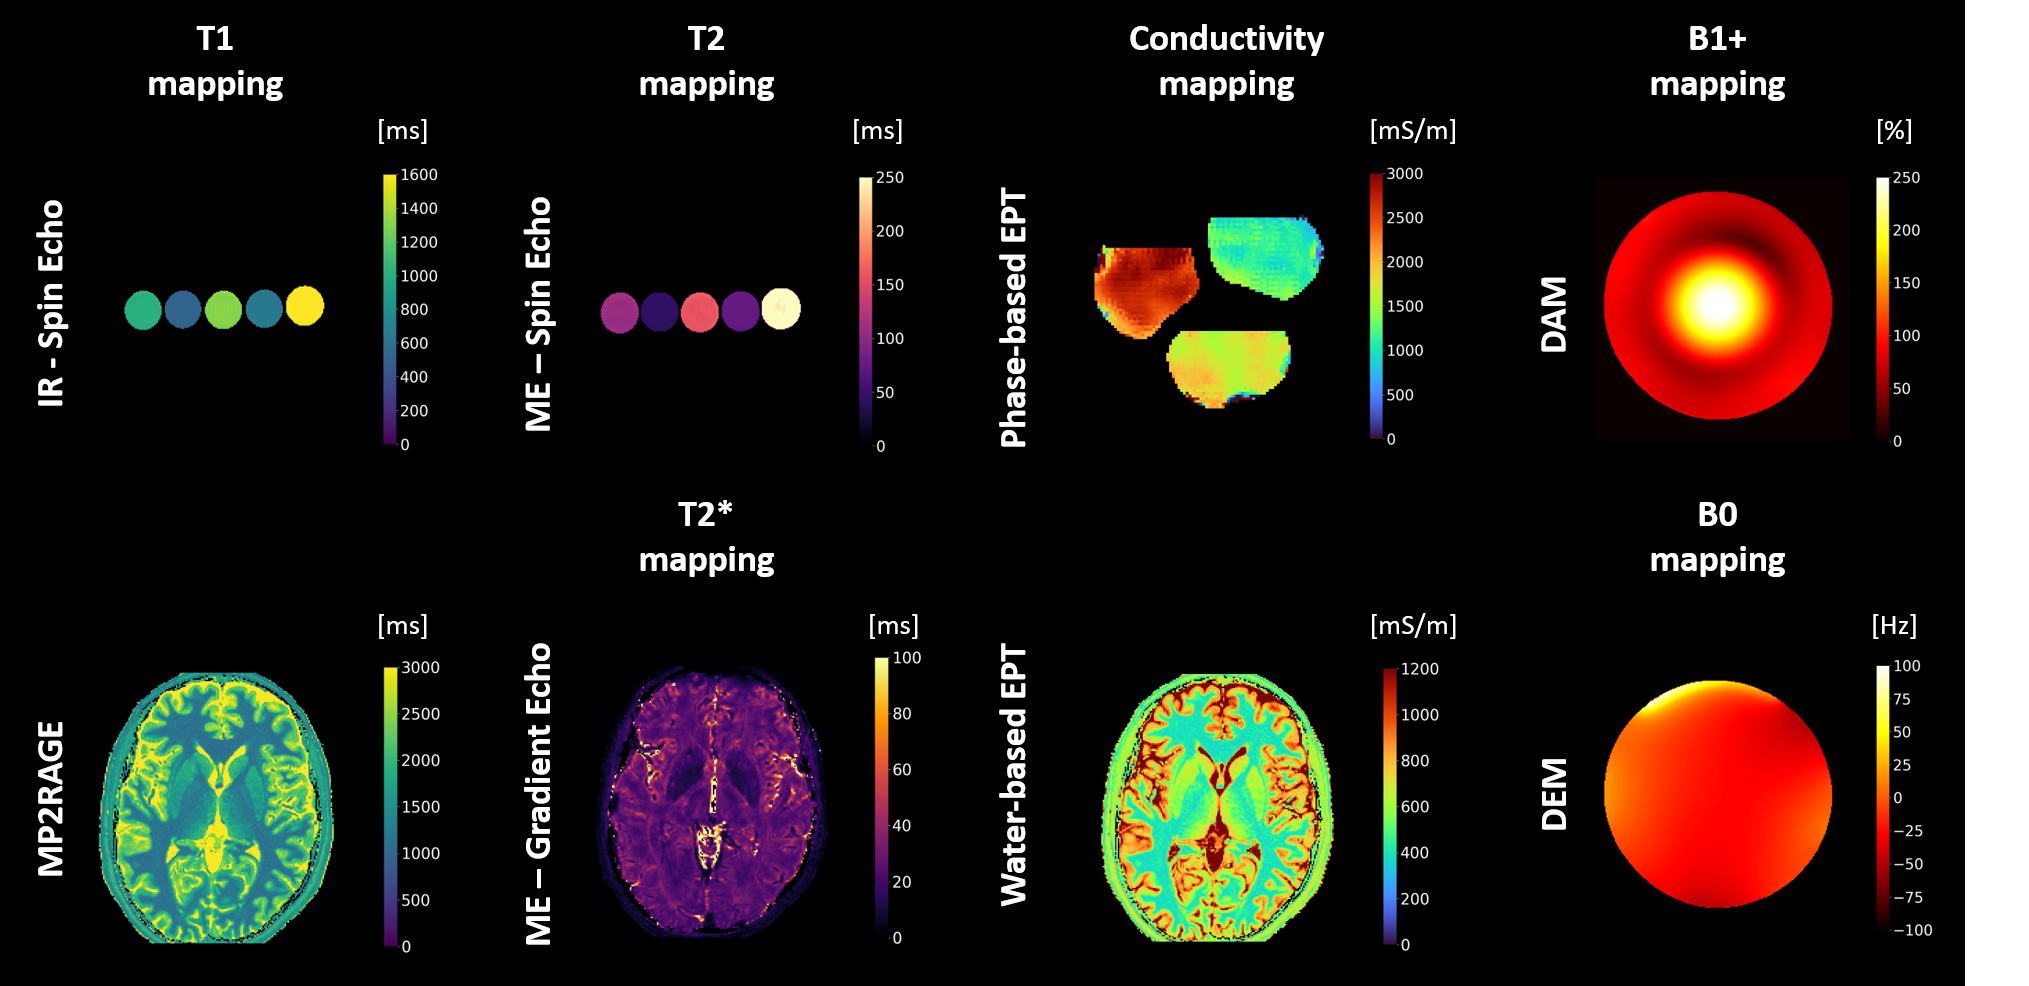
Software architecture: qMRpy is written in Python 3.7 to enable portability across different platforms and has a modular structure to facilitate its re-usability and extension. The software architecture is shown in Figure 1. The core parts of qMRpy are an input-output (io.py) and an inference module (inference.py). The input-output module consists of the routines to load previously reconstructed images in DICOM and NIfTI formats to be used for parameter estimation and save the reconstructed images to disk for subsequent analysis. Reading routines can easily handle data acquired with MR scanners from the three major vendors (GE, Siemens and Philips) while writing routines provide valid images ready to be consumed by medical viewers softwares by using the input data as a template. The inference module contains both the signal models corresponding to different qMRI acquisitions (i.e., Inversion-Recovery Spin Echo T1 mapping, Multi-Echo Gradient Echo T2* mapping) and the numerical routines to perform parameter fitting given the input data (in the form of NumPy arrays) and the correct signal model. Both core modules use well-maintained libraries as a backend (such as NumPy, SciPy and Pydicom) to minimize dependency complexity. Computational efficiency is achieved by accelerating both signal models and fitting routines using Numba, a Just-In-Time compiler for Python, also enabling parallelized inference across multiple voxels. In addition, the software contains a pre-built set of quantification pipelines; currently supported qMRI techniques are:- Inversion-Recovery Spin-Echo (IR-SE) T1 mapping
- MP2RAGE T1 mapping4
- Multi-Echo Spin-Echo (ME-SE) T2 mapping
- Multi-Echo GRadient-Echo (ME-GRE) T2* mapping
- Phase-based Conductivity mapping5,6
- Water-based Electrical Properties Tomography7
- Double Angle Method (DAM) B1+ mapping
- Dual Echo Method (DEM) B0 mapping
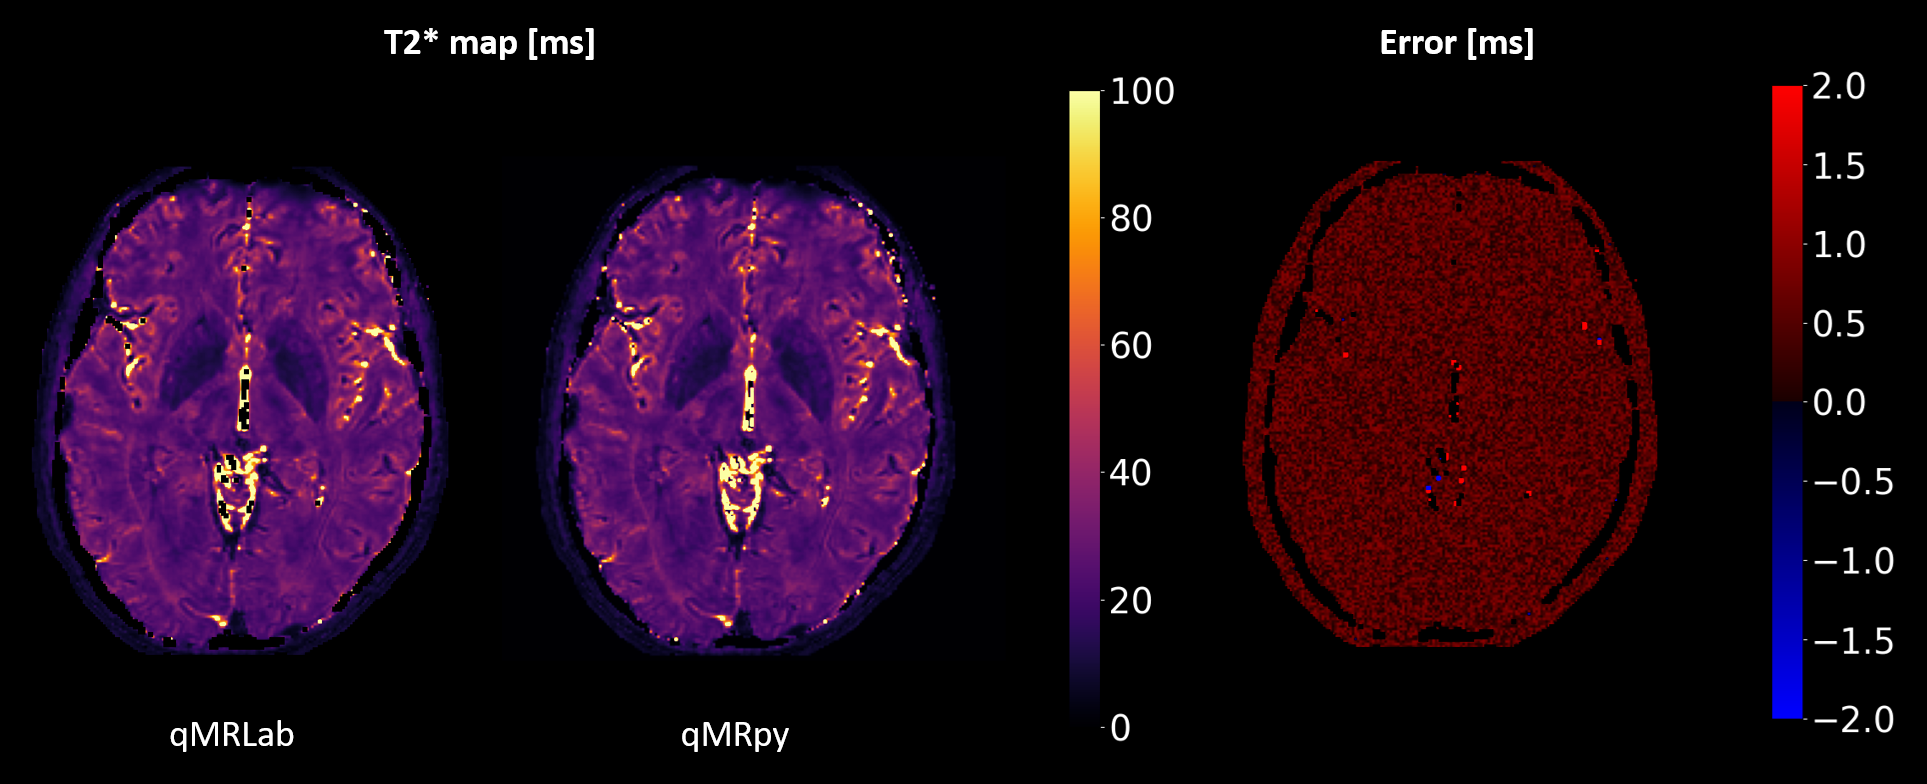
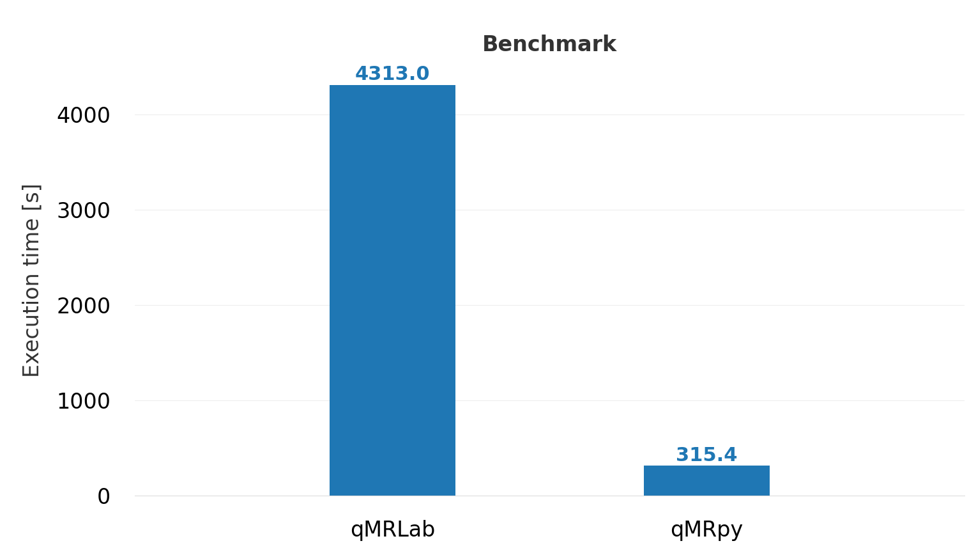
Validation and benchmark: To validate our software, we computed T2* maps from multi-echo Gradient Echo data (whole brain coverage, 200x200x200 matrix size for a 1 mm isotropic resolution, 9 echoes, TEmin = 3.3ms, echo spacing = 3.6ms) of an healthy volunteer, acquired on a GE Healthcare Signa 7T scanner using a 2-channels Tx / 32-channels Rx head coil. As a reference, we computed T2* maps using qMRLab, a flexible and well-established toolbox for qMRI mapping written in MATLAB/Octave. Fitting was restricted to the voxels with a magnitude higher than 5% of the maximum, and the same mask was used both for qMRpy and qMRLab fittings. Quantification accuracy of qMRpy was measured assuming the result of qMRLab as the ground truth, and the two softwares were compared in terms of execution time on a Linux workstation equipped with a 24 cores CPU (with 2 threads per core) and 128 GB of RAM.
Results and Discussion
Figure 4 shows the comparison between qMRpy and qMRLab derived T2* maps. The two implementations provide the same result, as the voxel wise difference remains below 2ms except for some voxels belonging to CSF where the fit is not well-conditioned. In terms of execution times, qMRpy outperforms qMRLab, reaching an order of magnitude of speed-up thanks to the parallelization enabled by Numba. As the codebase is based on pure Python, without low-level language extensions, the package is easy to customize and to distribute to different platforms, and does not require the purchase of expensive licenses. Thanks to its Command Line Interface, qMRpy-based routines can be easily integrated in automated (e.g., bash-based) pipelines, and its flexible I/O module allows for examination of the reconstructed maps on both vendor-provided and third-party image viewers.Conclusion
We developed an easy-to-use and extensible open-source framework for the estimation of quantitative properties from MR images, which maintains a good computational efficiency without sacrificing the readability and customizability of the code.Acknowledgements
The results presented here have been developed in the framework of the 18HLT05 QUIERO Project. This project has received funding from the EMPIR Programme co-financed by the Participating States and from the European Union’s Horizon 2020 Research and Innovation Programme. Support from the Italian Ministry of Health under the grant RC 2022 and “5 per mille” to IRCCS Fondazione Stella Maris.References
1. Tofts P. Quantitative MRI of the Brain: Measuring Changes Caused by Disease. Wiley (2003)
2. Karakuzu A, Boudreau M, Duval T, et al. qMRLab: Quantitative MRI analysis, under one umbrella. J Open Source Softw. 2020;5(53):2343. doi:10.21105/joss.02343
3. Wood TC. QUIT: QUantitative Imaging Tools. J Open Source Softw. 2018;3(26):656. doi:10.21105/joss.00656
4. Marques JP, Kober T, Krueger G, van der Zwaag W, Van de Moortele PF, Gruetter R. MP2RAGE, a self bias-field corrected sequence for improved segmentation and T1-mapping at high field. NeuroImage. 2010;49(2):1271-1281. doi:10.1016/j.neuroimage.2009.10.002
5. Voigt T, Katscher U, Doessel O. Quantitative conductivity and permittivity imaging of the human brain using electric properties tomography. Magn Reson Med. 2011;66(2):456-466. doi:10.1002/mrm.22832
6. Karsa A, Shmueli K. New Approaches for Simultaneous Noise Suppression and Edge Preservation to Achieve Accurate Quantitative Conductivity Mapping in Noisy Images. In: Proceedings of the 29th International Society for Magnetic Resonance in Medicine; 2021. https://archive.ismrm.org/2021/3774.html
7. Michel E, Hernandez D, Lee SY. Electrical conductivity and permittivity maps of brain tissues derived from water content based on T1-weighted acquisition. Magn Reson Med. 2017;77(3):1094-1103. doi:10.1002/mrm.26193
Figures