2400
A toolbox of chi-separation for magnetic susceptibility source separation1Biomedical Engineering, Hankuk University of Foreign Studies, Yongin, Korea, Republic of, 2Electrical and Computer Engineering, Seoul National University, Seoul, Korea, Republic of, 3Johns Hopkins University School of Medicine & Kennedy Krieger Institute, Baltimore, MD, United States
Synopsis
Keywords: Software Tools, Quantitative Susceptibility mapping, Chi-separation
The susceptibility maps generated by QSM and $$$\chi$$$-separation show magnetic susceptibility distributions, which have been proposed as important biomarkers for brain disorders. However, susceptibility mapping requires a complicated multi-step procedure that is difficult for inexperienced researchers. There is a need to design a convenient application that can easily conduct susceptibility mapping. In this work, we developed a MATLAB based GUI software, called the ‘$$$\chi$$$-separation toolbox’ that generates high-quality susceptibility maps in just a few clicks. The GUI of our toolbox is intuitive and user-friendly that it helps researchers to conduct QSM and $$$\chi$$$-separation processing without difficulty.Introduction
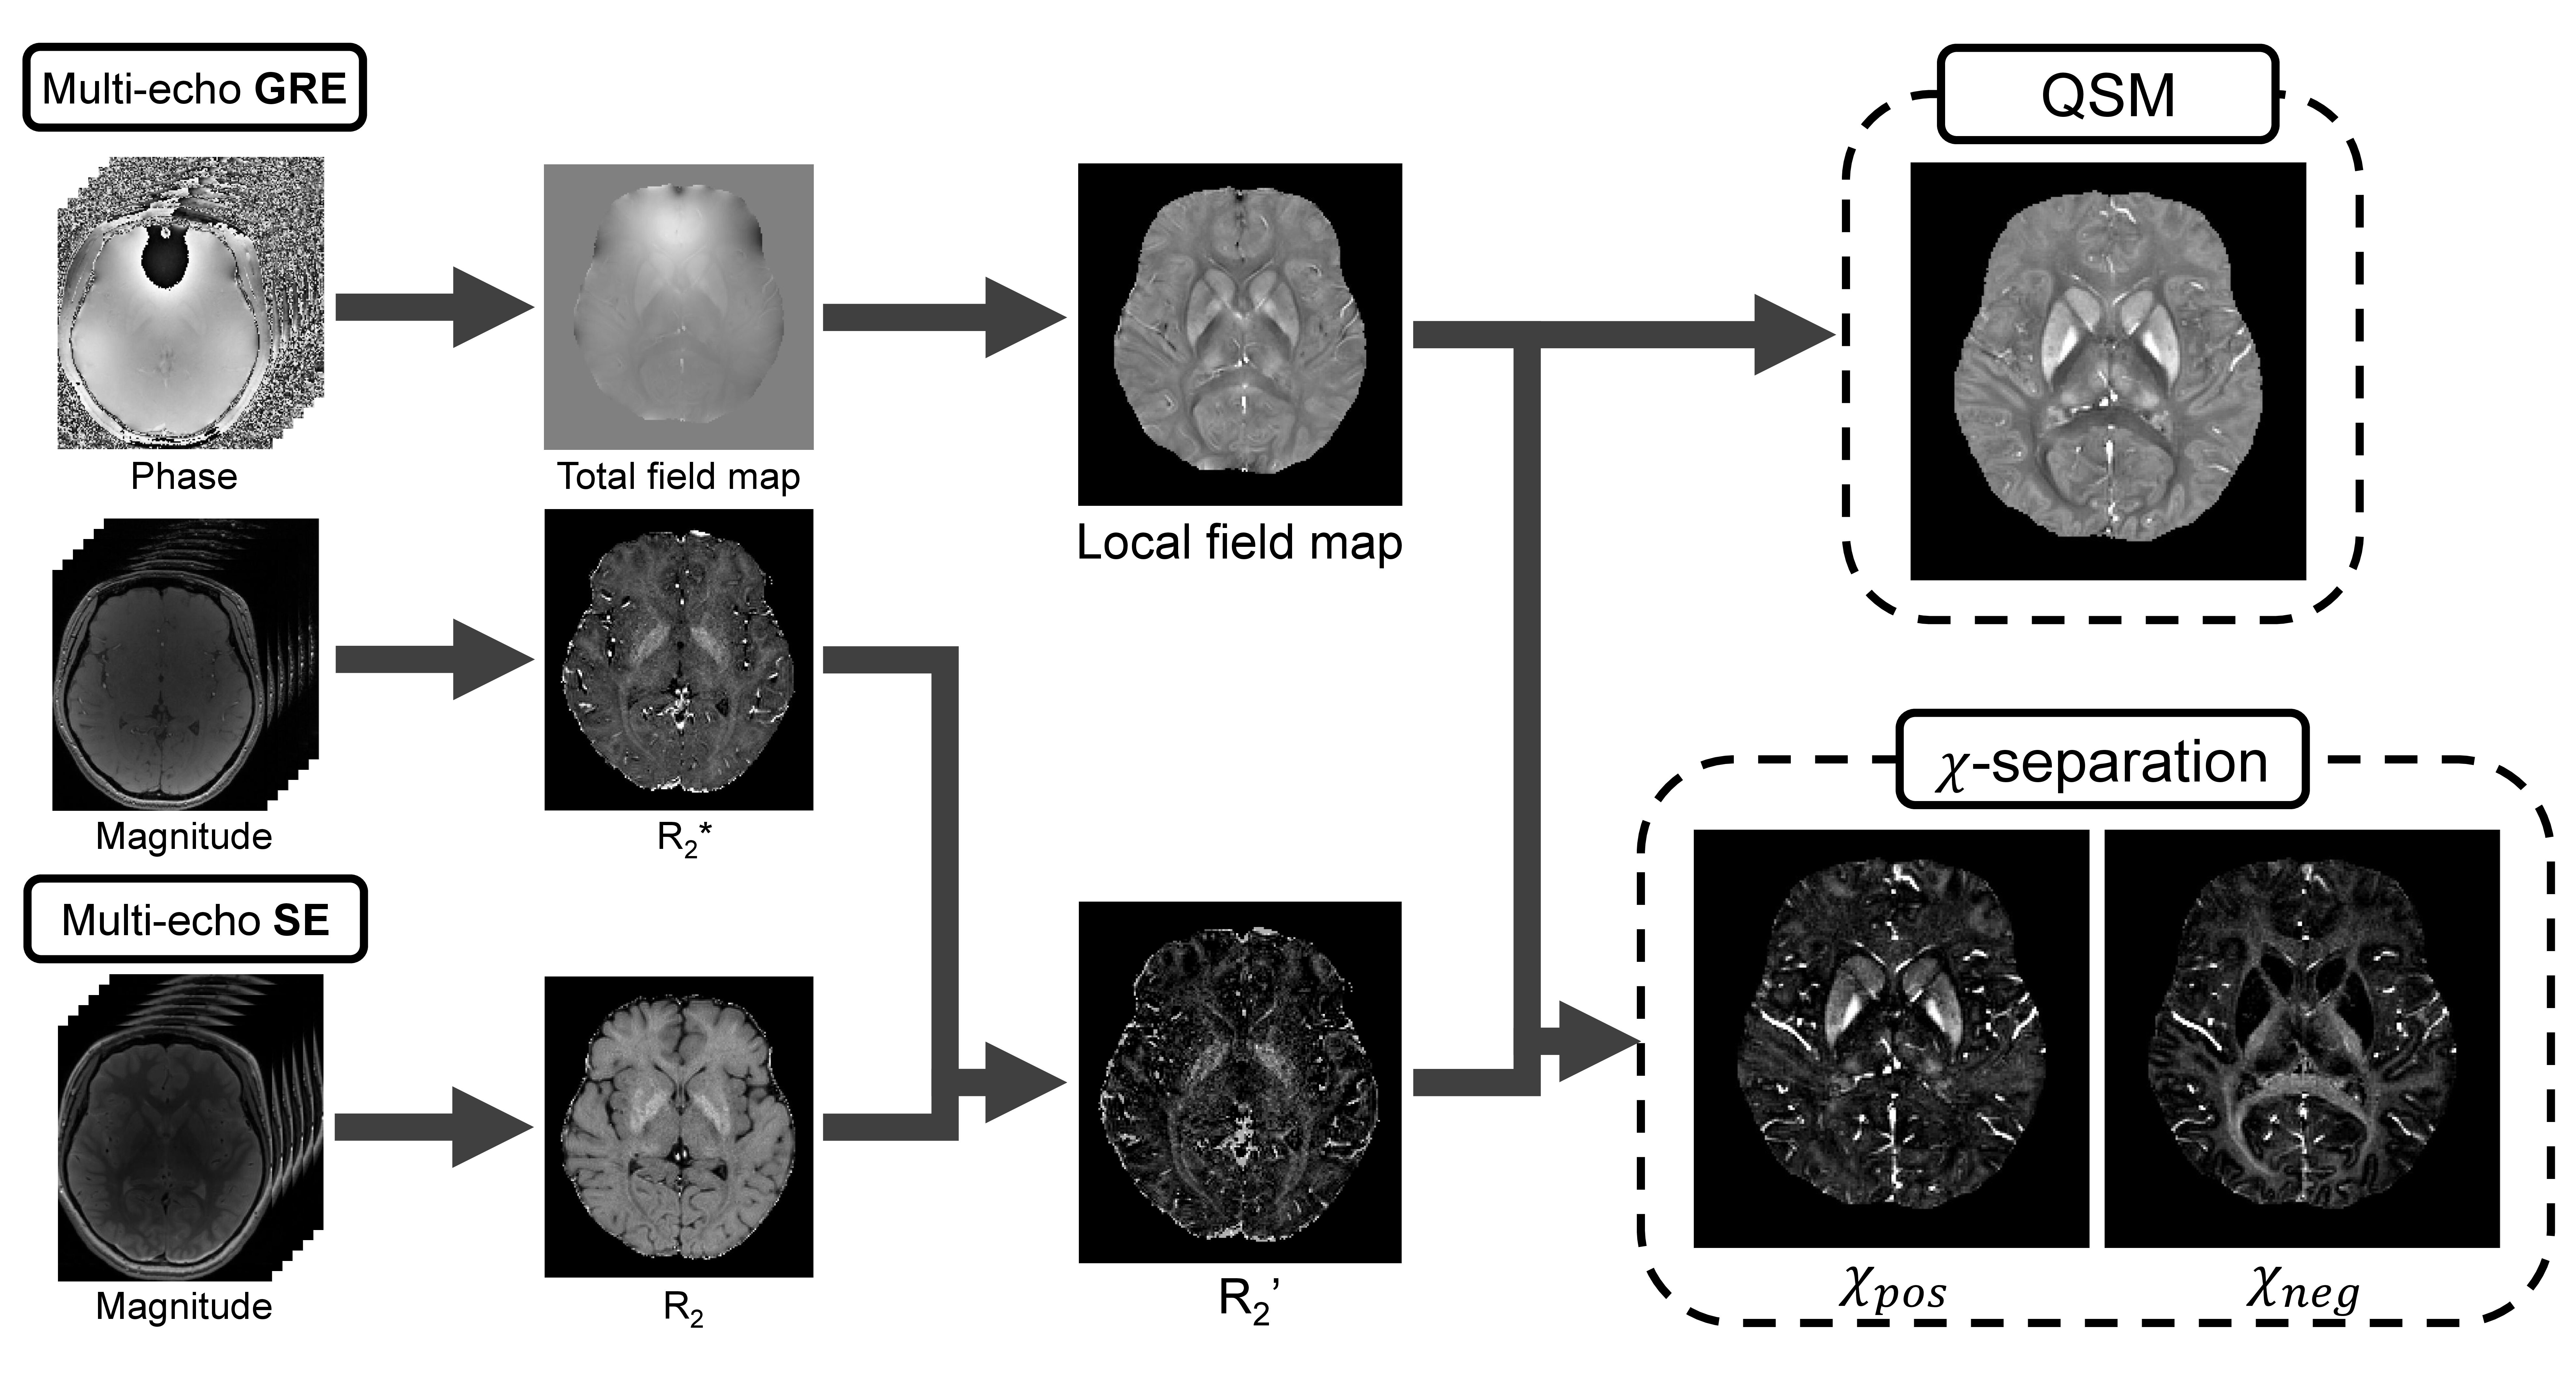
Quantitative Susceptibility Mapping (QSM) is an advanced MR imaging technique which provides distribution of magnetic susceptibility in the brain. Several studies suggested QSM can be a biomarker for neurological disorders1-6, such as multiple sclerosis and Parkinson’s disease. The QSM result includes both positive and negative susceptibilities. Since iron and myelin have opposite magnetic susceptibility characteristics, the separation of positive and negative susceptibility sources can help the accurate diagnosis. Recently, Shin et al developed $$$\chi$$$-separation7 technique which can measure individual contributions of paramagnetic and diamagnetic susceptibility sources by formulating the biophysical model and solving the minimization problem. The results of the experiments demonstrated that $$$\chi$$$-separation successfully separated the two sources. However, as shown in Fig. 1, susceptibility mapping requires a complicated procedure that is difficult for inexperienced researchers or clinicians. There is a need to design a convenient tool that can easily conduct $$$\chi$$$-separation.In this work, we developed a MATLAB based GUI software, called the ‘$$$\chi$$$-separation toolbox’ to generate high-quality susceptibility maps without using command line. The ‘$$$\chi$$$-separation toolbox’ provides high-quality QSM map as well as positive and negative susceptibility maps.
Methods
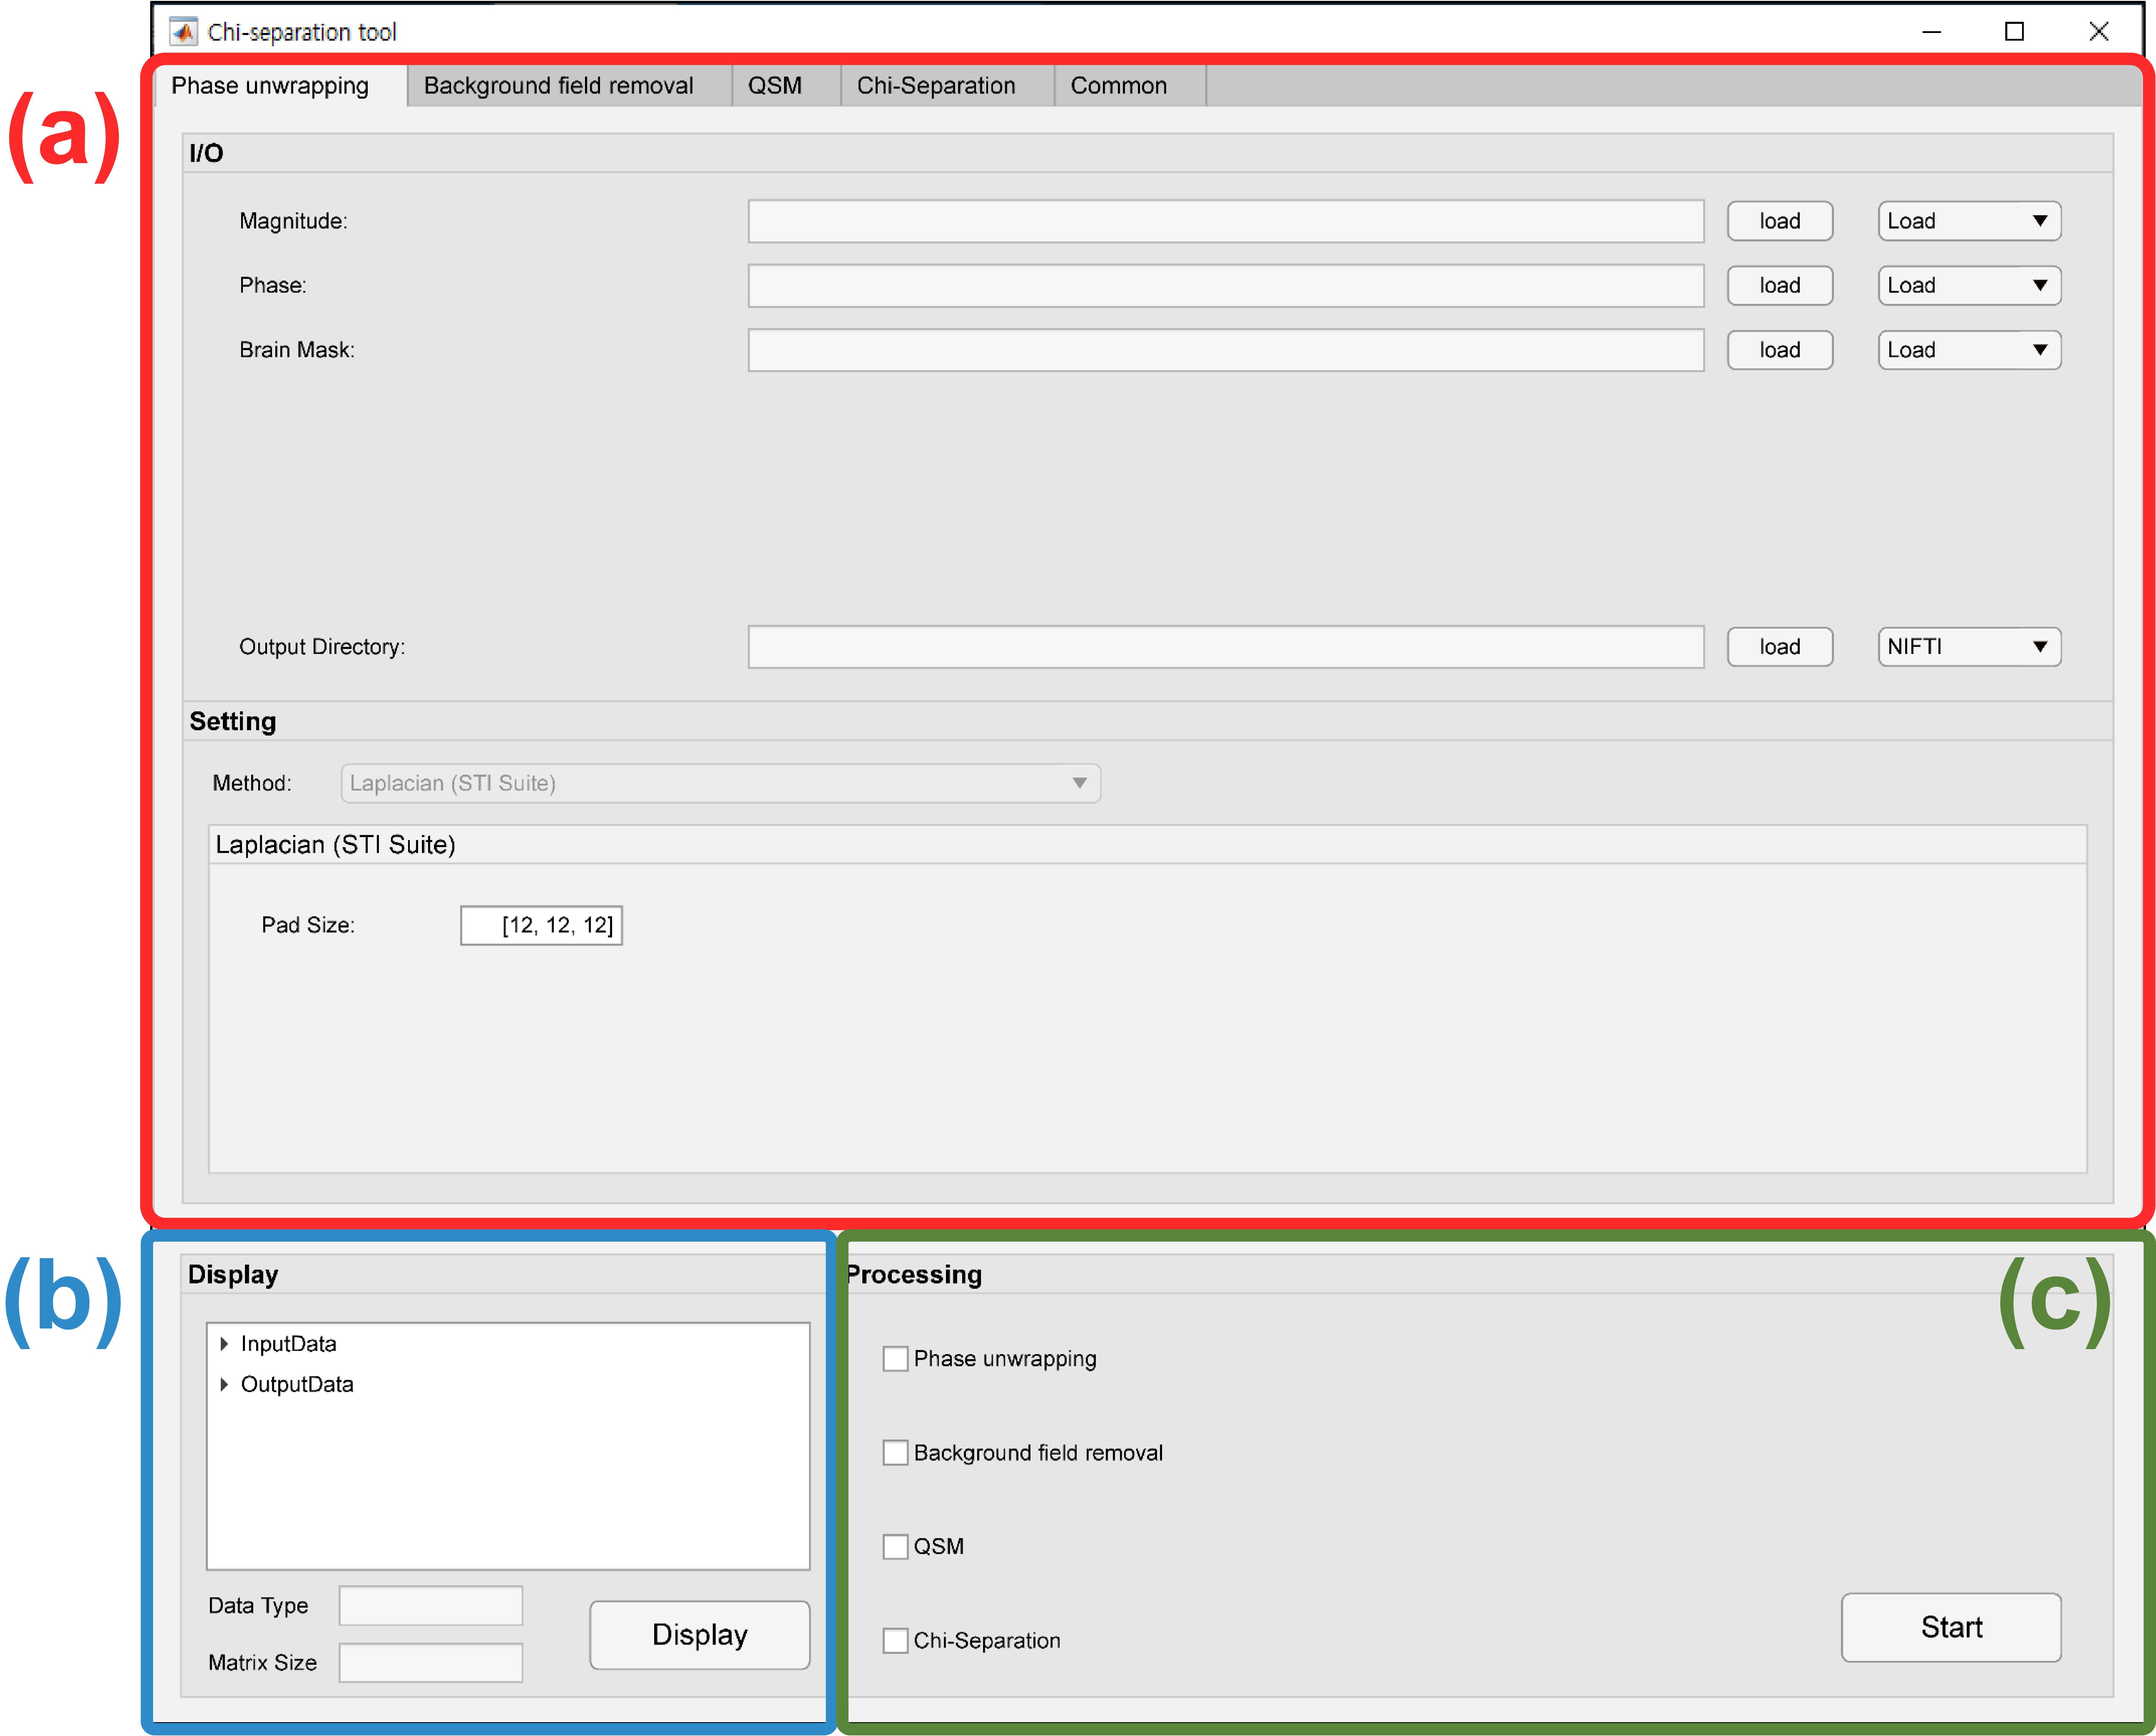
Figure 2 illustrates the main GUI window of the ‘$$$\chi$$$-separation toolbox’. It consists of setting, display, and start panels. The $$$\chi$$$-separation and QSM processing starts with the setting panel. In the setting panel one can load input data. For the input data, Dicom, Nifti and Mat file formats are available. Then, reconstruction parameters (e.g., B0 direction, echo-time, and resolution) and methods (e.g., an iterative sparse linear equation and least-squares (iLSQR)9 and QSMnet10,11 for QSM; L1-norm regularization (L1), streaking artifact suppression (SA), and $$$\chi$$$-sepnet12 for $$$\chi$$$-separation) need to be set up. In the start panel, users can select and start desired processes (e.g., phase unwrapping, background field removal, QSM, and $$$\chi$$$-separation). The processed results are saved in the output directory and seen in the display panel. The setting panel consists of 5 tabs as listed below. The users can control data input/output, method selection and parameters setting for corresponding processes in each tab.- Phase unwrapping: processing to calculate the total field map from the phase. This process uses the Laplacian-based method8,9.
- Background field removal: processing to calculate the tissue field from the total field map. This process uses the Variable-kernel SHARP (V-SHARP)9 to remove the background field.
- QSM: processing to calculate the susceptibility map from the tissue field. This process uses the iLSQR method9 or a deep learning-based method, called QSMnet10.
- $$$\chi$$$-separation: processing to separate positive and negative susceptibility sources. This process uses the $$$\chi$$$-separation7 or a deep learning-based method, called $$$\chi$$$-sepnet12.
- Common: Setting parameters and information common to all processes. It is available to put data parameters such as B0-direction, echo-time, and resolution, and to load STI Suite and MEDI toolbox directory.
$$$\chi$$$-separation formulate a new biophysical model to separate magnetic susceptibility sources as follows7:
$$argmin_{\chi_{pos},\chi_{neg}}\left\|W_{\mathbf{r}}\cdot \{R_2'-(\overline{D_{\mathbf{r},pos}}\cdot\left|\chi_{pos}\right|-\overline{D_{\mathbf{r},neg}}\cdot\left|\chi_{neg}\right|)\}+i2\pi\cdot W_{f}\cdot \{\Delta f-D_{f}\ast(\chi_{pos}+\chi_{neg})\}\right\|_{2}^{2}+reg(\chi_{pos},\chi_{neg}),$$
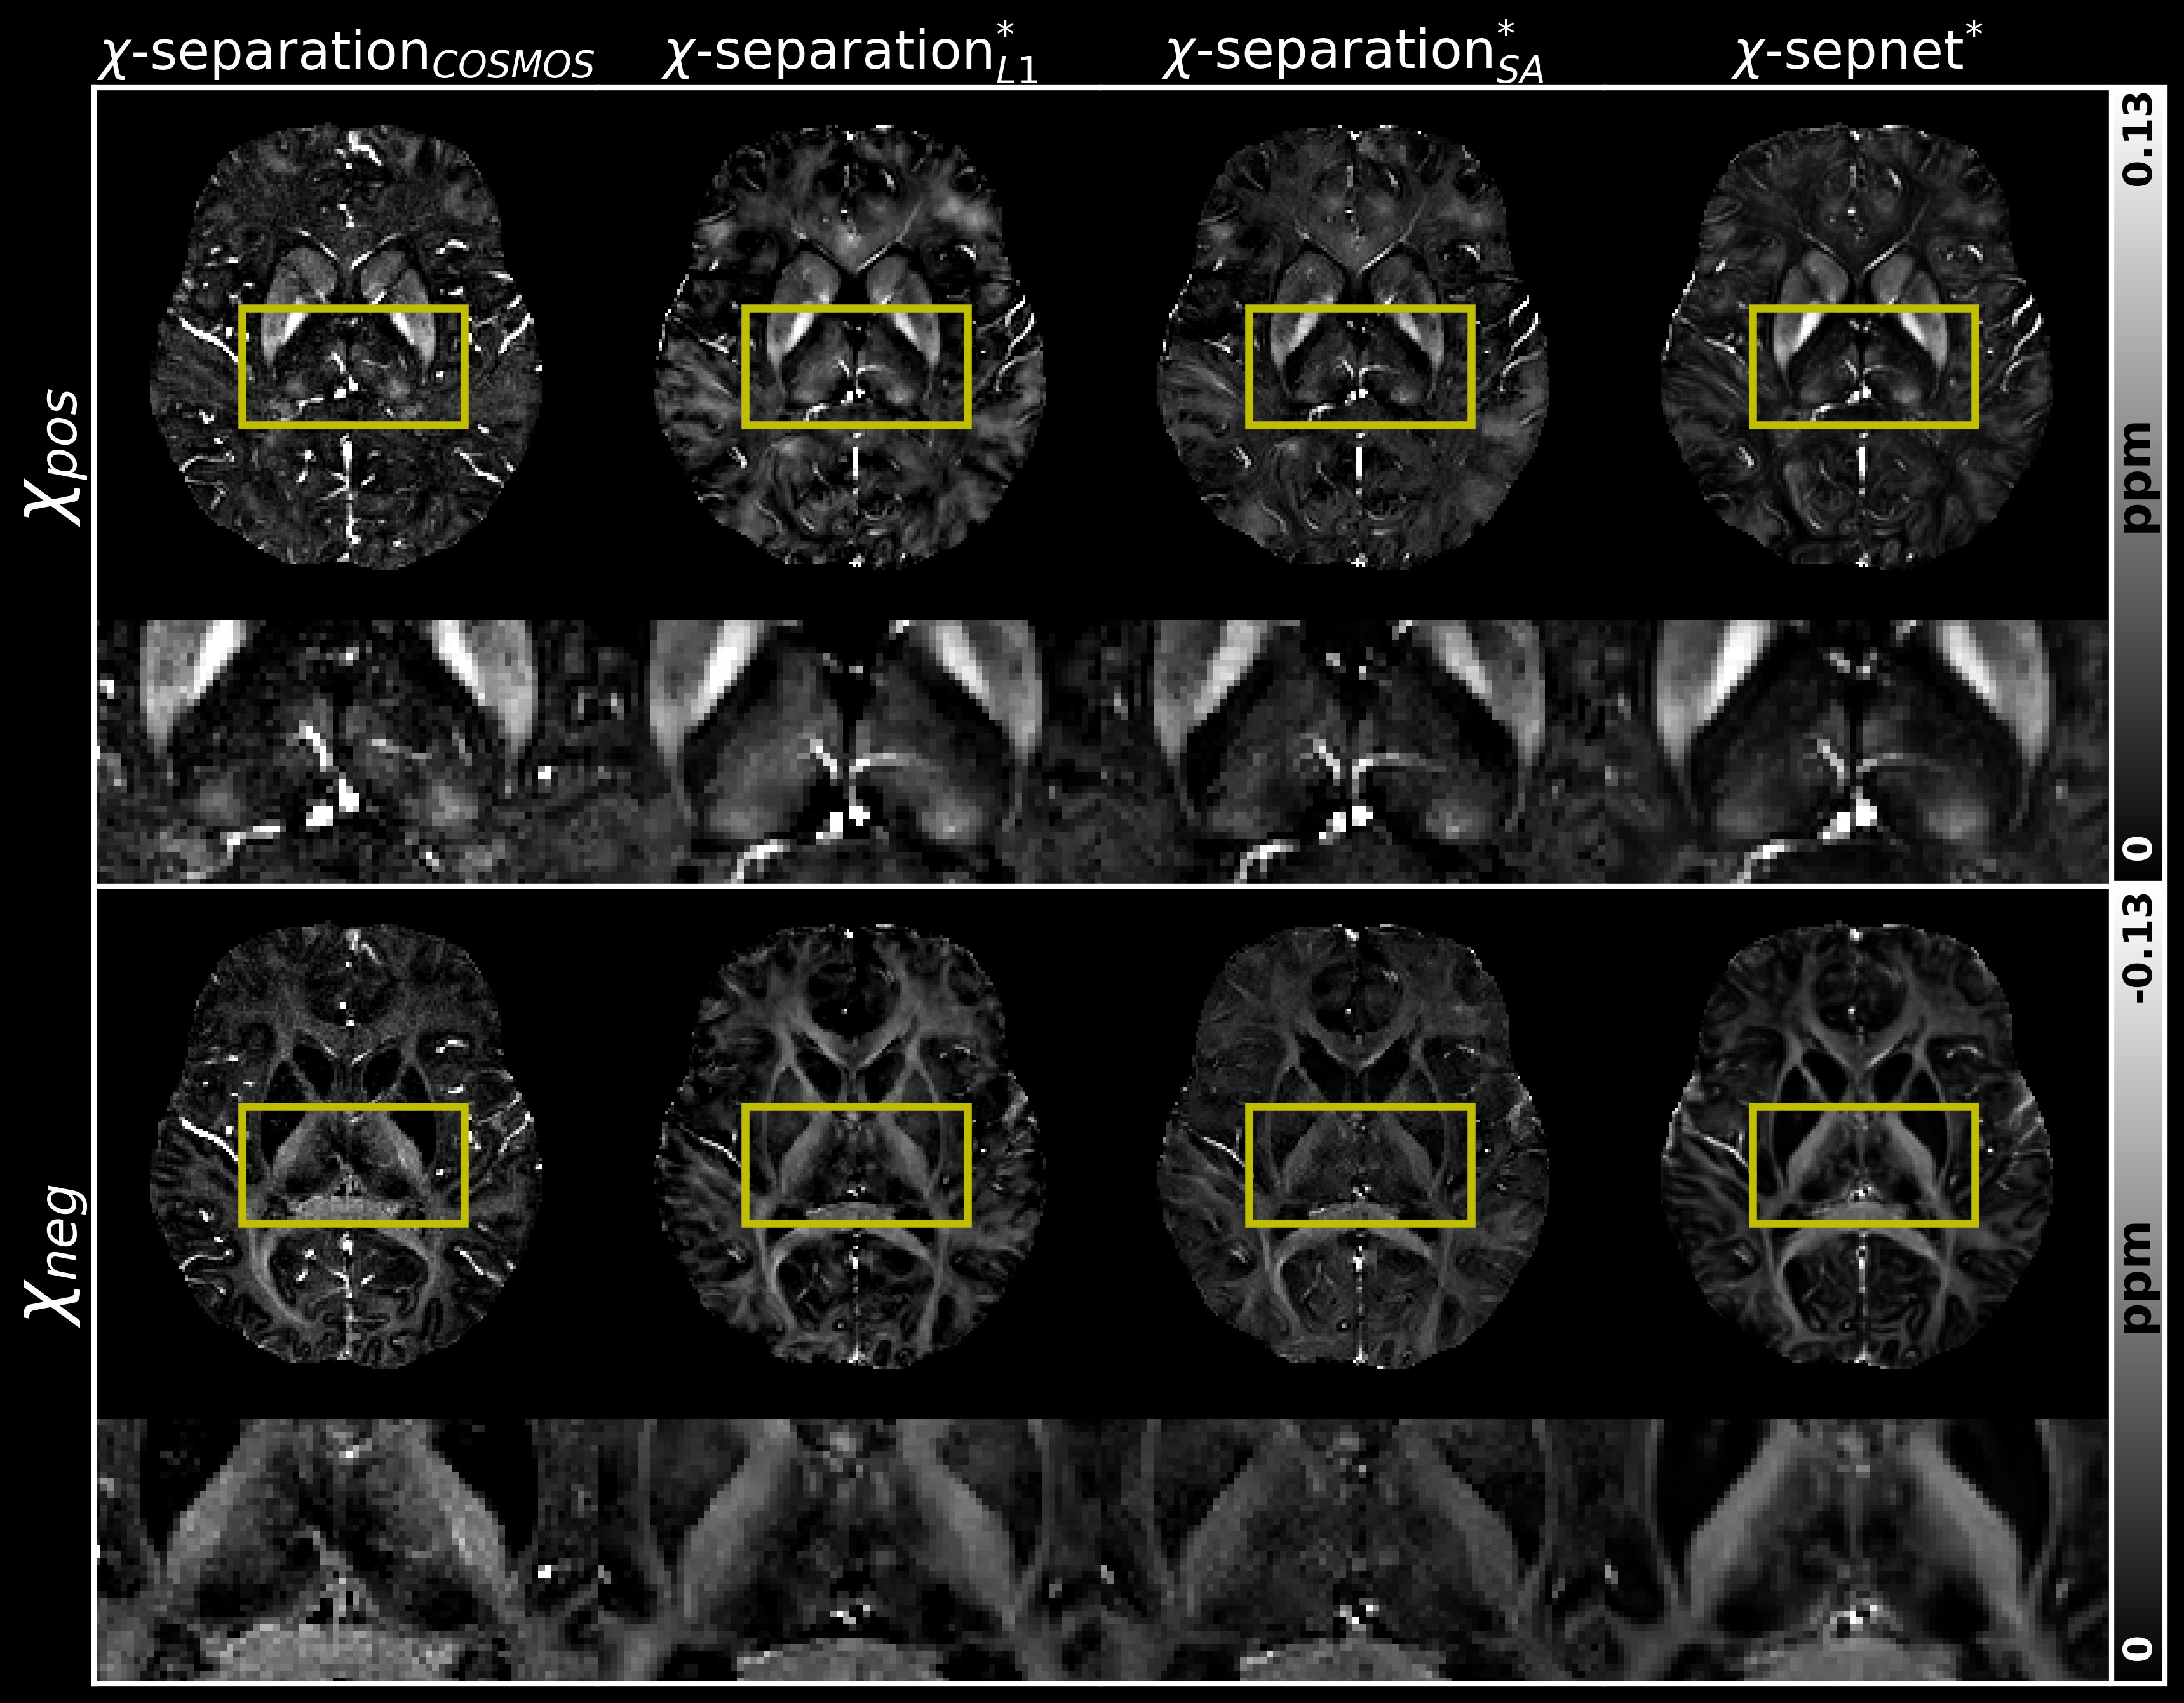
where $$$\mathbf{r}$$$ is the position vector of a voxel, $$$\Delta f$$$ is the frequency shift, $$$\chi_{pos}$$$ and $$$\chi_{neg}$$$ are the positive and negative susceptibility sources, respectively, $$$D_{f}$$$ is the field perturbation kernel, and $$$\overline{D_{\mathbf{r},pos}}$$$ and $$$\overline{D_{\mathbf{r},neg}}$$$ are nominal relaxometric constants for the positive and negative susceptibility sources, respectively. The optimal solution is found using a conjugate gradient descent algorithm. Depending on the regularization term of minimization, L1 or SA methods are available: $$$\chi$$$-separationL1 and $$$\chi$$$-separationSA. Since $$$\chi$$$-separation requires a R2' calculated by subtracting R2 from R2*, spin echo (SE) data in addition to gradient echo (GRE) data are needed. We allow it possible to perform $$$\chi$$$-separation with only GRE data by generating a pseudo R2' by subtracting a nominal masked pseudo R2 from the R2*: $$$\chi$$$-separationL1* and $$$\chi$$$-separationSA*. $$$\chi$$$-separation code is available at https://github.com/SNU-LIST.
Our toolbox includes two types of deep learning based $$$\chi$$$-separation method12: $$$\chi$$$-sepnet and $$$\chi$$$-sepnet*. Compared to $$$\chi$$$-sepnet, $$$\chi$$$-sepnet*, a variant of $$$\chi$$$-sepnet, doesn’t require a R2 as an input. In other words, $$$\chi$$$-sepnet* doesn't need additional SE scan for the R2. This feature makes $$$\chi$$$-sepnet* appealing clinical study.
Results
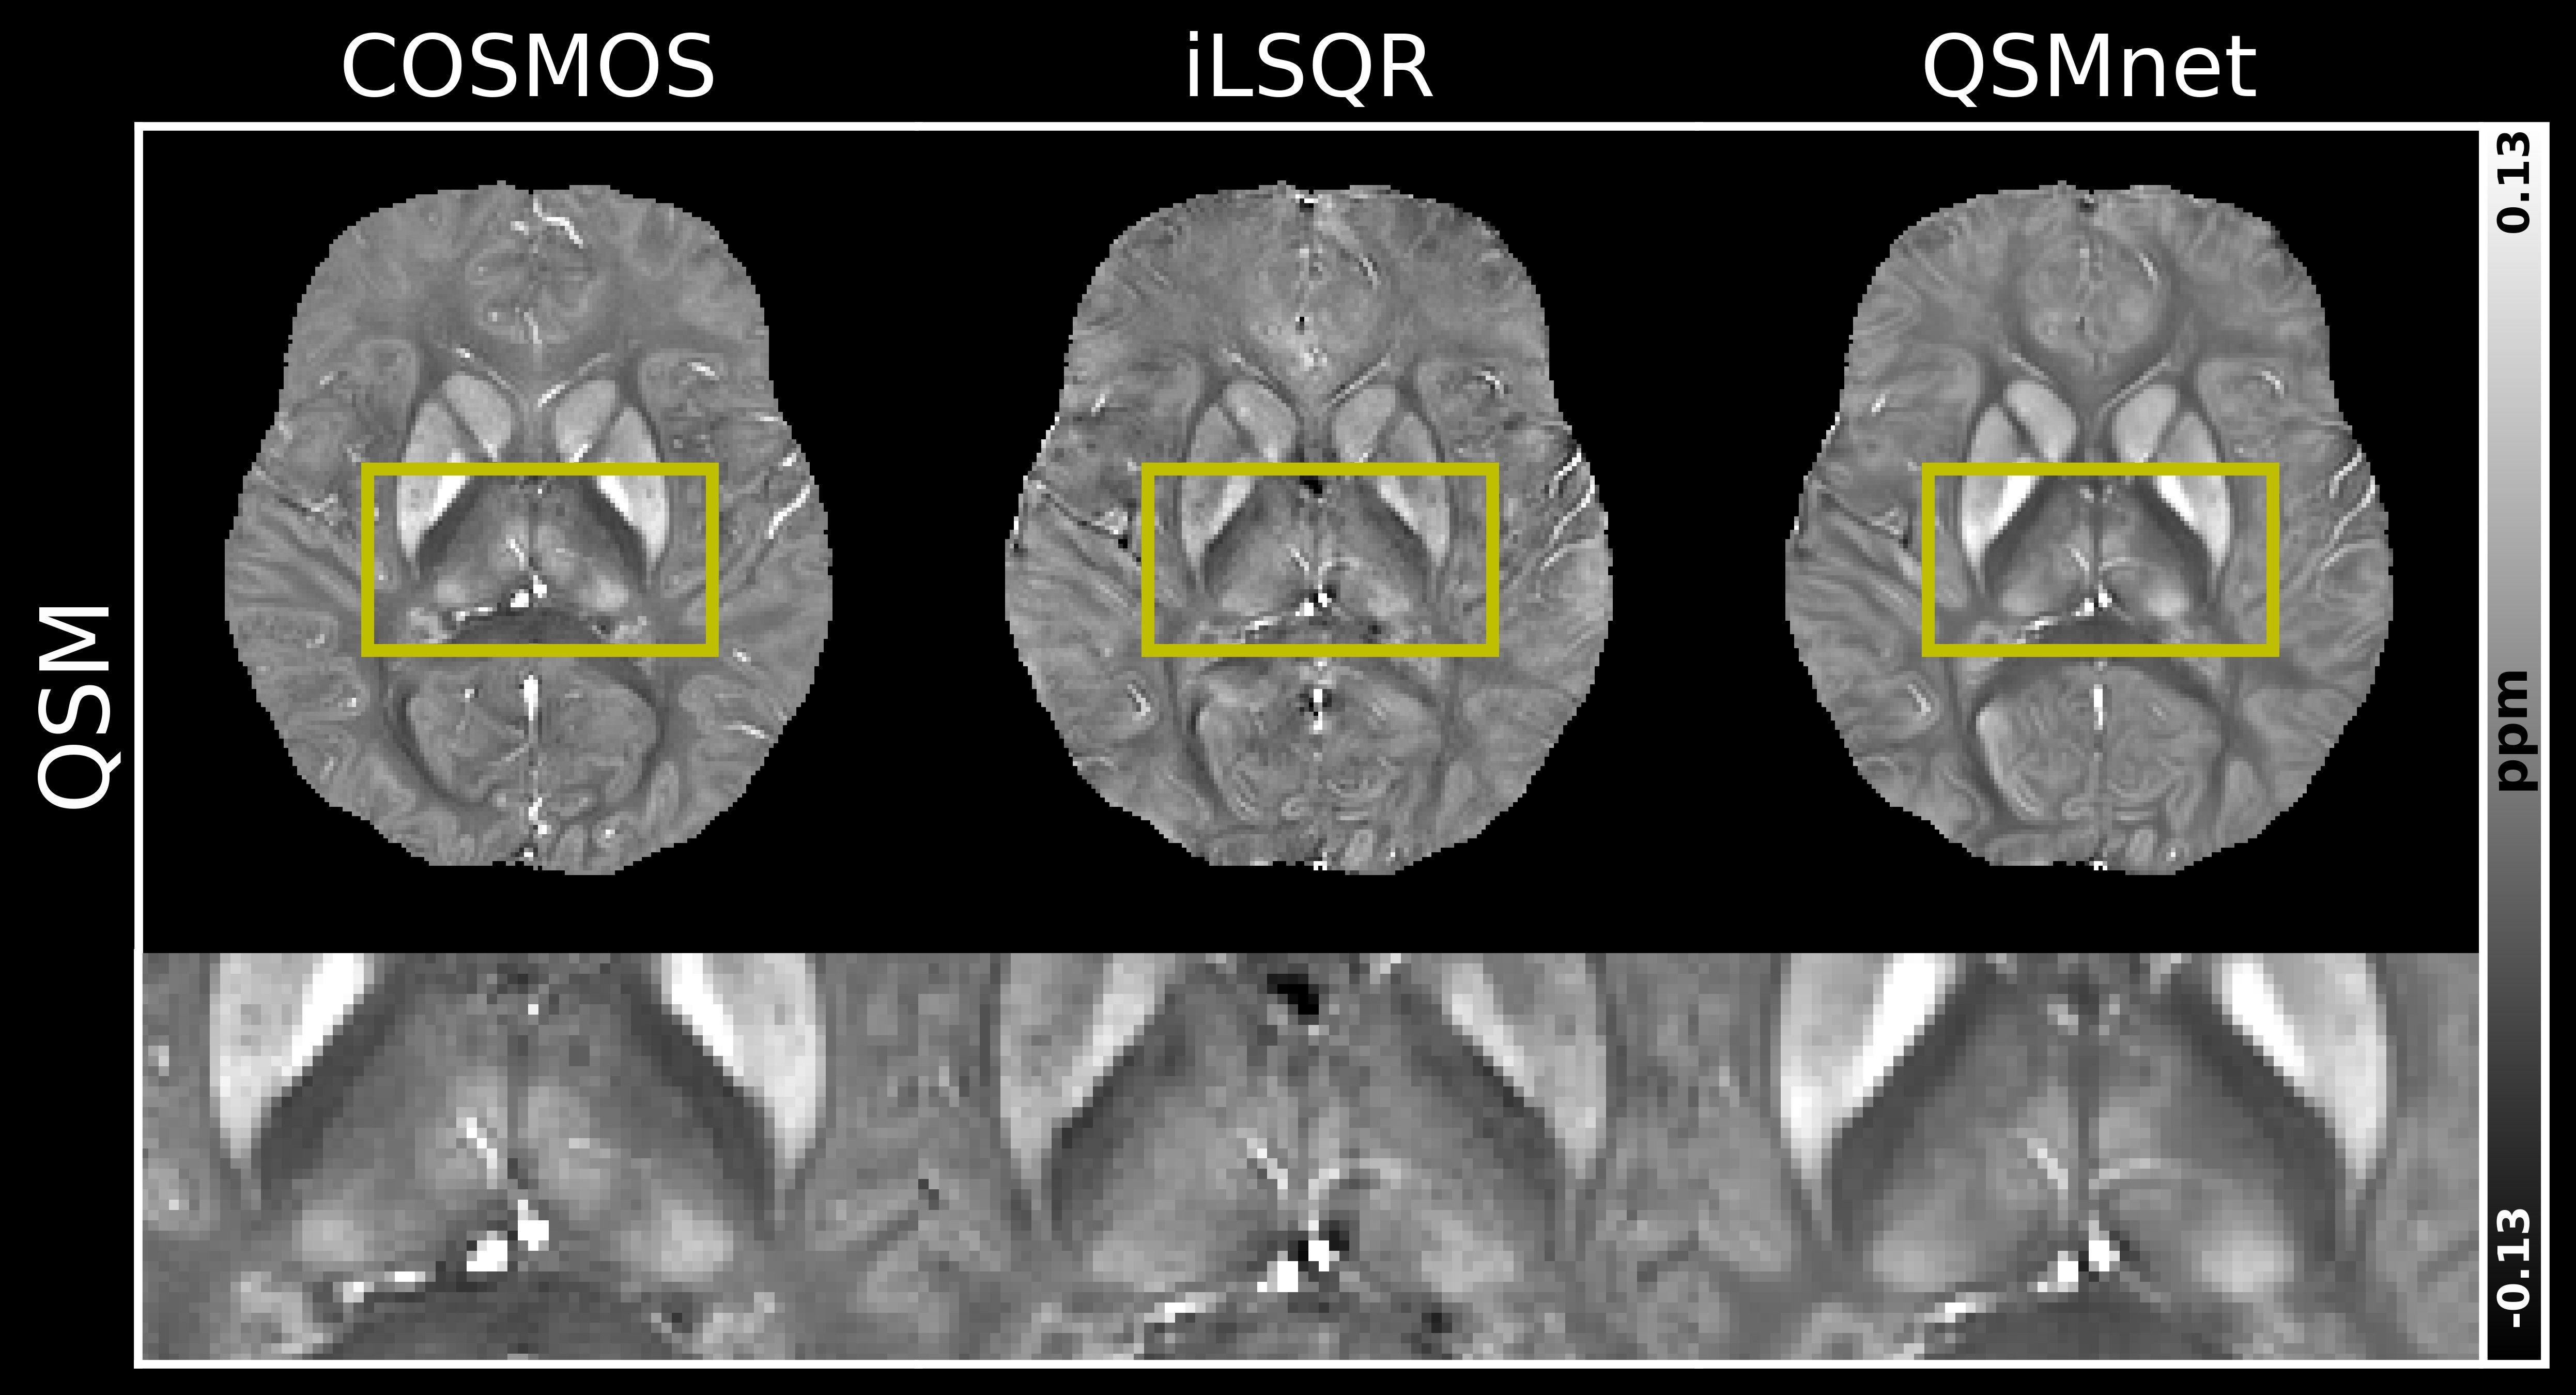
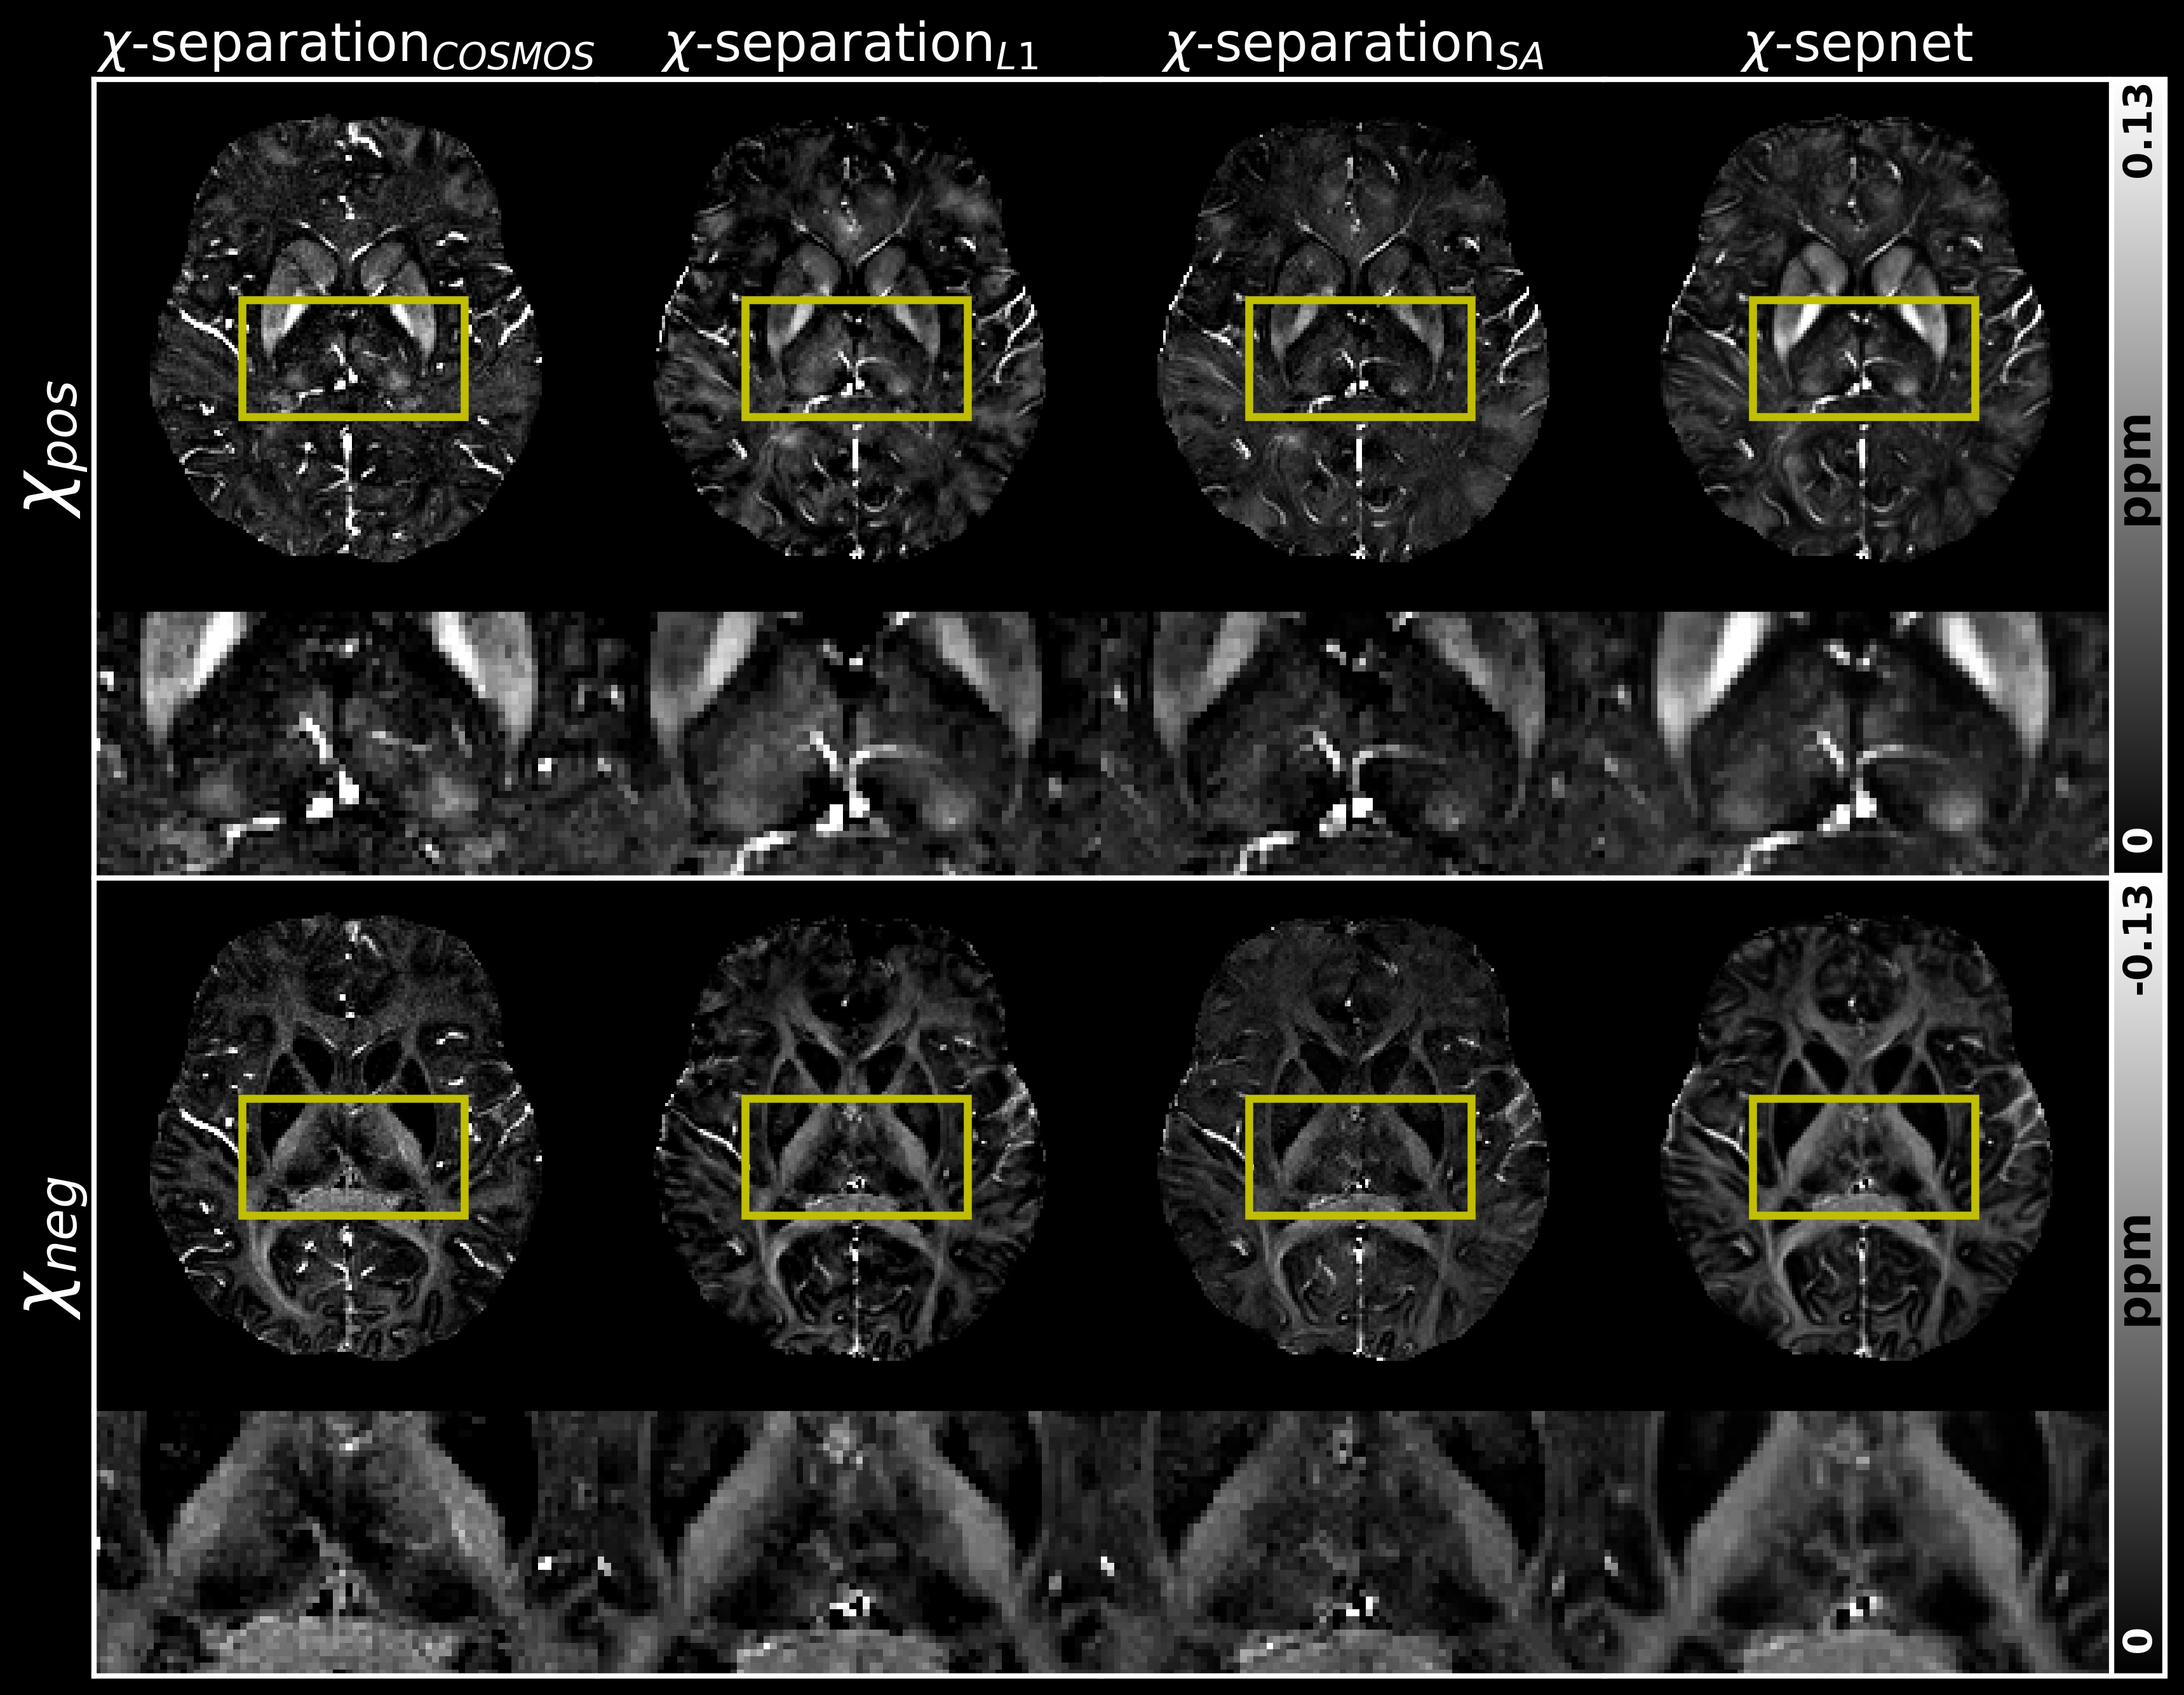
To validate the usability of the ‘$$$\chi$$$-separation toolbox’, Figs. 3 - 5 illustrate processed results obtained from the ‘$$$\chi$$$-separation toolbox’. The QSM maps calculated by COSMOS, iLSQR9, and QSMnet10 are shown in Fig. 3. The result of QSMnet shows a more similar susceptibility distribution to that of COSMOS. Figure 4 shows $$$\chi$$$-separation results calculated by COSMOS13, L1, SA, and $$$\chi$$$-sepnet12 with GRE data and SE data. Figure 5 shows $$$\chi$$$-separation results calculated without SE data. $$$\chi_{pos}$$$ and $$$\chi_{neg}$$$ show high concentration in deep gray and white matter, respectively.Discussion and Conclusion
In this study, we developed the MATLAB based GUI software, called the ‘$$$\chi$$$-separation toolbox’ that generates high-quality susceptibility maps in just a few clicks. Its GUI is intuitive and user-friendly that it helps researchers who are interested in magnetic susceptibility distribution to conduct QSM and $$$\chi$$$-separation processing without difficulty. Our toolbox provides various methods, including deep learning-based methods for susceptibility mapping pipeline. With the powerful reconstruction capability of deep learning, $$$\chi$$$-sepnet can overcome the quality degradation of $$$\chi$$$-separation resulted from situations without SE data. Future development is to incorporate new methods to obtain susceptibility maps by combining various processes.Acknowledgements
This work was supported by the MSIT (Ministry of Science, ICT), Korea, under the High-Potential Individuals Global Training Program (2021-0-01553), supervised by the IITP (Institute for Information & Communications Technology Planning & Evaluation), and the National Research Foundation of Korea (NRF) grant, funded by the Korean government (MSIT) (NRF-2020R1A2C4001623).References
1. Stephenson E, Nathoo N, Mahjoub Y, Dunn JF, Yong VW. Iron in multiple sclerosis: roles in neurodegeneration and repair. Nat Rev Neurol. 2014;10(8):459-468.
2. Zecca L, Youdim MBH, Riederer P, Connor JR, Crichton RR. Iron, brain ageing and neurodegenerative disorders. Nat Rev Neurosci. 2004;5(11):863-873.
3. Sowell ER, Peterson BS, Thompson PM, Welcome SE, Henkenius AL, Toga AW. Mapping cortical change across the human life span. Nat Neurosci. 2003;6(3):309-315.
4. McKenzie IA, Ohayon D, Li H, et al. Motor skill learning requires active central myelination. Science. 2014;346(6207):318-322.
5. Compston A, Coles A. Multiple sclerosis. Lancet. 2008;372(9648):1502-1517.
6. Nave KA. Myelination and support of axonal integrity by glia. Nature. 2010;468(7321):244-252.
7. Shin HG, Lee J, Yun YH, et al. χ-separation: Magnetic susceptibility source separation toward iron and myelin mapping in the brain. Neuroimage. 2021;240(118371):118371.
8. Schofield MA, Zhu Y. Fast phase unwrapping algorithm for interferometric applications. Opt Lett. 2003;28(14):1194-1196.
9. Li W, Wu B, Liu C. Quantitative susceptibility mapping of human brain reflects spatial variation in tissue composition. Neuroimage. 2011;55(4):1645-1656.
10. Yoon J, Gong E, Chatnuntawech I, et al. Quantitative susceptibility mapping using deep neural network: QSMnet. Neuroimage. 2018;179:199-206.
11. Jung W, Yoon J, Ji S, et al. Exploring linearity of deep neural network trained QSM: QSMnet+. Neuroimage. 2020;211(116619):116619.
12. Kim M, Shin H-G, Oh C, et al. Chi-sepnet: Susceptibility source separation using deep neural network. International Society for Magnetic Resonance in Medicine. 2022 May 7-12; London, England, UK: Abstract #2464.
13. Shin H-G, Seo J, Lee Y, et al. Chi-separation using multi-orientation data in invivo and exvivo brains: Visualization of histology up to the resolution of 350 μm. International Society for Magnetic Resonance in Medicine. 2022 May 7-12; London, England, UK: Abstract #8228.
Figures