2394
Open-source tools for multi-center multi-platform 0.55T relaxometry studies
Bilal Tasdelen1, Rajiv Ramasawmy2, Kathryn E Keenan3, Adrienne Campbell-Washburn2, and Krishna S Nayak1
1Ming Hsieh Department of Electrical and Computer Engineering, University of Southern California, Los Angeles, CA, United States, 2Cardiovascular Branch, Division of Intramural Research, National Heart, Lung, and Blood Institute, National Institutes of Health, Bethesda, MD, United States, 3NIST: National Institute of Standards and Technology, Boulder, CO, United States
1Ming Hsieh Department of Electrical and Computer Engineering, University of Southern California, Los Angeles, CA, United States, 2Cardiovascular Branch, Division of Intramural Research, National Heart, Lung, and Blood Institute, National Institutes of Health, Bethesda, MD, United States, 3NIST: National Institute of Standards and Technology, Boulder, CO, United States
Synopsis
Keywords: Software Tools, Software Tools, open-source
We demonstrate quantitative T1 and T2 mapping tools, built from open-source components Pulseq and qMRLab, suitable for multi-center multi-platform studies. The end-to-end solution includes acquisition, reconstruction, ROI analysis, and repeatability testing. The tools are demonstrated in the context of 0.55T relaxometry at two different sites and three scanners with two different hardware and software specifications. Relaxometry results are validated against results derived from vendor-provided sequences.Introduction
Multi-center studies rely on the ability to obtain comparable MRI results across sites, vendors, and software versions. Multi-site quantitative imaging is challenged by these differences, specifically between the scanner specifications, software, and sequence variants. This makes it hard to compare quantitative results across sites. Our goal is to solve these problems, in the context of MR relaxometry, using open-source tools.We demonstrate quantitative T1 and T2 mapping tools, built from open-source components Pulseq [1] and qMRLab, suitable for multi-center multi-platform studies. The end-to-end solution includes acquisition, reconstruction, ROI analysis, and repeatability testing. The tools are demonstrated in the context of 0.55T relaxometry using the ISMRM/NIST system phantom at two different sites and three scanners with two different hardware and software specifications. Relaxometry results are validated against results derived from vendor-provided sequences.
Methods
Experimental Methods:Experiments were performed using a two “ramped-down” 0.55T systems (prototype MAGNETOM Aera, Siemens Healthineers) with gradients supporting 45mT/m amplitude and 200T/m/s slew rate, and one commercial 0.55T (MAGNETOM Free.Max, Siemens Healthineers) with gradients 15mT/m amplitude and 40T/m/s slew rate. Measurements were acquired on different ISMRM/NIST system phantoms present at each site [2].
Pulse sequences were designed and implemented in PyPulseq [3], using a maximum gradient of 15mT/m and slew rate of 40mT/m/s, to use the exact same settings for both platforms. Sequences are designed to be flexible in terms of parameter and specifications to allow easy adaptation throughout different applications, field strengths and scanners. Protocols and parameters are supplied using JSON formatted configuration files. Pulse sequences and protocols are shared at: https://github.com/usc-mrel/PulseqT1T2Mapping.
Pulse Sequences:
T1 mapping utilizes a 3D Variable Flip-Angle Gradient Echo (VFA-GRE) sequence with seven logarithmically spaced flip-angle (FA) from 1° to 30°. Resolution is set to 2mm isotropic, with a FOV of 256x256x80mm3. Both MnCl2 and NiCl2 vials are acquired simultaneously. Imaging parameters: TE/TR = 6/12ms. 40% slice-oversampling, 100 dummy TRs per FA, total scan time 10:18.
Double-angle B1+ mapping was performed using the same VFA-GRE sequence with 30° and 60° FA. Imaging parameters: 8mm isotropic resolution, TE/TR = 6/5000ms, total scan time 1:14:40.
T2 mapping utilized a 2D Multi-Contrast Spin-Echo (MCSE) sequence. Two slices were acquired to cover both MnCl2 and NiCl2 vials. Imaging parameters: resolution 2mm in-plane, 6mm slice thickness, FOV 256x256mm2, TR 5000ms, echo train length (ETL) 32, 15ms inter-echo spacing, scan time 10:43 per slice.
T1 mapping was validated using the vendor-provided inversion-recovery spin-echo (IRSE, Siemens Healthineers). Seven inversion recovery delays from 50 to 4500ms are acquired. Resolution and FOV are matched with 2D MCSE. TE/TR is set to 12/5000ms. Scan time is 1hour 26minutes.
T2 mapping was validated using the vendor-provided single-echo spin-echo (SESE, Siemens Healthineers). 32 linearly spaced echoes from 15ms to 480ms are acquired. The remaining parameters are matched with the Pulseq MCSE sequence. Scan time is 5hours 44minutes.
Table1 contains detailed parameters for all sequences.
Image reconstruction and analysis:
Raw data from the scanner was exported to ISMRMRD format [4]. After a simple FFT reconstruction, vials were automatically detected, and vial-masks were created by [5]. Masked images are converted to maps using open-source qMRLab [6] for all the mapping except MCSE T2-mapping. MCSE T2-maps are estimated using StimFit [7] package to account for stimulated echoes. VFA T1-maps are corrected using estimated B1 maps. Schematic depicting the software architecture is shown in Figure1. Reconstruction code is shared at: https://github.com/usc-mrel/PulseqT1T2mappingRecon
Mean T1 and T2 estimates for each vial were compared. Agreement was assessed by plotting the mean and standard deviations, along with the equality line.
Results
Figure2 compares T1 and T2 values per vial for product and open-source sequences, on the same site/scanner.Figure3 compares T1 and T2 estimates across different sites (USC and NIH) with the same hardware and software.
Figure4 compares T1 and T2 estimates between Free.Max and Aera at the same site (NIH).
Discussion
In most cases, the open-source sequences and vendor-provided sequences were in good agreement. Discrepancies in T1 may be explained by product sequences being based on IR-SE and Pulseq sequences being based on VFA, which have different sensitivities to imperfections. The scanners in this study did not have a broad set of flexible product sequences. Furthermore, there was no control for the product sequences over the actual gradient waveforms being played. The proposed framework avoids this issue by distributing the pulse sequences in vendor and software agnostic Pulseq format. Note that, the phantoms themselves are different, although they were derived from the same batch of solutions at NIST, possibly contributing to the deviations.All reconstruction was performed offline. The framework was built to work with ISMRMRD format and can be easily integrated into the Siemens FIRE or Gadgetron [8] pipeline to build a fully automated protocol.
B1+ mapping is done with 3D DAM, which is extremely slow and has coarse spatial resolution. As it is imperative to have good B1+ maps for VFA T1 mapping, acquiring higher resolution maps with high precision in a shorter time is desired. This may be achieved by switching to actual flip-angle [9] or Bloch-Siegert shift [10] approaches.
Conclusions
We have demonstrated open-source tools for quantitative relaxometry that can be utilized to test consistency of measurements across sites and scanners.Acknowledgements
The USC authors acknowledge grant support from the National Science Foundation (#1828736) and research support from Siemens Healthineers. First author thanks Nam G. Lee for the help and discussion on pulse sequence design. The NHLBI authors acknowledge funding from NHLBI DIR (Z01-HL006257), and the assistance of Siemens Healthcare in the modification of the prototype MAGNETOM Aera MRI system for operation at 0.55T under an existing cooperative research agreement (CRADA)References
- Layton KJ, Kroboth S, Jia F, et al. Pulseq: A rapid and hardware-independent pulse sequence prototyping framework. Magn Reson Med. 2017;77(4):1544-1552. doi:10.1002/mrm.26235
- Stupic KF, Ainslie M, Boss MA, et al. A standard system phantom for magnetic resonance imaging. Magnetic Resonance in Medicine. 2021;86(3):1194-1211. doi:10.1002/mrm.28779
- Ravi, Keerthi, Sairam Geethanath, and John Vaughan. "PyPulseq: A Python Package for MRI Pulse Sequence Design." Journal of Open Source Software 4.42 (2019): 1725.
- Inati SJ, Naegele JD, Zwart NR, et al. ISMRM Raw data format: A proposed standard for MRI raw datasets. Magnetic Resonance in Medicine. 2017;77(1):411-421. doi:10.1002/mrm.26089
- Keenan KE, Gimbutas Z, Dienstfrey A, Stupic KF. Assessing effects of scanner upgrades for clinical studies. Journal of Magnetic Resonance Imaging. 2019;50(6):1948-1954. doi:10.1002/jmri.26785
- Karakuzu A, Boudreau M, Duval T, et al. qMRLab: Quantitative MRI analysis, under one umbrella. Journal of Open Source Software. 2020;5(53):2343. doi:10.21105/joss.02343
- Lebel RM. StimFit: A toolbox for robust T2 mapping with stimulated echo compensation. Proc Intl Soc Mag Reson Med. 2012;20:2588.
- Hansen MS, Sørensen TS. Gadgetron: An open source framework for medical image reconstruction. Magnetic Resonance in Medicine. 2013;69(6):1768-1776. doi:10.1002/mrm.24389
- Yarnykh VL. Actual flip-angle imaging in the pulsed steady state: a method for rapid three-dimensional mapping of the transmitted radiofrequency field. Magn Reson Med. 2007;57(1):192-200. doi:10.1002/mrm.21120
- Sacolick LI, Wiesinger F, Hancu I, Vogel MW. B1 mapping by Bloch-Siegert shift. Magnetic Resonance in Medicine. 2010;63(5):1315-1322. doi:10.1002/mrm.22357
Figures
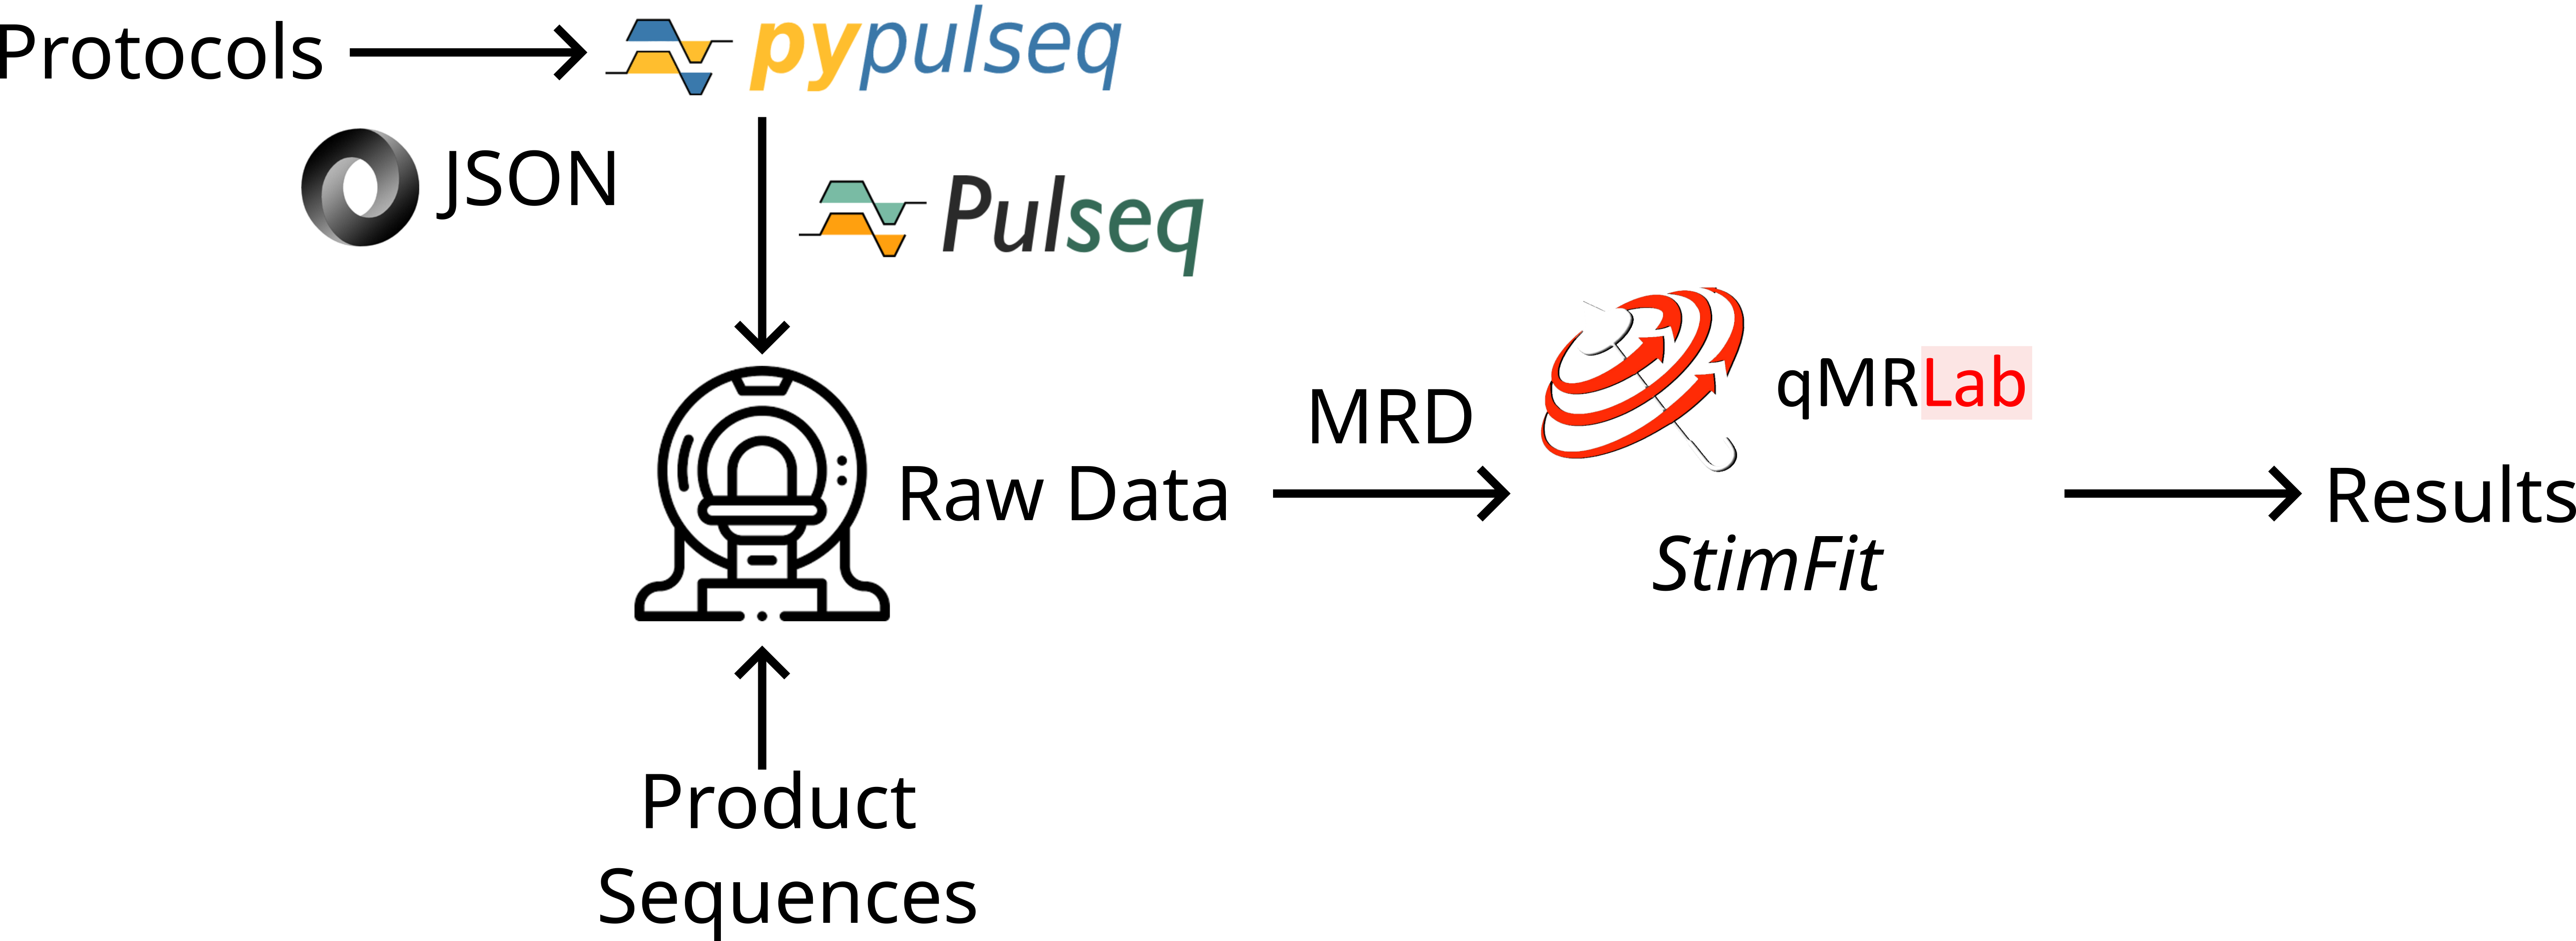
Figure 1: Diagram depicting software architecture and workflow. T1 and B1 mapping sequences were generated from VFA-GRE, and T2 mapping sequences were generated from MCSE, using associated JSON protocols.
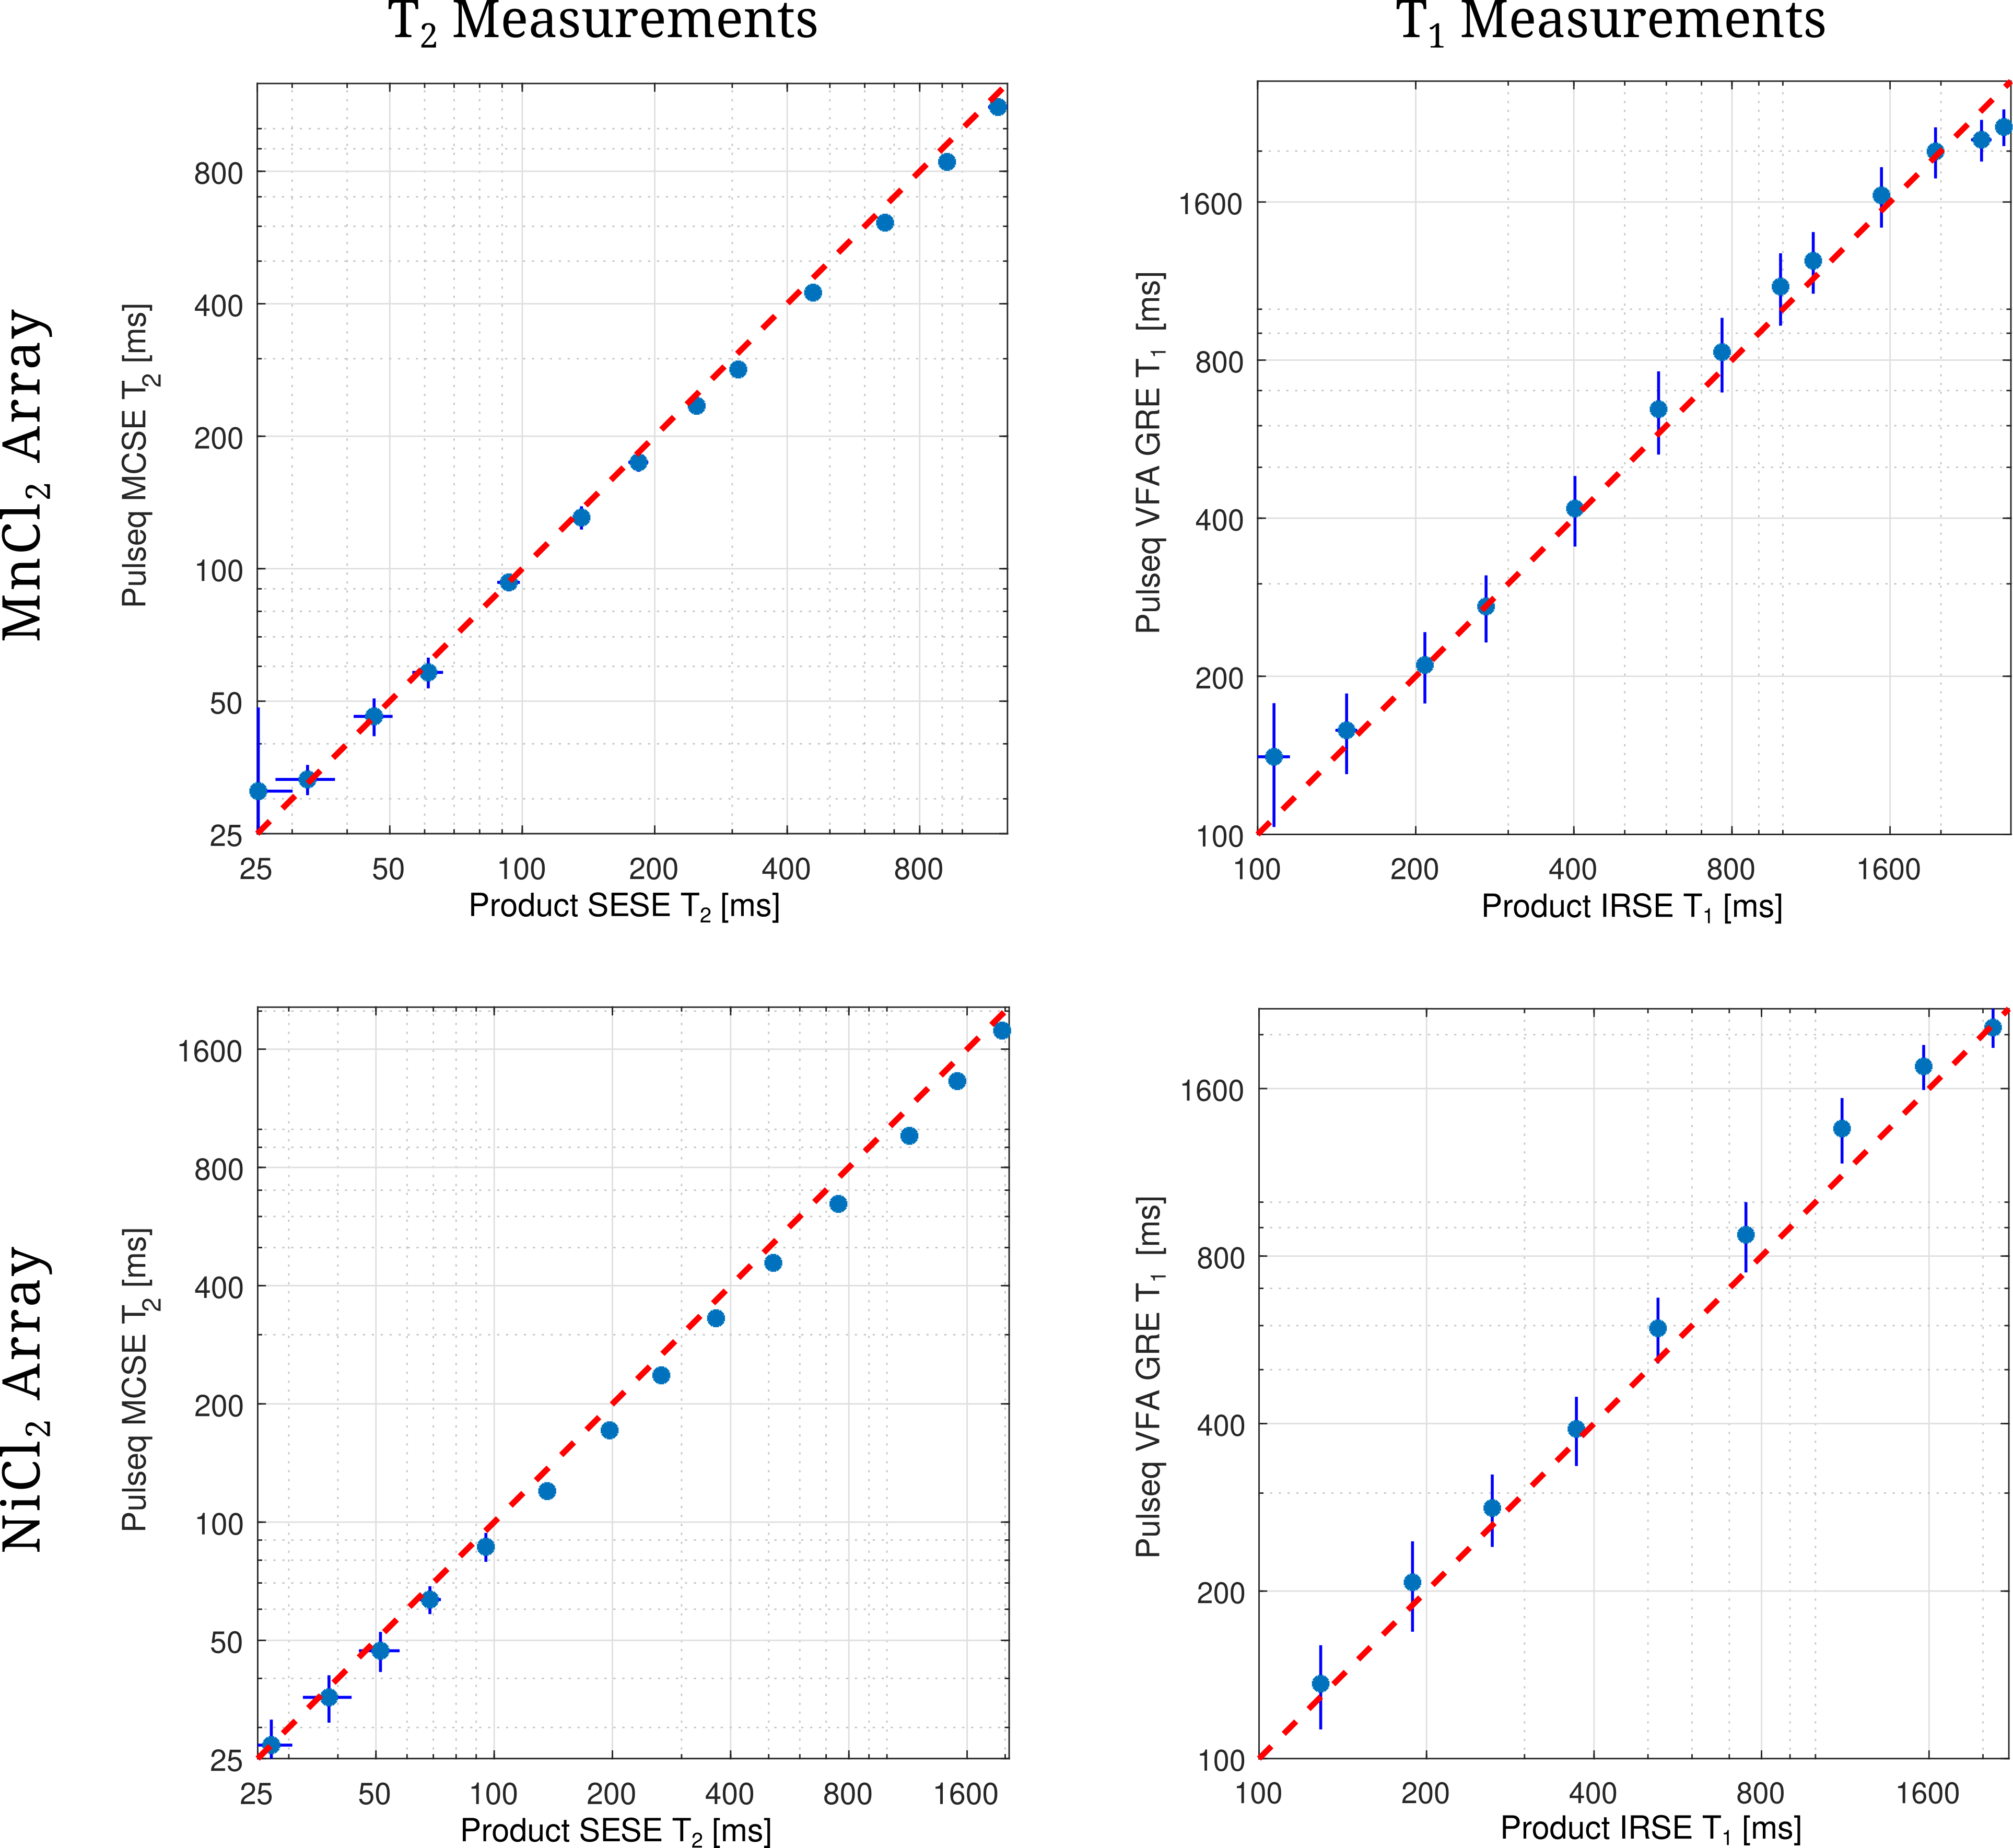
Figure 2: Comparison of the T2 and T1 measurements between Pulseq sequences and product sequences for the same scanner. Note that, plots are in logarithmic scale in both axes. There is an increased bias between product and Pulseq for larger T1 and T2 values. However, lower values are in better agreement. The same observations hold true for both MnCl2 and NiCl2 arrays.
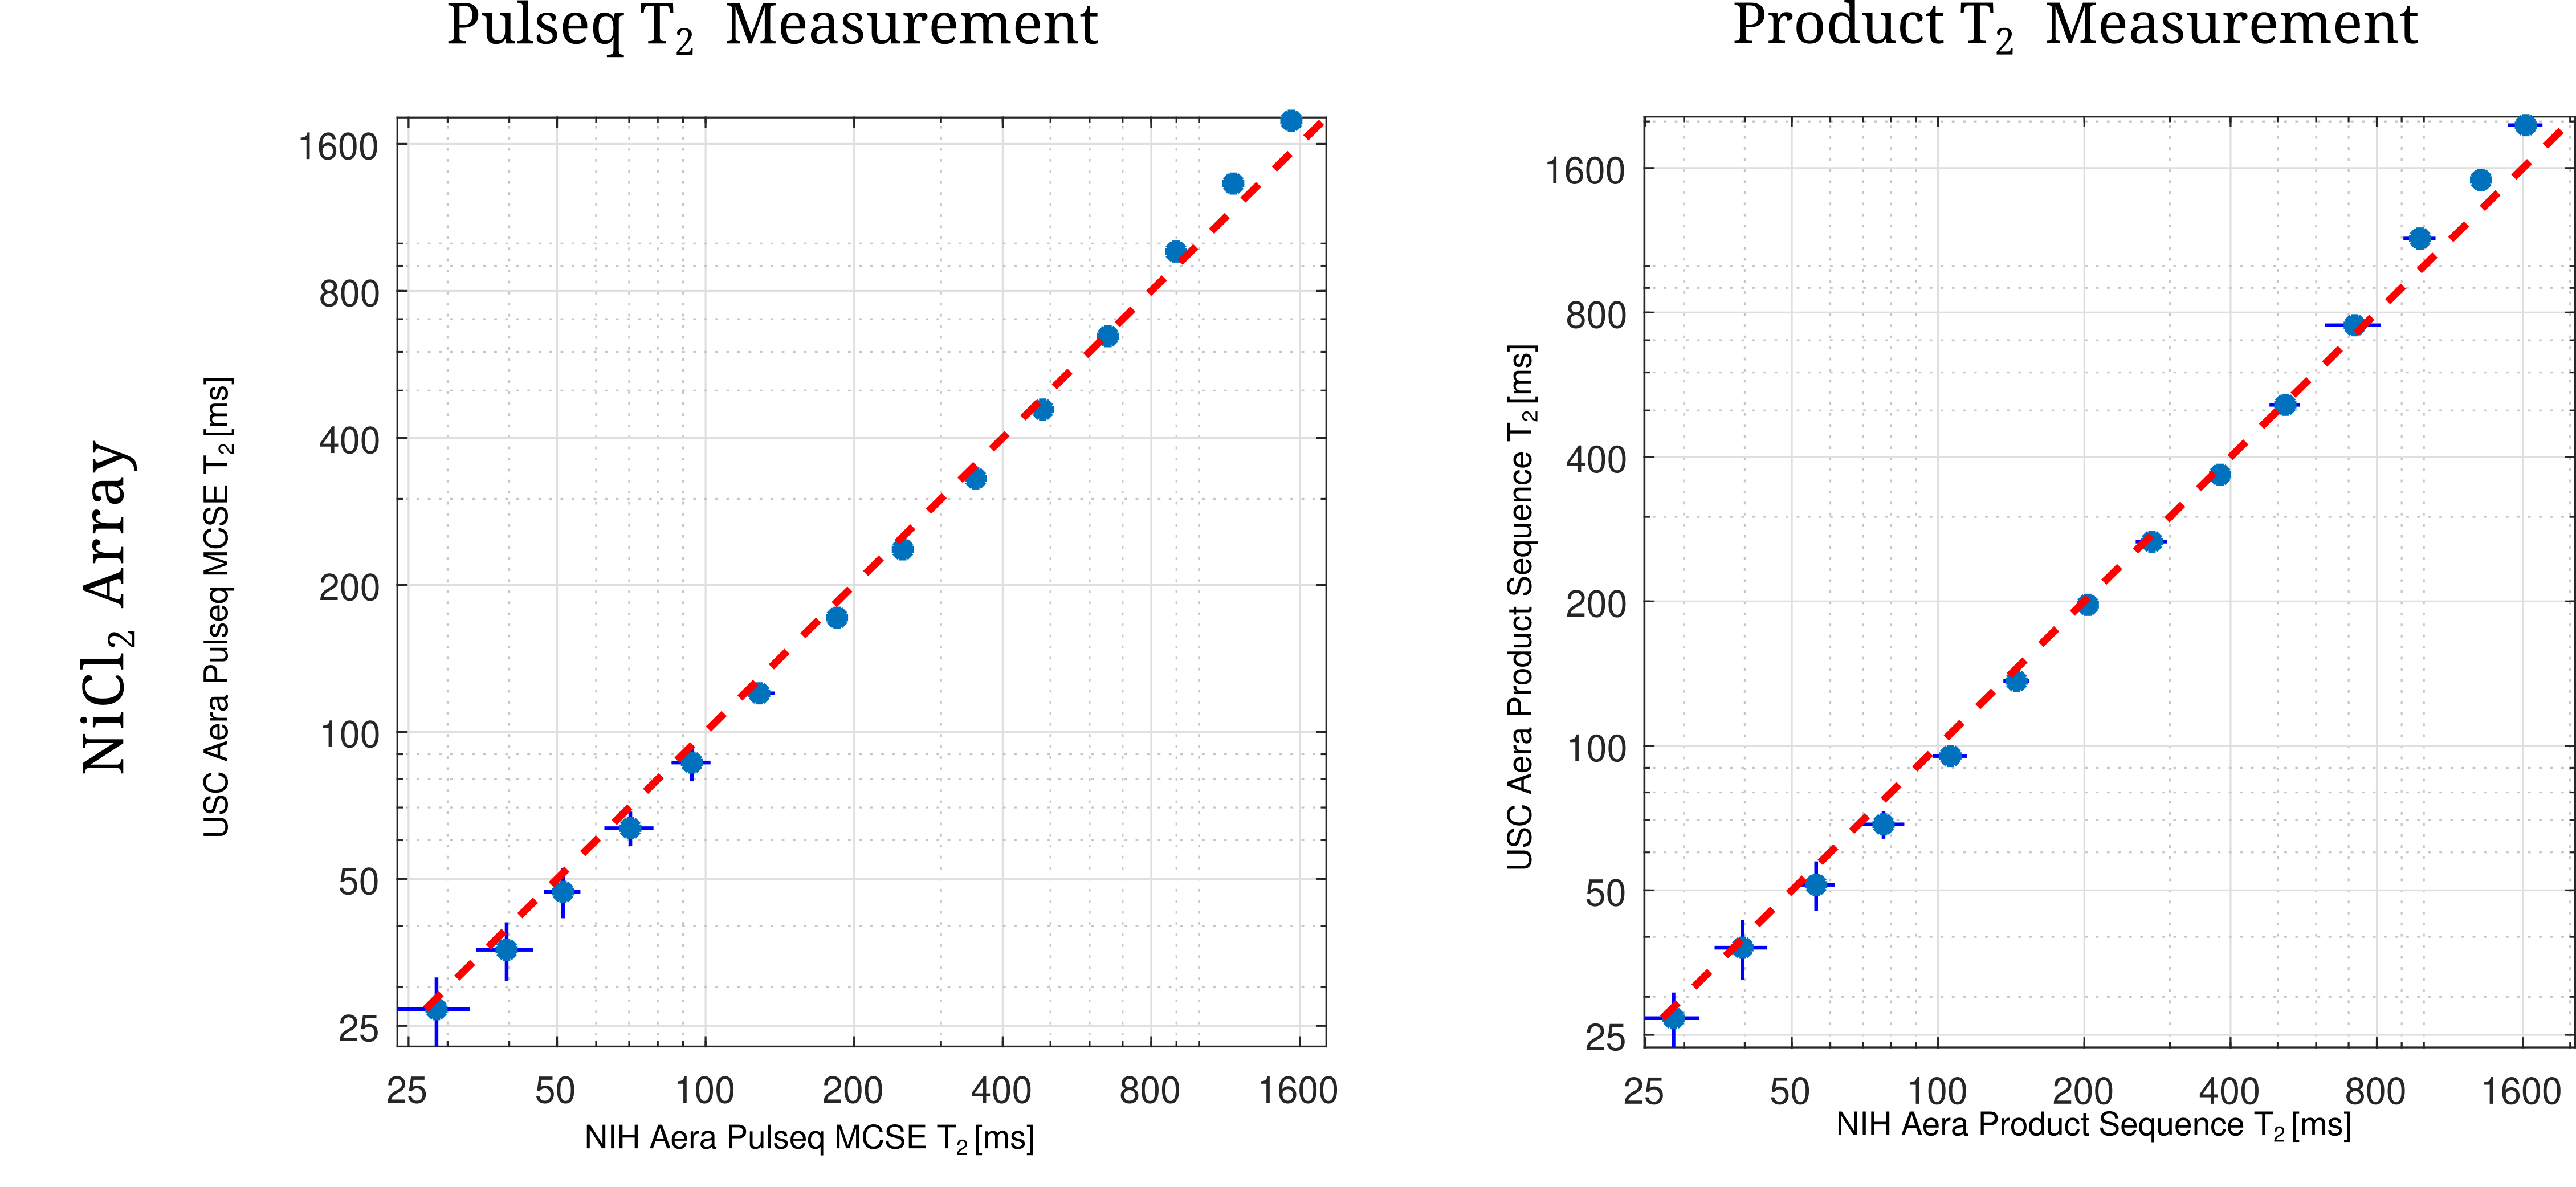
Figure 3: Comparison of the T2 measurements between two sites using both ramped-down Aera scanners and the same sequence. Note that, plots are in logarithmic scale in both axes. It has been observed that, there is a deviation across sites. However, this deviation is consistent for both product and Pulseq measurements. Note that, the measured phantoms are not the same, which can contribute to the bias.
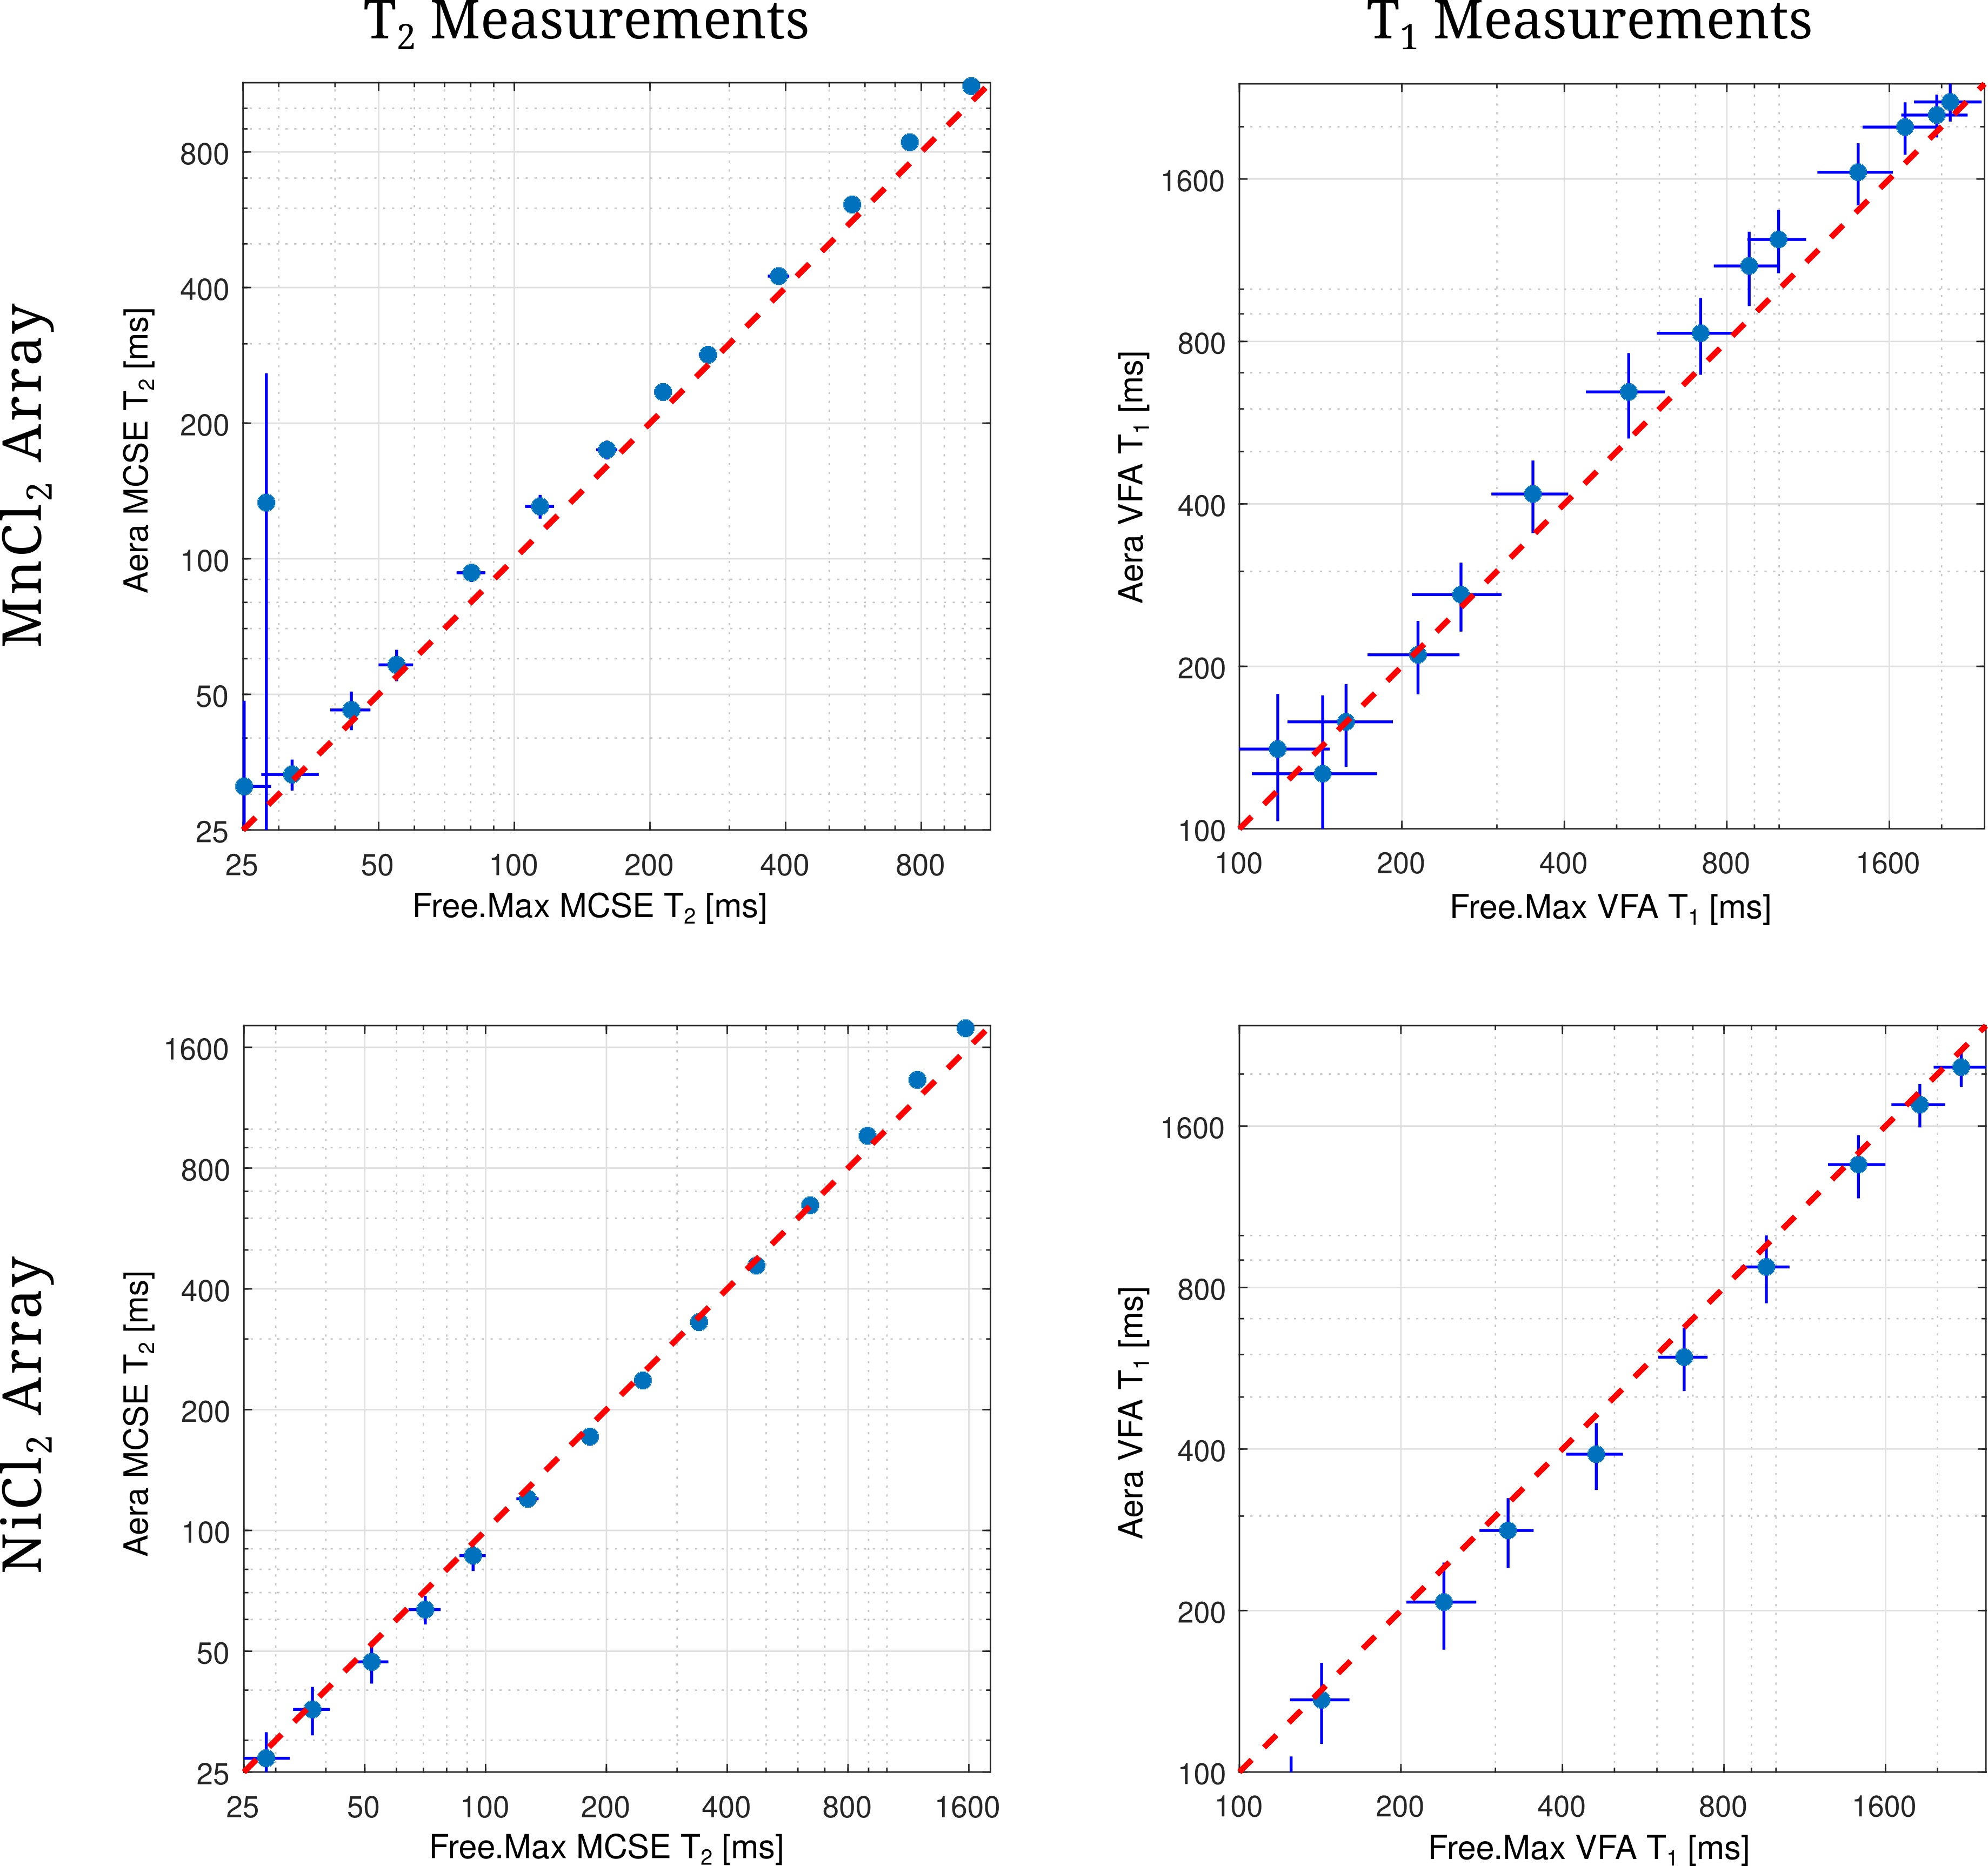
Figure 4: Comparison of the T2 and T1 measurements between Free.Max and ramped-down Aera scanner using Pulseq sequences. Note that, plots are in logarithmic scale in both axes. T1 and T2 measurements of the first two MnCl2 vials are observed to deviate significantly, possibly due to insufficient SNR. Both measurements of NiCl2 array is observed to be in good agreement.
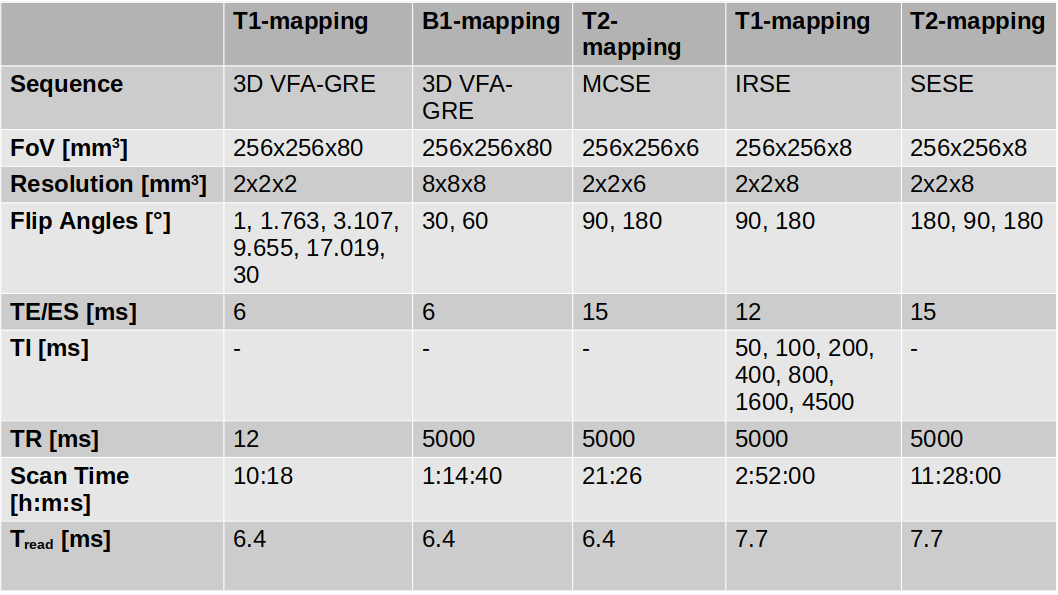
Table 1: Detailed protocol for Pulseq and product validation sequences. Ramped-dpwn Aera and Free.Max protocols are matched. Note that, there are slight differences between Pulseq and product protocols in terms of slice thickness and readout time.
DOI: https://doi.org/10.58530/2023/2394