2374
Asymmetric echo variable flip angle RARE for n-echo Dixon based PDFF @ 9.4T
Wan-Ting Zhao1, Karl-Heinz Herrmann1, Renat Sibgatulin1, Janine Arlt2, Weiwei Wei2, Uta Dahmen2, and Jürgen R. Reichenbach1
1Medical Physics Group, Institute of Diagnostic Radiology, University hospital Jena, Jena, Germany, 2Experimental Transplantation Surgery, Department of General, Visceral and Vascular Surgery, University hospital Jena, Jena, Germany
1Medical Physics Group, Institute of Diagnostic Radiology, University hospital Jena, Jena, Germany, 2Experimental Transplantation Surgery, Department of General, Visceral and Vascular Surgery, University hospital Jena, Jena, Germany
Synopsis
Keywords: Pulse Sequence Design, Preclinical
This work demonstrates the use of echo-shifting in combination with an efficient variable flip angle 3D RARE to reconstruct fat fraction distribution in a liver sample, resolving the fine structure of the fat deposits in the tissue with a Dixon based analysis at 9.4T.Introduction
Conventional fat fraction quantification relies on gradient echo based sequences1-4, which has the advantage of fast acquisition, while being vulnerable to motion and susceptibility artifacts. At 9.4T not only the susceptibility artifacts are much stronger, but also the echo time of a FLASH sequence can’t resolve the in-phase to opposed-phase progression which corresponds to an echo time difference of 0.357 ms. Additionally, at such high field, a spin-echo based sequence has the benefit to suppress R2* effects while echo shifting can be used to sample the spin echo asymmetrically at arbitrarily small echo differences to induce well defined phase shifts between fat and water signal components. To reduce the required scan time, the echo shifting was implemented into a 3D variable flip angle RARE sequence (Rapid Acquisition with Refocused Echoes, ES-VFA-RARE) which allows high RARE factors with excellent image quality5. Using this sequence, the abstract attempts to bridge the typical MRI mm scale to the histological microscale by recovering super high resolution fat signal fraction maps in ex vivo liver tissue at 100µm.Materials and methods
MRI data were acquired on a Bruker BioSpec 94/20USR AVIII scanner using a 72mm (phantom) or 60mm (ex vivo sample) quadrature transceiver coil. To assess the phase shift created by progressively changing the echo shift value, ES-VFA-RARE images were acquired on a kerosene gel (a.k.a. paraffin or lamp oil) - water phantom with the 41 echo times = [-0.72:0.036:0.72] ms, fig. 1). The scan parameters of ES-VFA-RARE for phantom study were TA=6.5min for each echo shift, TR=1500ms, TE=63ms, BW=200kHz, resolution 0.44 x 0.44 x 0.55 mm3.Ex vivo acquisition was performed on a liver sample, harvested from a rat which received high fat diet for 12 weeks. The scan parameters were TA=4h 10min per echo shift, TR=1000ms, echo shifts=[-0.367,-0.357,-0.129,-0.059,0,0.059,0.178,0.367,0.397,0.416] ms, echo spacing 3.6ms, TE=18ms, RARE factor=60, 10 averages, BW=400kHz, isotropic resolution of (0.1mm)3. Fat-water separation was performed by fitting the following signal model:$$S(T_E)=S_0 \cdot \left(1+f \exp(i \cdot \omega_{\Delta fw} \cdot T_E)\right)\cdot\exp(i\cdot (\omega_{\Delta B_0}\cdot T_E+\phi_0))$$
where $\omega_{\Delta fw} = \gamma Β_0 \sigma = 8.8\times 10^3$ rad / s, assumed to be the fat-water frequency shift; Optimisation was performed with respect to $S_0$, signal fat fraction f, off-resonance frequency ω_{ΔB0}, and phase after the RF pulse $\phi_0$. It was implemented in JAX6 to leverage automatic differentiation and is performed using a variable projection method, VARPRO7,8, with nonlinear parameters ω_{ΔB0} and φ0 optimised using AdaBelief optimiser9,10.
Results
Fig. 1 displays a clear boundary between kerosene and water. The phase difference across the boundary changes linearly with the applied echo shift. Fig. 2 shows the original MRI images and the results of the fat-water signal fraction separation. The calculated fat signal fraction ranges to approx. 22% in the areas with highest fat concentration. The B0 map shows primarily the residual linear gradient along the readout direction, together with a characteristic dipole field from, most likely an air bubble. The φ0 map shows the effects of the initial RF pulse for different tissue properties (e.g. electric conductivity). In Fig. 3 two large landmarks could be matched, in a first step, between MR images and low magnification histology. Following deeper inspection a small area of an MRI-derived fat distribution could be matched to a small area in the histology slide at higher magnification.Discussion
Pieces of an entire rat liver were scanned with a very high isotropic resolution of 100mm3 using a large 60mm volume coil. To achieve sufficient SNR for voxelwise fat separation, rather long scan times were necessary, which would have been prohibitively long without the high RARE factors possible with the ES-VFA-RARE sequence. Complex non-linear optimisation is facilitated by the VARPRO algorithm, leveraging the separable nature of the problem, as well as by a total of 10 different echo shifts, providing high SNR for the fat-water separation. The very high resolution of the MR acquisitions allows to bridge the gap between the reconstructed fat fraction maps and µm histological images, showing qualitative agreement between the spatial distributions. Quantification of the fat proton density fraction, however, requires further calibrations to remove different signal weighting of fat and water due to their different T1 and T2 times.Conclusion
Echo shifting was successfully incorporated into a scan-time efficient ES-VFA-RARE sequence, allowing high resolution acquisition of liver samples and subsequent Dixon based fat signal separation. The MRI images at 100µm resolution started to resolve the enhanced periportal fat depositions and fine structures in the local liver lobe as well as the larger scale differences within the liver lobe or between different liver parts.Synopsis
This work demonstrates the use of echo-shifting in combination with an efficient variable flip angle 3D RARE to estimate the proton density fat fraction of a liver sample, resolving the fine structure of the fat deposits in the tissue with a Dixon based analysis at 9.4T.Acknowledgements
This work was supported by the German Research Foundation (DFG) within the Research Unit Programme FOR5151 "QuaLiPerF (Quantifying Liver Perfusion–Function Relationship in Complex Resection - A Systems Medicine Approach)" grant number 436883643.References
Reeder SB, et al. (2005) “Homodyne reconstruction and IDEAL water-fat decomposition”. Magn Reson Med 54. https://doi.org/10.1002/mrm.20586 Zhang X, et al. (2004) “Measurement of fat/water ratios in rat liver using 3D three-point dixon MRI”. Magn Reson Med 51. https://doi.org/10.1002/mrm.20005 Bydder M, et al. (2018) “Sources of systematic error in proton density fat fraction (PDFF) quantification in the liver evaluated from magnitude images with different numbers of echoes”. NMR in Biomed. 31. https://doi.org/10.1002/nbm.3843 Hui SCN, et al. (2018) “Validation of water-fat MRI and proton MRS in assessment of hepatic fat and the heterogeneous distribution of hepatic fat and iron in subjects with non-alcoholic fatty liver disease”. Eur. J. Radiol. 107. https://doi.org/10.1016/j.ejrad.2018.08.008 Herrmann KH, Hung LY, Reichenbach JR (2022) “Fast 3D Isotropic High-Resolution MRI of Mouse Brain Using a Variable Flip Angle RARE Sequence With T2 Compensation @9.4T”, #1713 ISMRM proceeding Bradbury J, et al (2018) “JAX: composable transformations of Python+NumPy programs”, http://github.com/google/jax Gene Golub G and Pereyra V(2003) “Separable Nonlinear Least Squares: The Variable Projection Method and Its Applications”, Inverse Probl, 19, https://doi.org/10.1088/0266-5611/19/2/201 Hernando D, et al. (2008) "Joint estimation of water/fat images and field inhomogeneity map." Magn Reson Med, 59, 3 https://doi.org/10.1002/mrm.21522 Zhuang J, et al. (2020) “AdaBelief Optimizer: Adapting Stepsizes by the Belief in Observed Gradients”, CoRR, https://arxiv.org/abs/2010.0746810. Babuschkin I, et al (2020) “The DeepMind JAX Ecosystem”, http://github.com/deepmindFigures
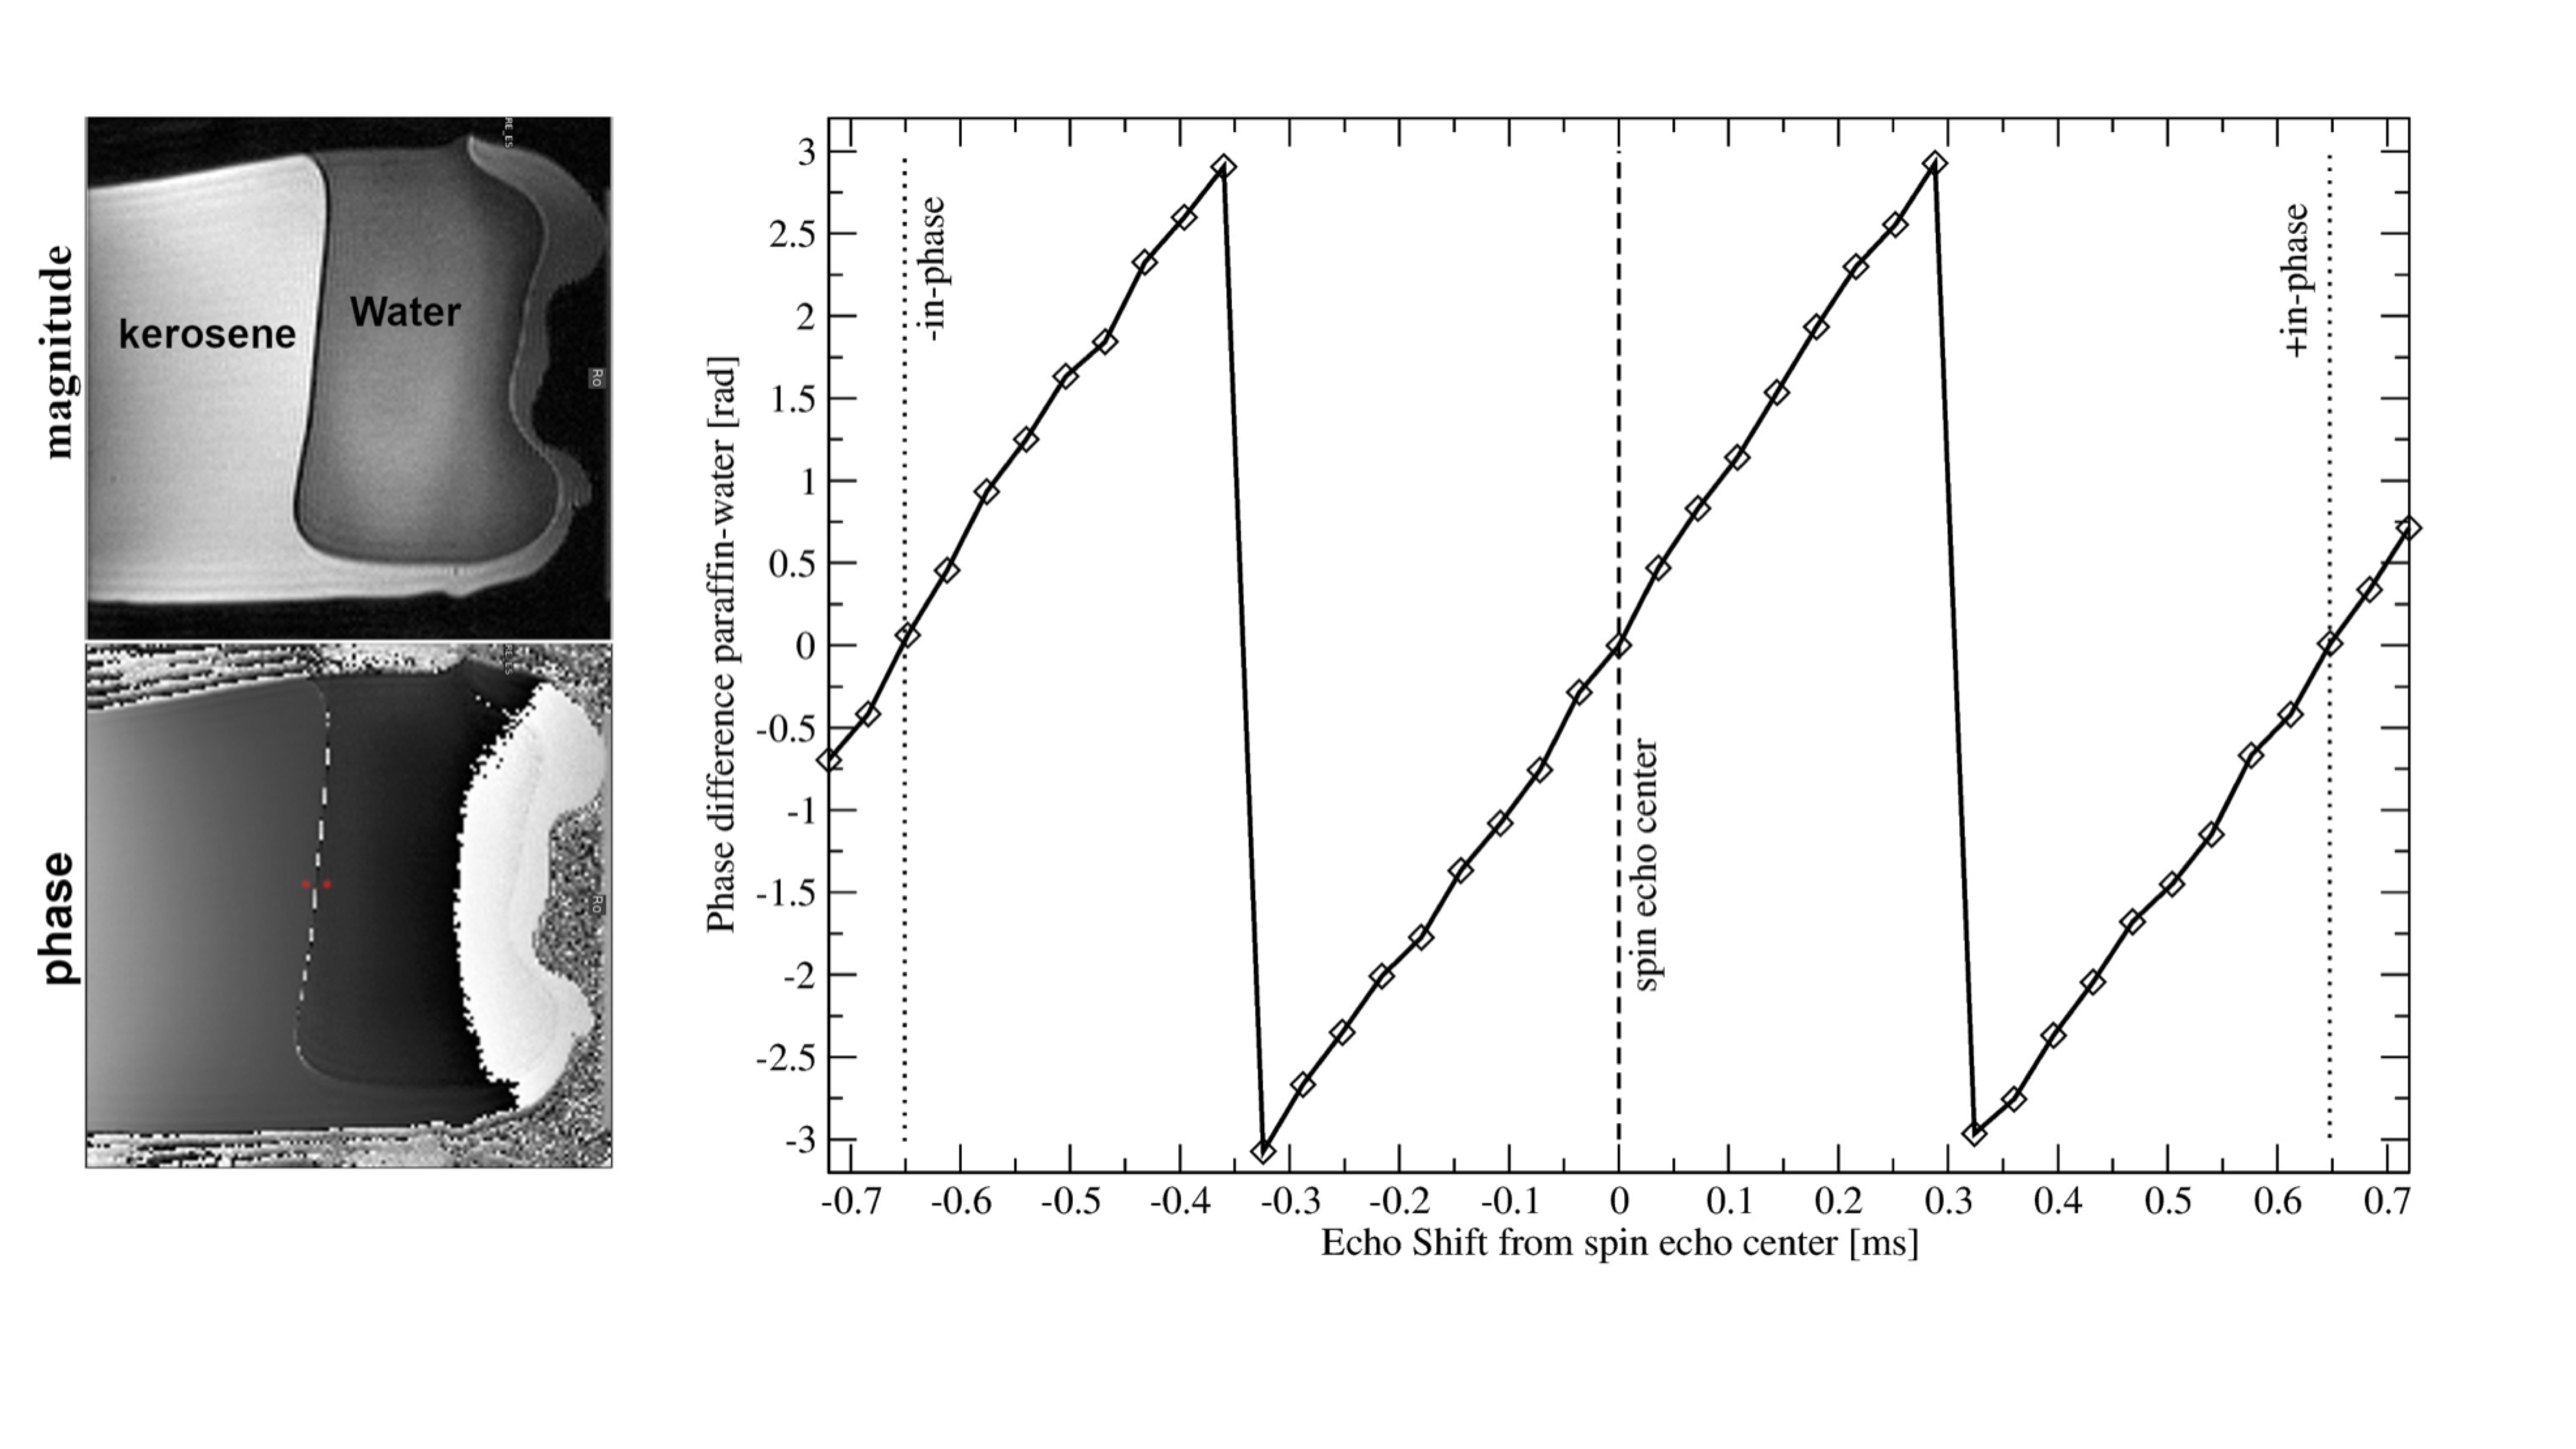
Figure 1. ES-VFA-RARE images of a paraffin gel-water phantom. Left: the original images at in-phase condition (magnitude and phase). A narrow signal void due to the fat shift at the boundary between the fat and the water is minimised by the high bandwidth. The phase difference between kerosene and water at the two red dots in the phase image is plotted on the right for increasing echo shift between -0.72 and 0.72 ms (for kerosene -ip ≈ -0.65ms, +ip ≈ 0.65ms as indicated).
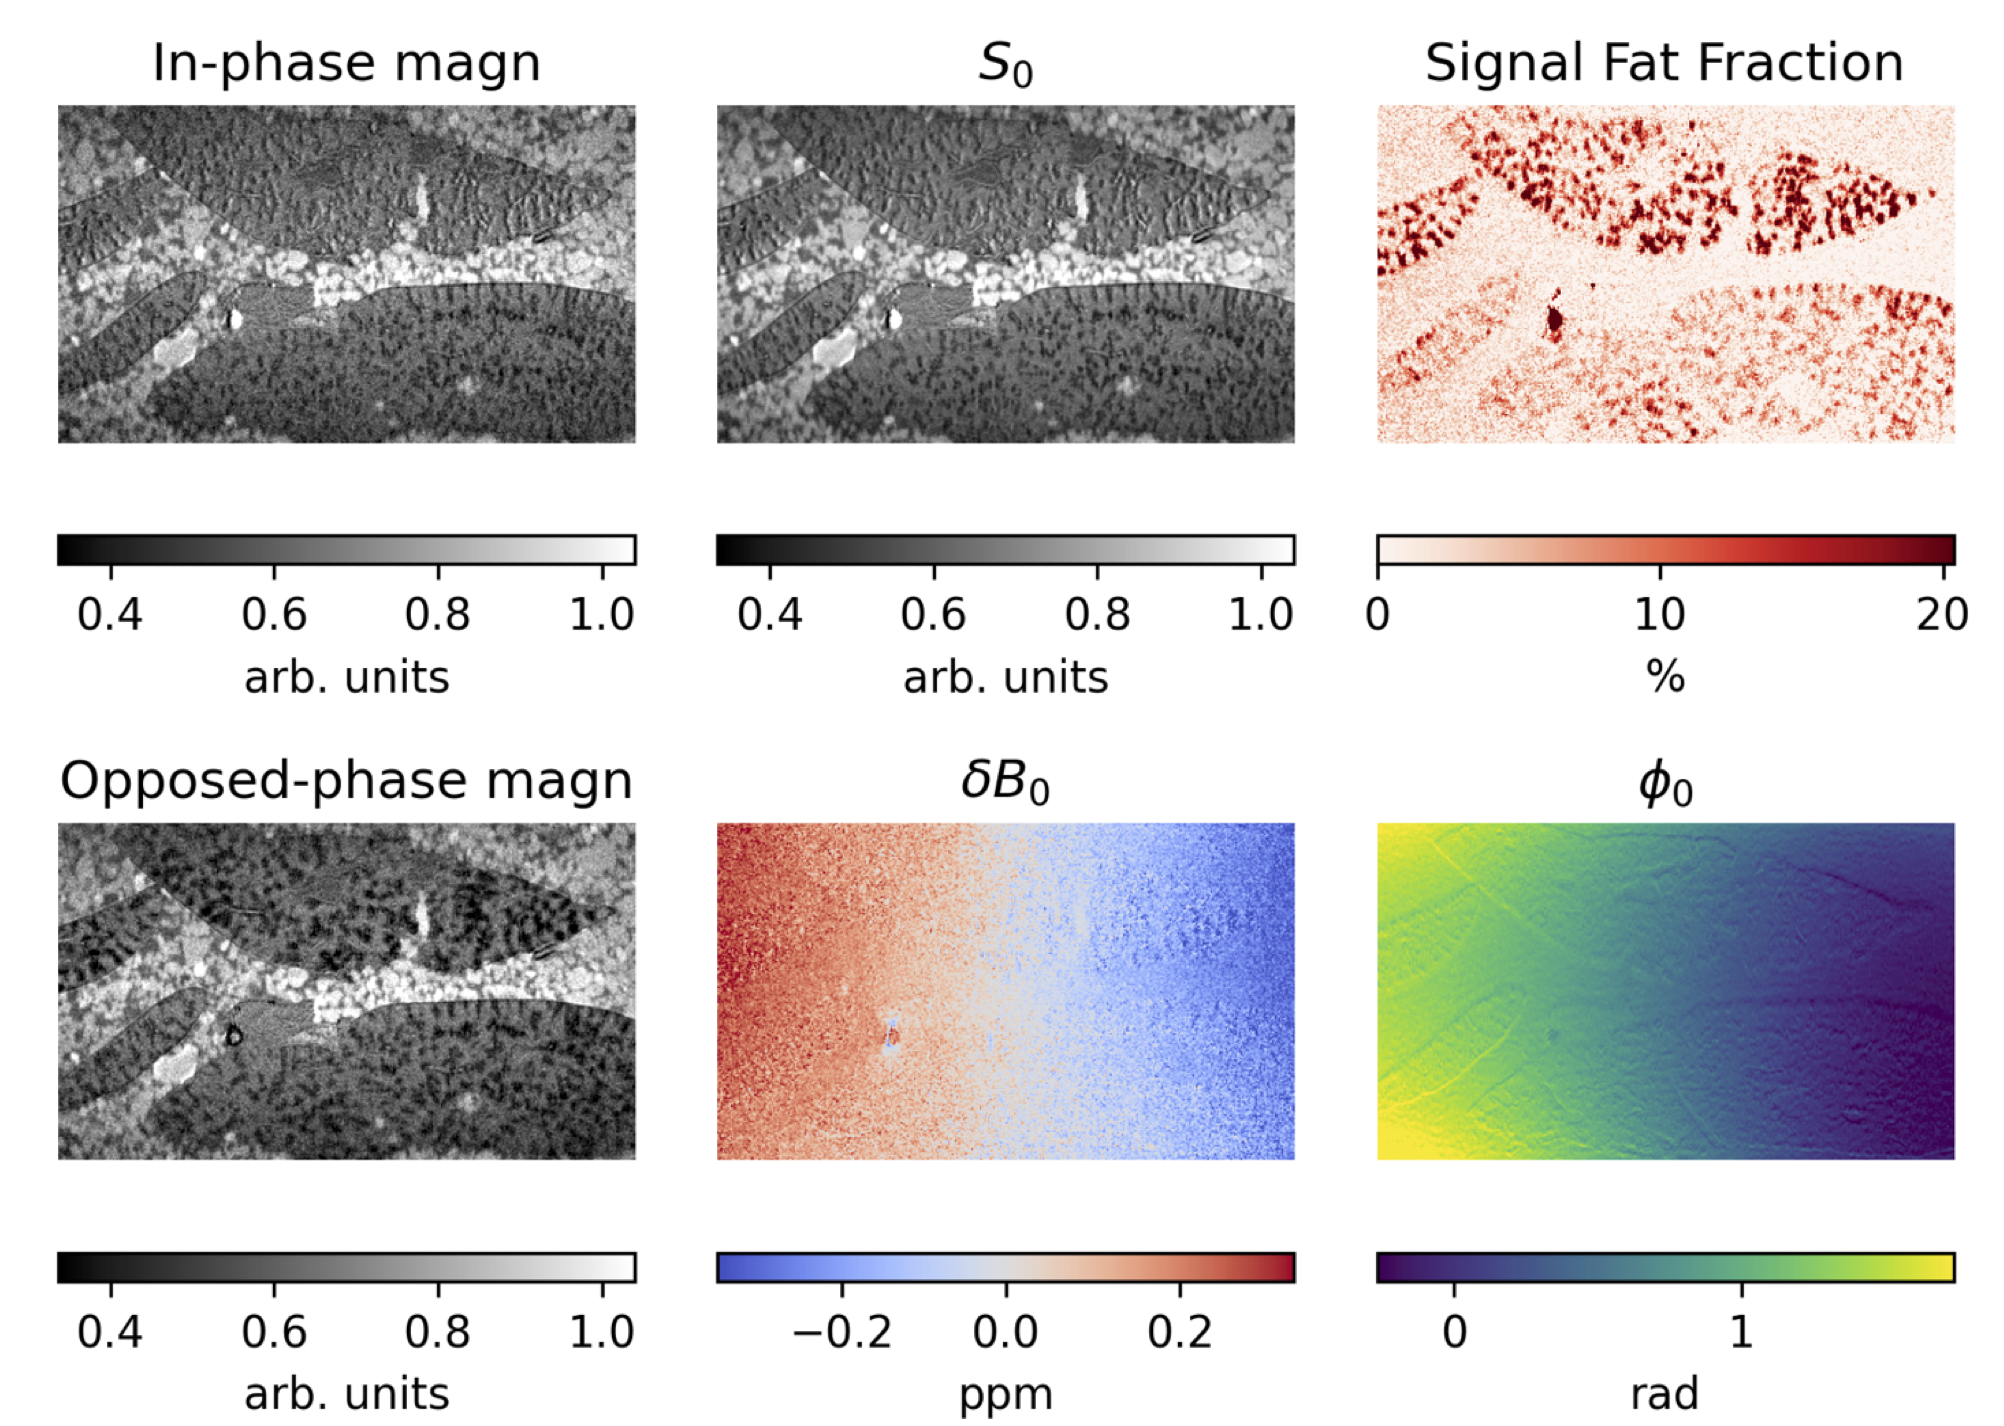
Figure 2. Magnitude of two of the input echoes (first column) and parameter maps, obtained through fitting eq. 1 to the complex data.
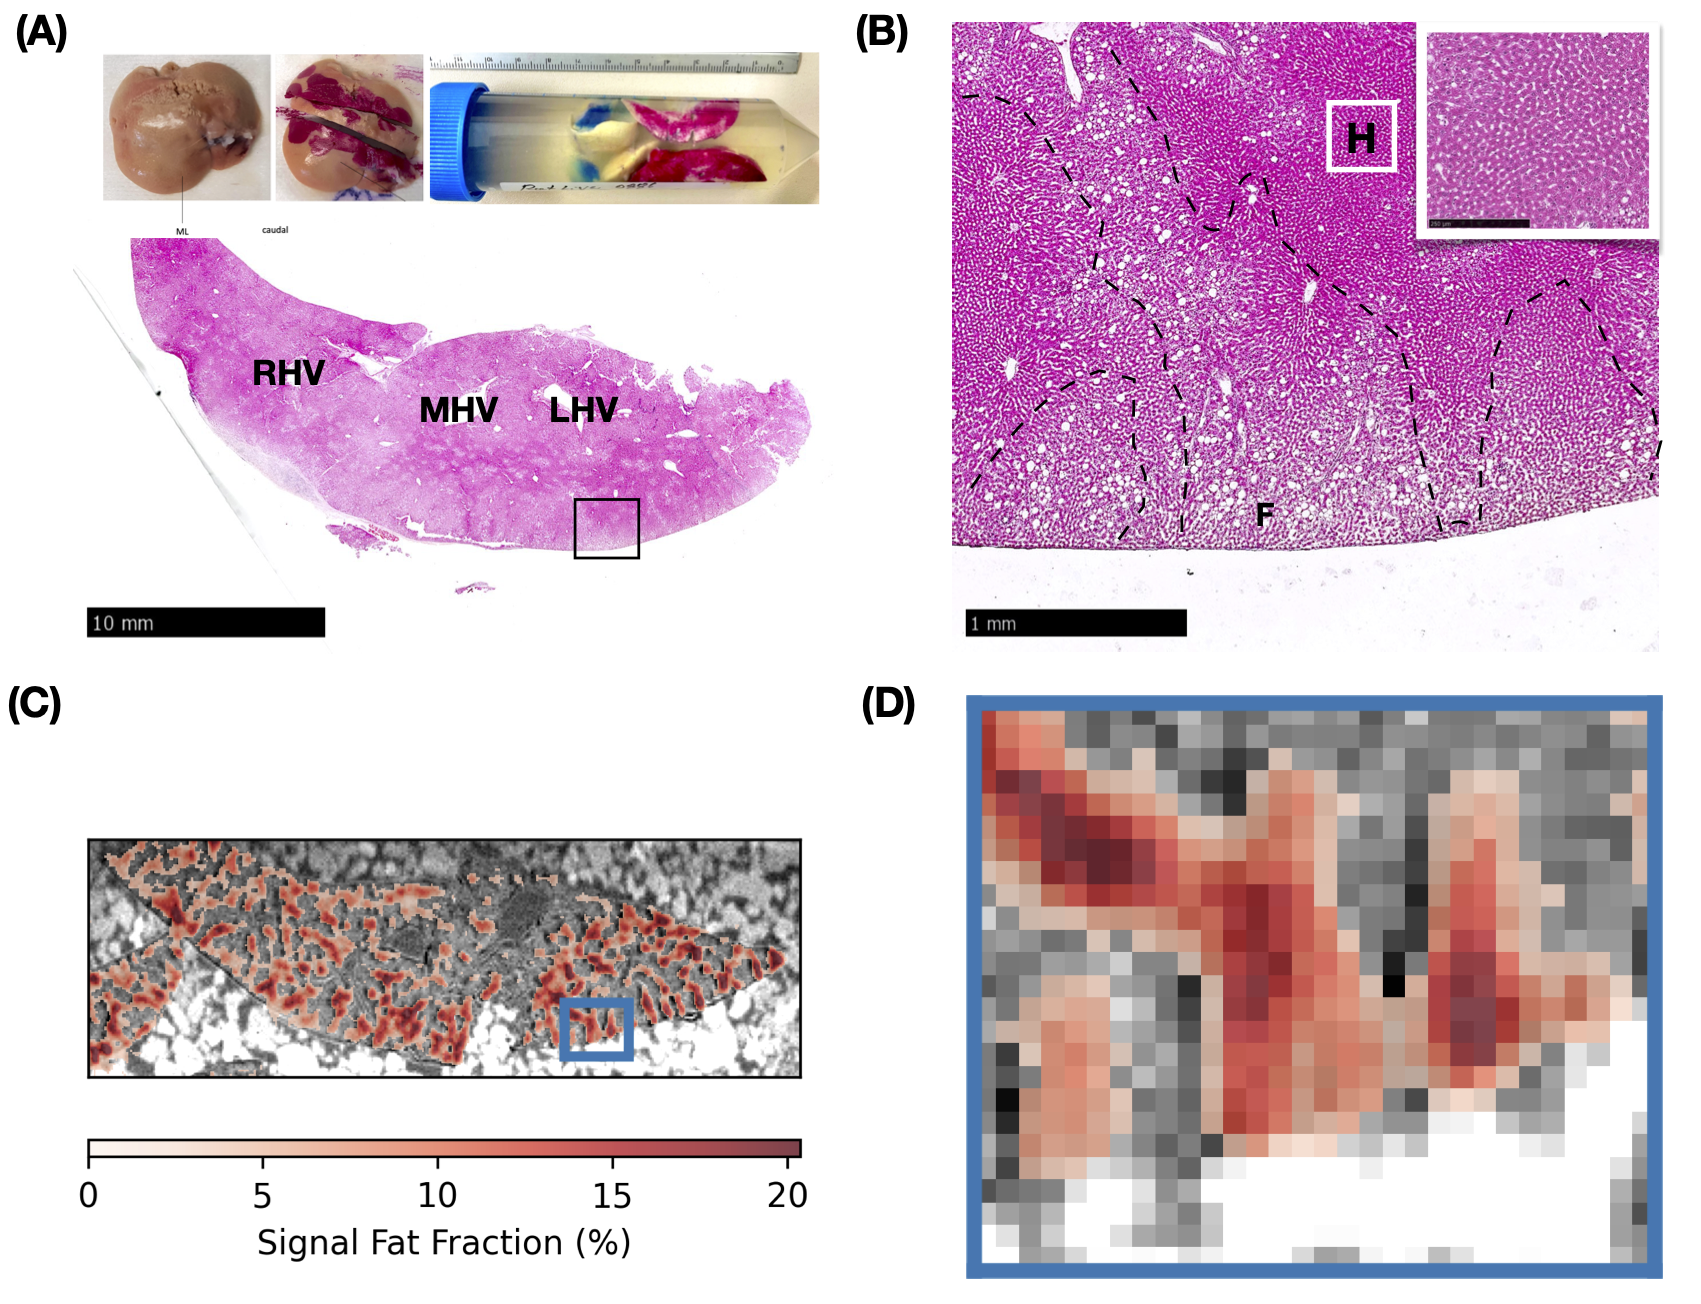
Figure 3. Matching ex vivo liver sample with signal fat fraction. (A) From lower magnification, three histological landmarks could be found. RHV/MHV/LHV: right/middle/left hepatic vein. (B) Fat droplets (round shaped, labeled F) deposit in the outer rim of the liver. Part of the hepatocytes remained intact (dense area and intact nucleus shown in higher magnification, labeled H). (C) Signal fat fraction (red colors) overlayed on S0 (gray) matched to the histological landmarks (MHV, LHV). (D) Enlarged area of the MRI signal fat fraction matching the histological area in (B).
DOI: https://doi.org/10.58530/2023/2374