2373
Echo-Volume Imaging with Restricted Field-of-View and (k, t)-Space Undersampling: A Fast fMRI Acquisition Technique1Center for Magnetic Resonance Research, University of Illinois at Chicago, Chicago, IL, United States, 2Department of Biomedical Engineering, University of Illinois at Chicago, Chicago, IL, United States, 3Departments of Radiology and Neurosurgery, University of Illinois at Chicago, Chicago, IL, United States
Synopsis
Keywords: Pulse Sequence Design, fMRI
Echo-volume imaging (EVI) can offer higher acquisition speed than echo-planar imaging (EPI) but is more sensitive to image distortion and blurring. In this study, we develop an EVI-based fast fMRI acquisition technique by employing three-dimension restricted field-of-view imaging (k-t rFOV-EVI) and (k, t)-space undersampling. Our human fMRI experiments covering the visual cortex demonstrate that k-t rFOV-EVI can provide higher image quality and fMRI detection sensitivity than the simultaneous multi-slice EPI at 2.5-mm-isotropic spatial resolution with a temporal resolution of 240 ms.
Introduction
Although echo-volume imaging (EVI)1,2 can provide fast image acquisition, it is sensitive to image distortion and blurring due to its long echo train length (ETL) 3,4, and thus it has not been widely used in fMRI studies. This study aims to develop an EVI-based pulse sequence (named k-t rFOV-EVI) to mitigate the aforementioned problems and further improve the acquisition efficiency. These were achieved by employing three-dimension restricted field-of-view (rFOV) imaging5 and random (k, t)-space undersampling6. Human visual fMRI experiments were conducted to demonstrate the capability of k-t rFOV-EVI in fast fMRI data acquisition over a focused imaging region. The performance of k-t rFOV-EVI was also compared to that of the simultaneous multi-slice EPI (SMS-EPI), which is the mainstream pulse sequence used in fast fMRI.Methods
k-t rFOV-EVI pulse sequence: As shown in Fig. 1A, the k-t rFOV-EVI sequence was built upon a gradient-echo multi-shot EVI sequence3. To reduce the ETL, a slab-selective 2D RF pulse5 was used to excite a partial 3D field-of-view. The RF pulse consisted of 11 sub-pulses that were modulated by an envelope pulse with pulse-width = 14.7 ms. The time-bandwidth product of sub-pulse/envelope pulse was 3.01/3.53. After one RF excitation (shot), blipped phase-encoding gradients were applied in the through-slab direction (or z-direction) to acquire M kx-ky planes in k-space using EPI readouts. A total of P (= Nz/M) shots are needed to acquire a 3D k-space matrix with size = Nx × Ny × Nz. To accelerate the image acquisition, the central (kz,c) and outer (kz,o) kz regions were respectively fully sampled and undersampled by varying the amplitudes of the blipped gradients in z. The sampling patterns of kz,o was randomly changed across different image volumes (time frames) (Fig. 1B). Compared to the conventional multi-shot EVI, the random (k, t)-space undersampling scheme reduced the number of acquired kx-ky planes from Nz to Ns at a given time frame, and the number of shots and the volume TR were reduced by a factor of R (= Nz/Ns) accordingly. No acceleration was applied to the kx-ky planes. The k-space time series acquired with k-t rFOV-EVI were reconstructed to full k-space data using the PS-Sparse algorithm6,7. Finally, magnitude images were obtained with a 3D-FFT (Fig. 1B).fMRI data acquisition and analysis: fMRI experiments were conducted in healthy subjects on a GE MR750 3T scanner with a 32-channel head coil. A 4-min paradigm with interleaved 16-s blank (black) screen and 16-s contrast-reversing (8-Hz) checkerboard was used for visual stimulation. fMRI images covering the visual cortex were acquired using the k-t rFOV-EVI sequence: FOV=19.2×8.0×6.0 cm3, matrix=76×32×24 (voxel size = 2.5×2.5×2.5 mm3), 3 shots with M = 2, the number of samples in kz,c/kz,o = 2/4 (R = 4), TR/volume-TR/TE = 80/240/30 ms, and flip angle = 20°. For comparison, an additional fMRI scan was performed with a commercial SMS-EPI sequence and the same spatial resolution: FOV=19.2×19.2cm2, 24 slices with slice acceleration factor = 8 and without in-plane acceleration, TR/TE = 240/30ms, and flip angle = 34°. The fMRI data were analyzed in AFNI. Motion correction and spatial smoothing with FWHM = 3 mm were applied to the data prior to the general linear model analysis. The t-maps were thresholded with p<0.0001 and cluster corresponding to FPR<0.05 to detect the brain activation. The number of activated voxels and average t-value were measured in the visual cortex.
Results
Fig. 2 illustrates SMS-EPI and k-t rFOV-EVI images from a representative subject. It can be seen that severe g-factor noise appeared in the SMS-EPI images due to the short distance between simultaneously excited slices (=7.5 mm). Compared to the SMS-EPI, k-t rFOV-EVI provided better image quality for visualizing the brain structures. In the fMRI activation maps (Fig. 3), there were 36% more activated voxels in the visual cortex in the k-t 3D-rFOVI (2062 voxels) than in the SMS-EPI (1521 voxels) scan, and the average t-value of activated foci was elevated in the k-t rFOV-EVI scan (t-value = 7.6) relative to the SMS-EPI scan (t-value = 6.9). k-t rFOV-EVI also improved the temporal SNR by about 42% (temporal SNR = 52.8/37.2 for k-t rFOV-EVI/SMS-EPI).Discussion and Conclusions
In this study, we demonstrated a k-t rFOV-EVI pulse sequence for acquiring fMRI data in a restricted field-of-view at 2.5-mm spatial resolution and an ultrashort volume TR (240 ms). The use of rFOV reduces the ETL, hence mitigating the image quality problems while increasing acquisition efficiency. The scan efficiency is further improved by the use of (k, t)-space undersampling and PS-Sparse reconstruction. The fMRI experiments have shown that this new sequence provides higher image quality than SMS-EPI and considerably improves the detection sensitivity of brain activations. These results indicate that k-t rFOV-EVI can be a strong contender for fast fMRI studies over a focused brain area. In the present study, the acquisition of each kx-ky plane was completed in a single TR. If a higher spatial resolution (< 2.5 mm) is required for an fMRI study, a kx-ky plane can be acquired using interleaved/multi-segment EPI modules to increase the number of phase encodings in the ky-direction3. We will investigate this case in future studies.Acknowledgements
This work was supported in part by the National Institutes of Health (Grant No. 5R01EB026716-01 and 1S10RR028898-01). The content is solely the responsibility of the authors and does not necessarily represent the official views of the National Institutes of Health.
References
1. Mansfield P, Howseman AM, Ordidge RJ. Volumar imaging using NMR spin echoes—echo volumar imaging (EVI) at 0.1 T. J Phys E Sci Instrum 1989;22:324–330.
2. Song AW, Wong EC, Hyde JS. Echo-volume imaging. Magn Reson Med 1994;32:668–671.
3. van der Zwaag W, Francis S, Bowtell R. Improved echo volumar imaging (EVI) for functional MRI. Magn Reson Med 2006;56:1320-1327.
4. Posse S, Ackley E, Mutihac R, Rick J, Shane M, Murray-Krezan C, Zaitsev M, Speck O. Enhancement of temporal resolution and BOLD sensitivity in real-time fMRI using multi-slab echo-volumar imaging. Neuroimage 2012;61:115-130.
5. Sun K, Zhong Z, Dan G, Karaman M, Luo Q, Zhou XJ. Three-dimensional reduced field-of-view imaging (3D-rFOVI). Magn Reson Med 2022;87:2372-2379.
6. Zhao B, Haldar JP, Christodoulou AG, Liang Z-P. Image reconstruction from highly undersampled (k, t)-space data with joint partial separability and sparsity constraints. IEEE Trans Med Imaging 2012;31:1809–1820.
7. Luo Q, Sun K, Scotti A, Dan G, Karaman M, and Zhou XJ: Fast 3D fMRI acquisition over a small field-of-view with (k, t)-space undersampling. Proceedings of the 31st Annual Meeting of the ISMRM; p. 3724; May, 2022.
Figures
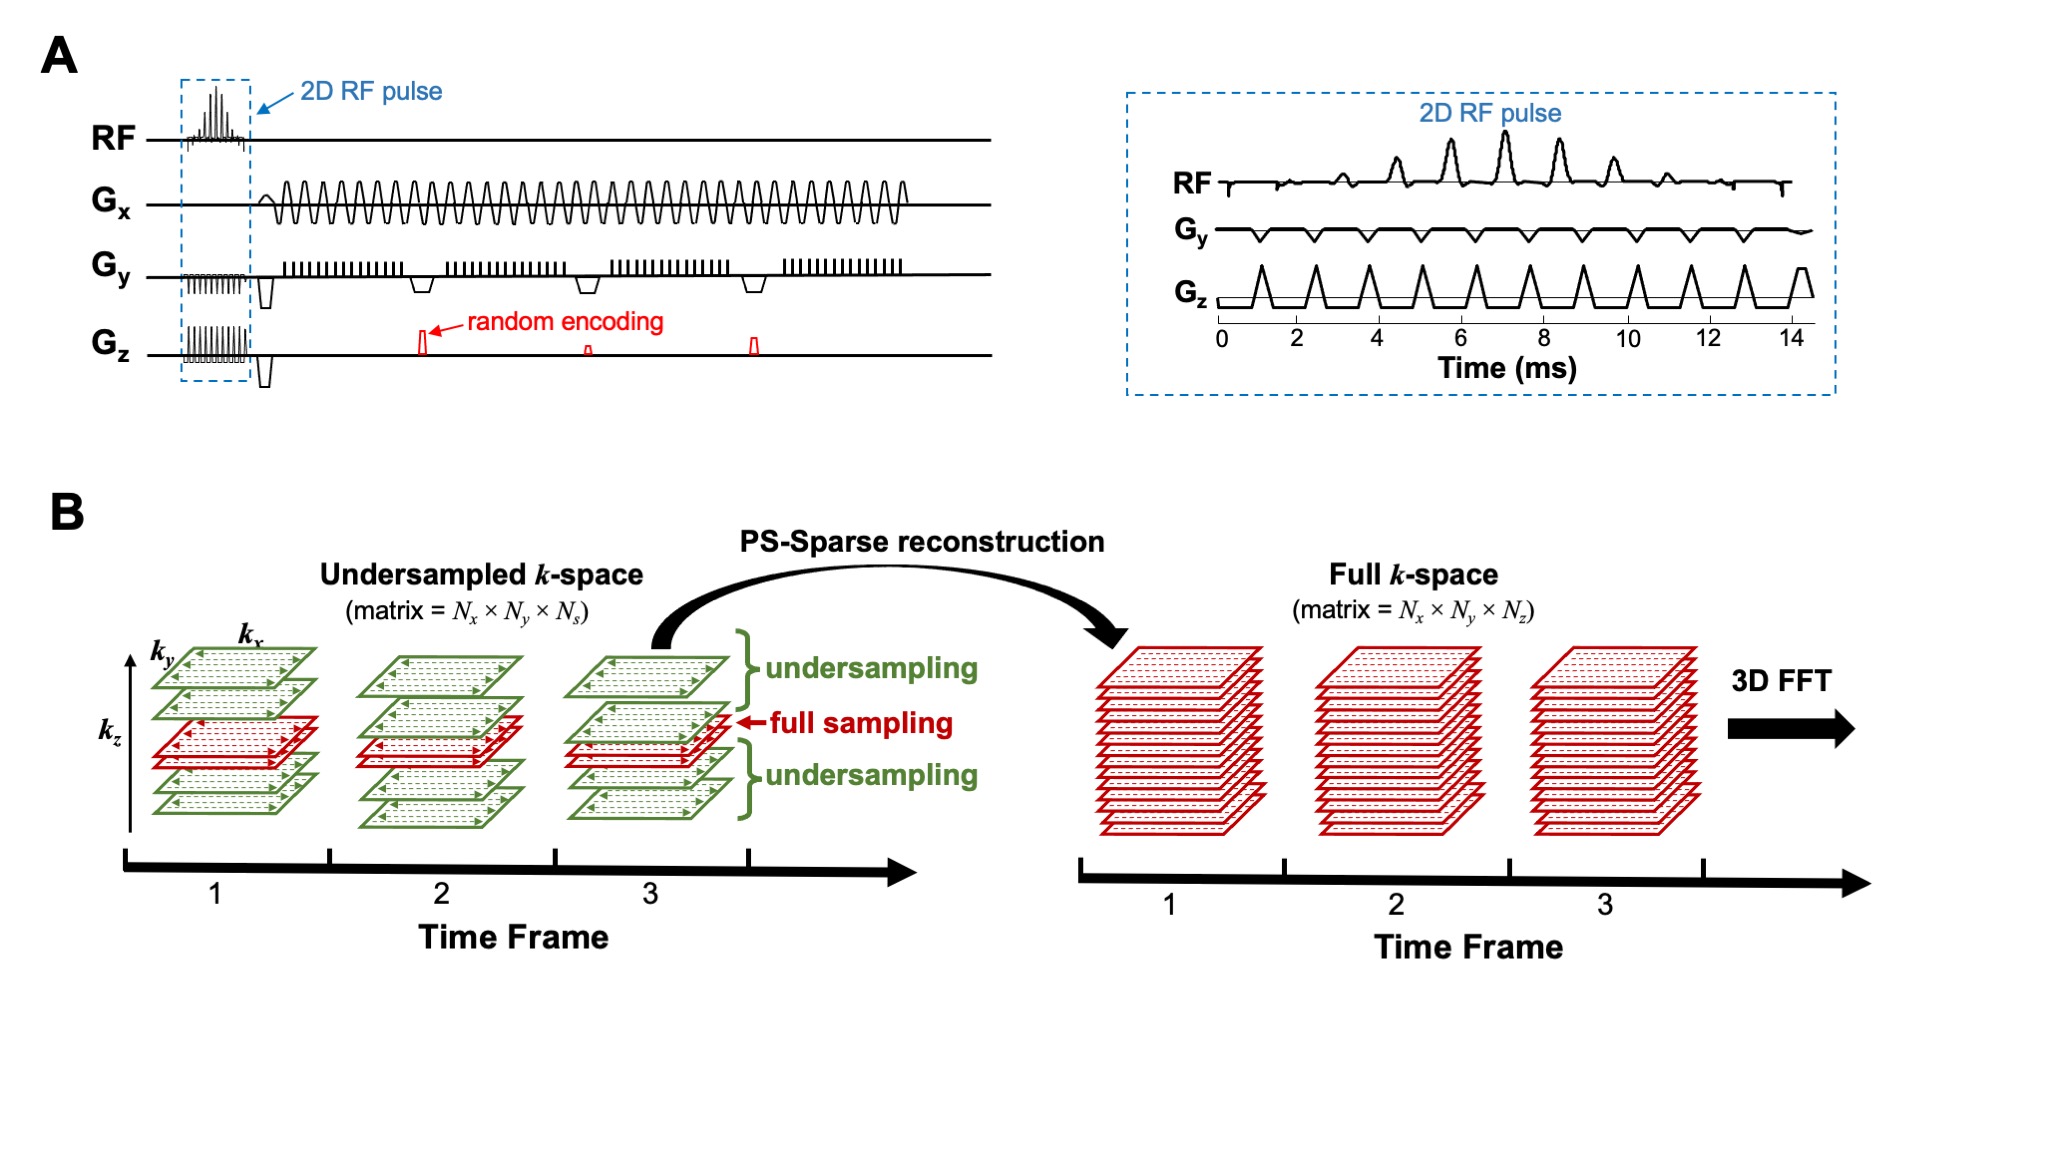
Fig. 1. (A) A diagram of the k-t rFOV-EVI pulse sequence (left) and its associated 2D RF pulse (right). The phase-encodings in the z-direction were randomized by varying the amplitudes of blip gradients (indicated in red). (B) Illustration of k-space sampling in k-t rFOV-EVI and its image reconstruction steps. The outer kz regions were sampled with random patterns at each time frame while the central kz region was fully sampled. The undersampled k-space data were reconstructed to full k-space data with the PS-Sparse algorithm, followed by magnitude image reconstruction with a 3D FFT.
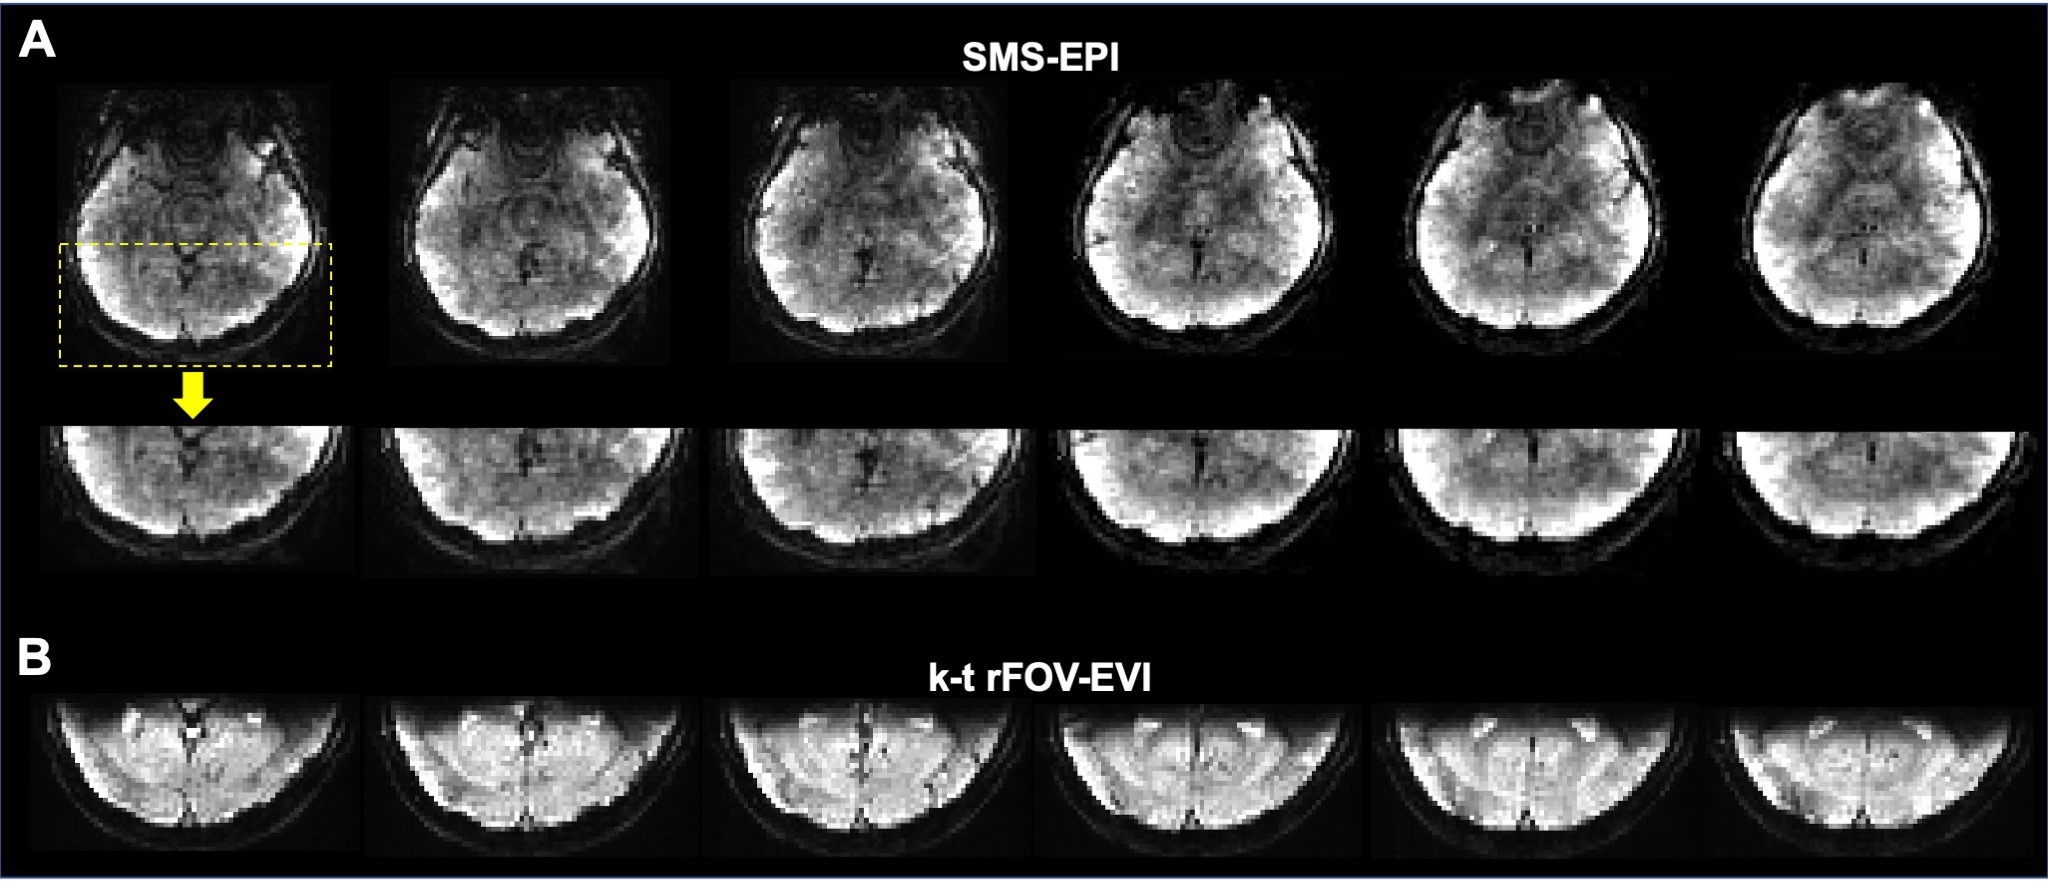
Fig. 2. Representative images from SMS-EPI (A) and k-t rFOV-EVI (B) scans. The images in the second row in (A) are cropped from the corresponding SMS-EPI images (first row) to match the image regions in the k-t rFOV-EVI scan.
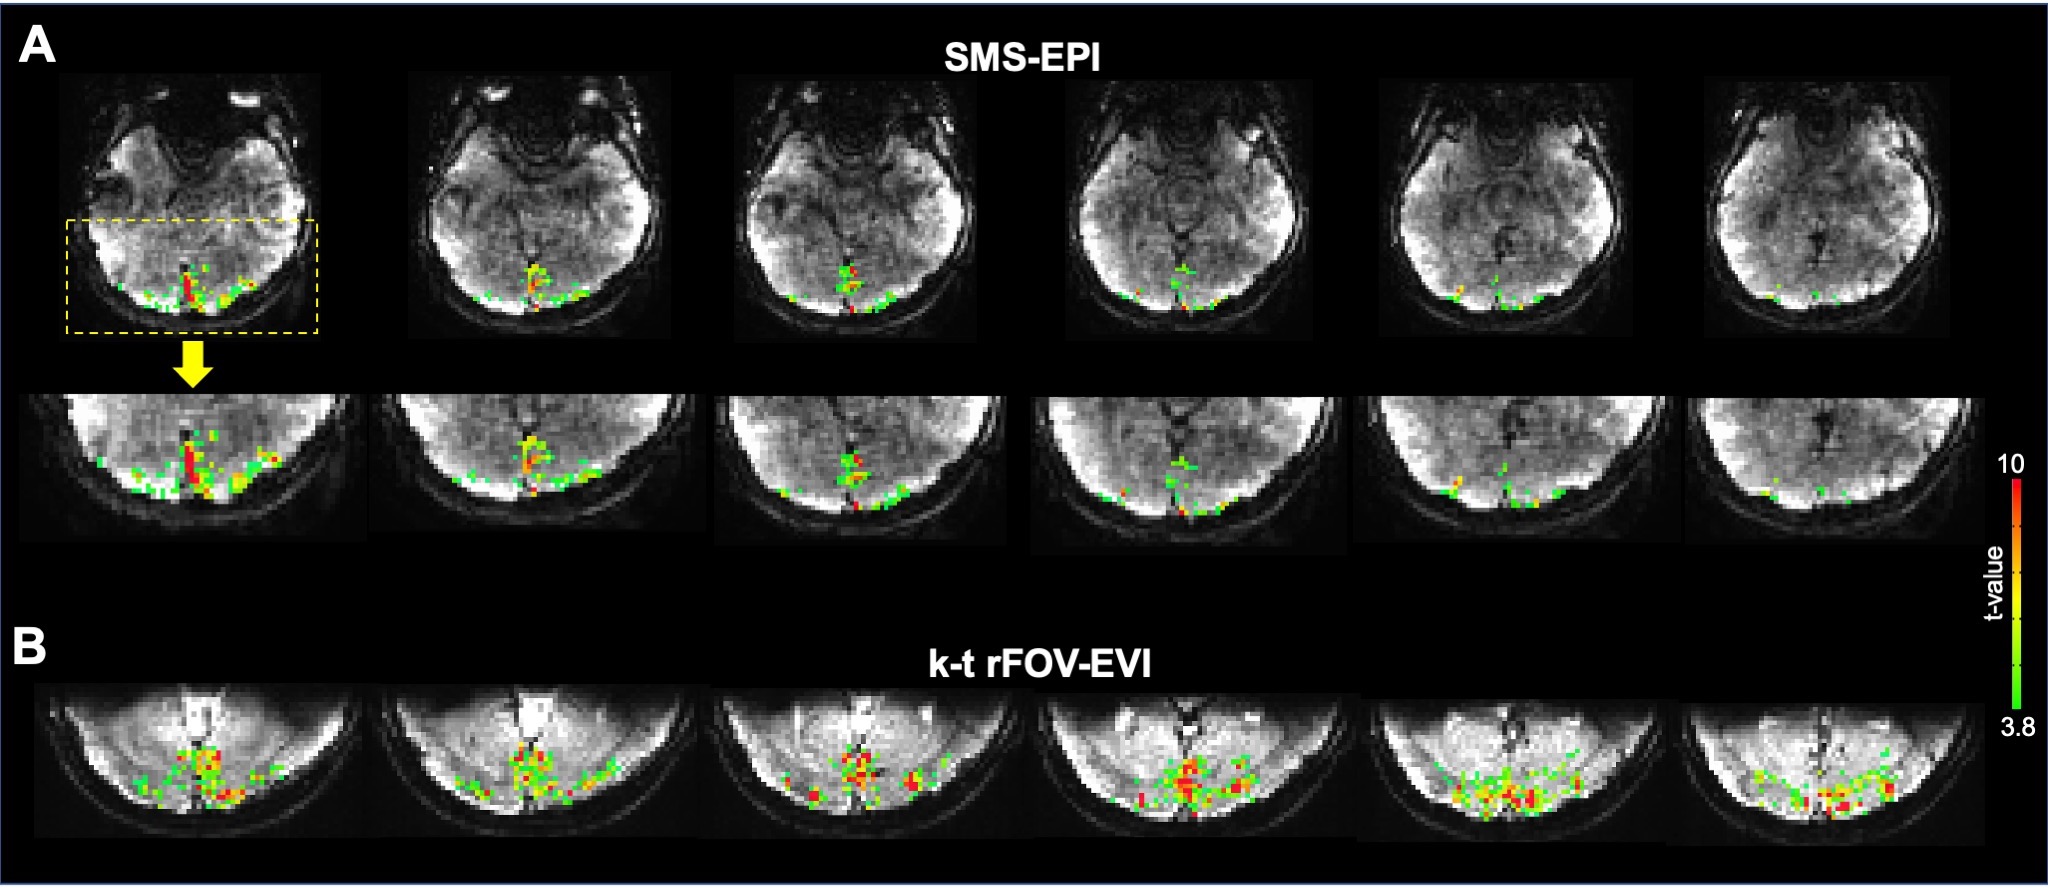
Fig. 3. fMRI activation maps obtained from the SMS-EPI (A) and k-t rFOV-EVI (B) images in a representative subject (p < 0.0001 with cluster corrected FPR < 0.05). The k-t rFOV-EVI scan detected more activated voxels and produced larger t-values (average t-value = 6.9/7.6 for SMS-EPI/k-t rFOV-EVI) in the visual cortex.