2365
Inline calculation of Extracellular Volume Maps using Cardiac Magnetic Resonance Fingerprinting1Department of Molecular Medicine and Surgery, Karolinska Institutet, Stockholm, Sweden, 2Department of Clinical Physiology, Karolinska University Hospital, Stockholm, Sweden, 3MR R&D Collaborations, Siemens Medical Solutions USA Inc., Chicago, IL, United States, 4Department of Radiology, University of Michigan, Ann Arbor, MI, United States
Synopsis
Keywords: MR Fingerprinting/Synthetic MR, Cardiovascular
This work describes a pipeline for fully inline generation of T1, T2 and extracellular volume (ECV) maps from cardiac Magnetic Resonance Fingerprinting (MRF) data. Reconstruction of multi-parametric tissue property maps using cardiac MRF have recently been made possible directly on the scanner by replacing the need to perform Bloch equation simulations with a neural network. MRF-derived T1, T2 and ECV values were acquired and compared to MOLLI and T2p-SSFP in 5 successive clinical patients.Introduction
The goal of this work is to describe a pipeline for fully inline generation of T1, T2, and extracellular volume (ECV) maps from cardiac Magnetic Resonance Fingerprinting (MRF) data. Reconstruction of multiparametric tissue property maps using cardiac MRF has recently been made possible directly on the scanner by replacing the need to perform time-consuming Bloch equation simulations with neural networks. Previous work has described a fully-connected feed-forward network trained on Bloch-simulated signal evolutions with varying heart rates (1). In this work, we extend that work and present a fully-inline workflow for T1, T2, proton spin density (PD), and extracellular volume (ECV) parameter maps with motion correction, implemented in the FIRE framework.Methods
Data were acquired at 1.5 T (MAGNETOM Aera and Sola, Siemens Healthcare, Erlangen, Germany) in five subjects undergoing clinically referred exams who gave written consent to participate in this IRB-approved study. A prototype FISP-based cardiac MRF sequence with scan parameters similar to previous work (2) was added to the clinical protocol, which already included modified Look-Locker inversion recovery (MOLLI) based T1 and ECV mapping, as well as T2-prepared single-shot bSSFP mapping. The MRF data were collected during a 15-heartbeat breath-hold with diastolic ECG triggering at a mid-ventricular short-axis slice, both before and 10-15 minutes after intravenous injection of 0.1–0.2 mmol per kg body weight of gadobutrol (Gadovist, Bayer, Berlin, Germany). A venous blood sample was collected to determine the hematocrit, which was entered into the scanner interface. Data were processed directly on the scanner using the prototype framework for image reconstruction environments (FIRE, Siemens Healthcare, Erlangen, Germany) (3). The MRF dictionaries were generated using a previously described fully-connected neural network implemented in TensorFlow/Keras (1). The input to the network was a T1 value, a T2 value, and cardiac RR intervals. The output was a dictionary entry for the desired T1/T2 combination. A dictionary subspace reconstruction with locally low-rank regularization was implemented in the Berkely Advanced Reconstruction Toolbox (BART) (4). The final parametric maps were generated by performing pattern matching in the dictionary subspace. Native (pre-contrast) T1, T2, and PD maps were stored temporarily in a database. The post-contrast workflow loaded the pre-contrast maps from the database for ECV map calculation. Synthetic bSSFP-like images with a strong contrast between blood and myocardium were generated from the T1, T2, and PD maps. Non-linear diffeomorphic image registration was performed between the synthetic images. The motion fields were then used to co-register the pre-contrast and post-contrast T1 maps. Voxel-wise ECV maps were calculated as$$ECV = (100\% - \textrm{hematocrit}) \cdot \left ( \frac{ \frac{1}{T_{1,post,myo}} - \frac{1}{T_{1,pre,myo}}}{\frac{1}{T_{1,post,blood}}-\frac{1}{T_{1,pre,blood}}} \right )$$
An overview of the image processing pipeline is summarized in Figure 1. In addition to the MRF-generated maps, ECV maps were also calculated in a similar fashion from the pre-and post-contrast MOLLI acquisitions, using a work-in-progress prototype sequence (WIP 068, Siemens Healthcare, Erlangen, Germany). Image analysis was performed in Segment v3.2 R8836 (Medviso AB, Lund, Sweden) (5). T1 and T2 values were measured by manually drawing a region of interest in the septal wall.
Results
The average reconstruction time at the MRI scanner was 37 seconds per slice for the pre-contrast maps and 49 seconds for the post-contrast maps, which included the time for image registration and ECV calculation. The majority of the reconstruction time was due to the iterative low-rank reconstruction (average time 28 seconds). Representative images from one subject is presented in Figure 2. The mean difference in native myocardial T1 measured by MRF compared to MOLLI was 53.0 ms, Table 1. The mean difference between myocardial T2 measured by MRF compared to T2-prepared single-shot SSFP was -5.2 ms. After contrast injection, the mean difference in post-Gd myocardial T1 measured by MRF compared to MOLLI was -4.4 ms. The mean difference in ECV measured by MRF and MOLLI was 5.7 percentage points. When MOLLI apparent T1 (T1*) in the blood was used to calculate ECV, the mean difference between MRF-derived and MOLLI-derived ECV values was 4.3 percentage points, Tables 2 and 3.Discussion
This work has demonstrated a fully inline workflow for reconstructing cardiac MRF native and post-contrast tissue parameter maps, including fully inline calculation of ECV maps with measured hematocrit from a venous blood draw. Future work will investigate the discrepancy in ECV values calculated between MOLLI and MRF, which is potentially due to inaccuracies in blood T1 measurements in both MOLLI and MRF from through-plane flow effects.Conclusion
We have demonstrated the feasibility of fully inline T1, T2, and ECV mapping with cardiac Magnetic Resonance Fingerprinting in a clinical setting.Acknowledgements
Funded in part by NIH/NHLBI R01HL163030References
1. Hamilton JI, Seiberlich N. Machine Learning for Rapid Magnetic Resonance Fingerprinting Tissue Property Quantification. Proc. IEEE 2020;108:69–85.
2. Hamilton JI, Jiang Y, Chen Y, Ma D, Lo WC, Griswold M, Seiberlich N. MR fingerprinting for rapid quantification of myocardial T1, T2, and proton spin density. Magn. Reson. Med. 2017;77:1446–1458.
3. Chow K, Kellman P, Xue H. Prototyping Image Reconstruction and Analysis with FIRE. In: proc. SCMR. Virtual Scientific Sessions; 2021. p. 838972.
4. Uecker M, Tamir JI, Bahri D, Virtue P, Cheng J, Zhang T, Lustig M. Berkeley advanced reconstruction toolbox. In: Proc. 23rd Annu. Meet. ISMRM. Toronto, Canada; 2015. p. 2486.
5. Heiberg E, Carlsson M, Arheden H, Ugander M, Sjögren J, Engblom H. Design and validation of Segment - freely available software for cardiovascular image analysis. BMC Med. Imaging 2010;10:1–13.Figures
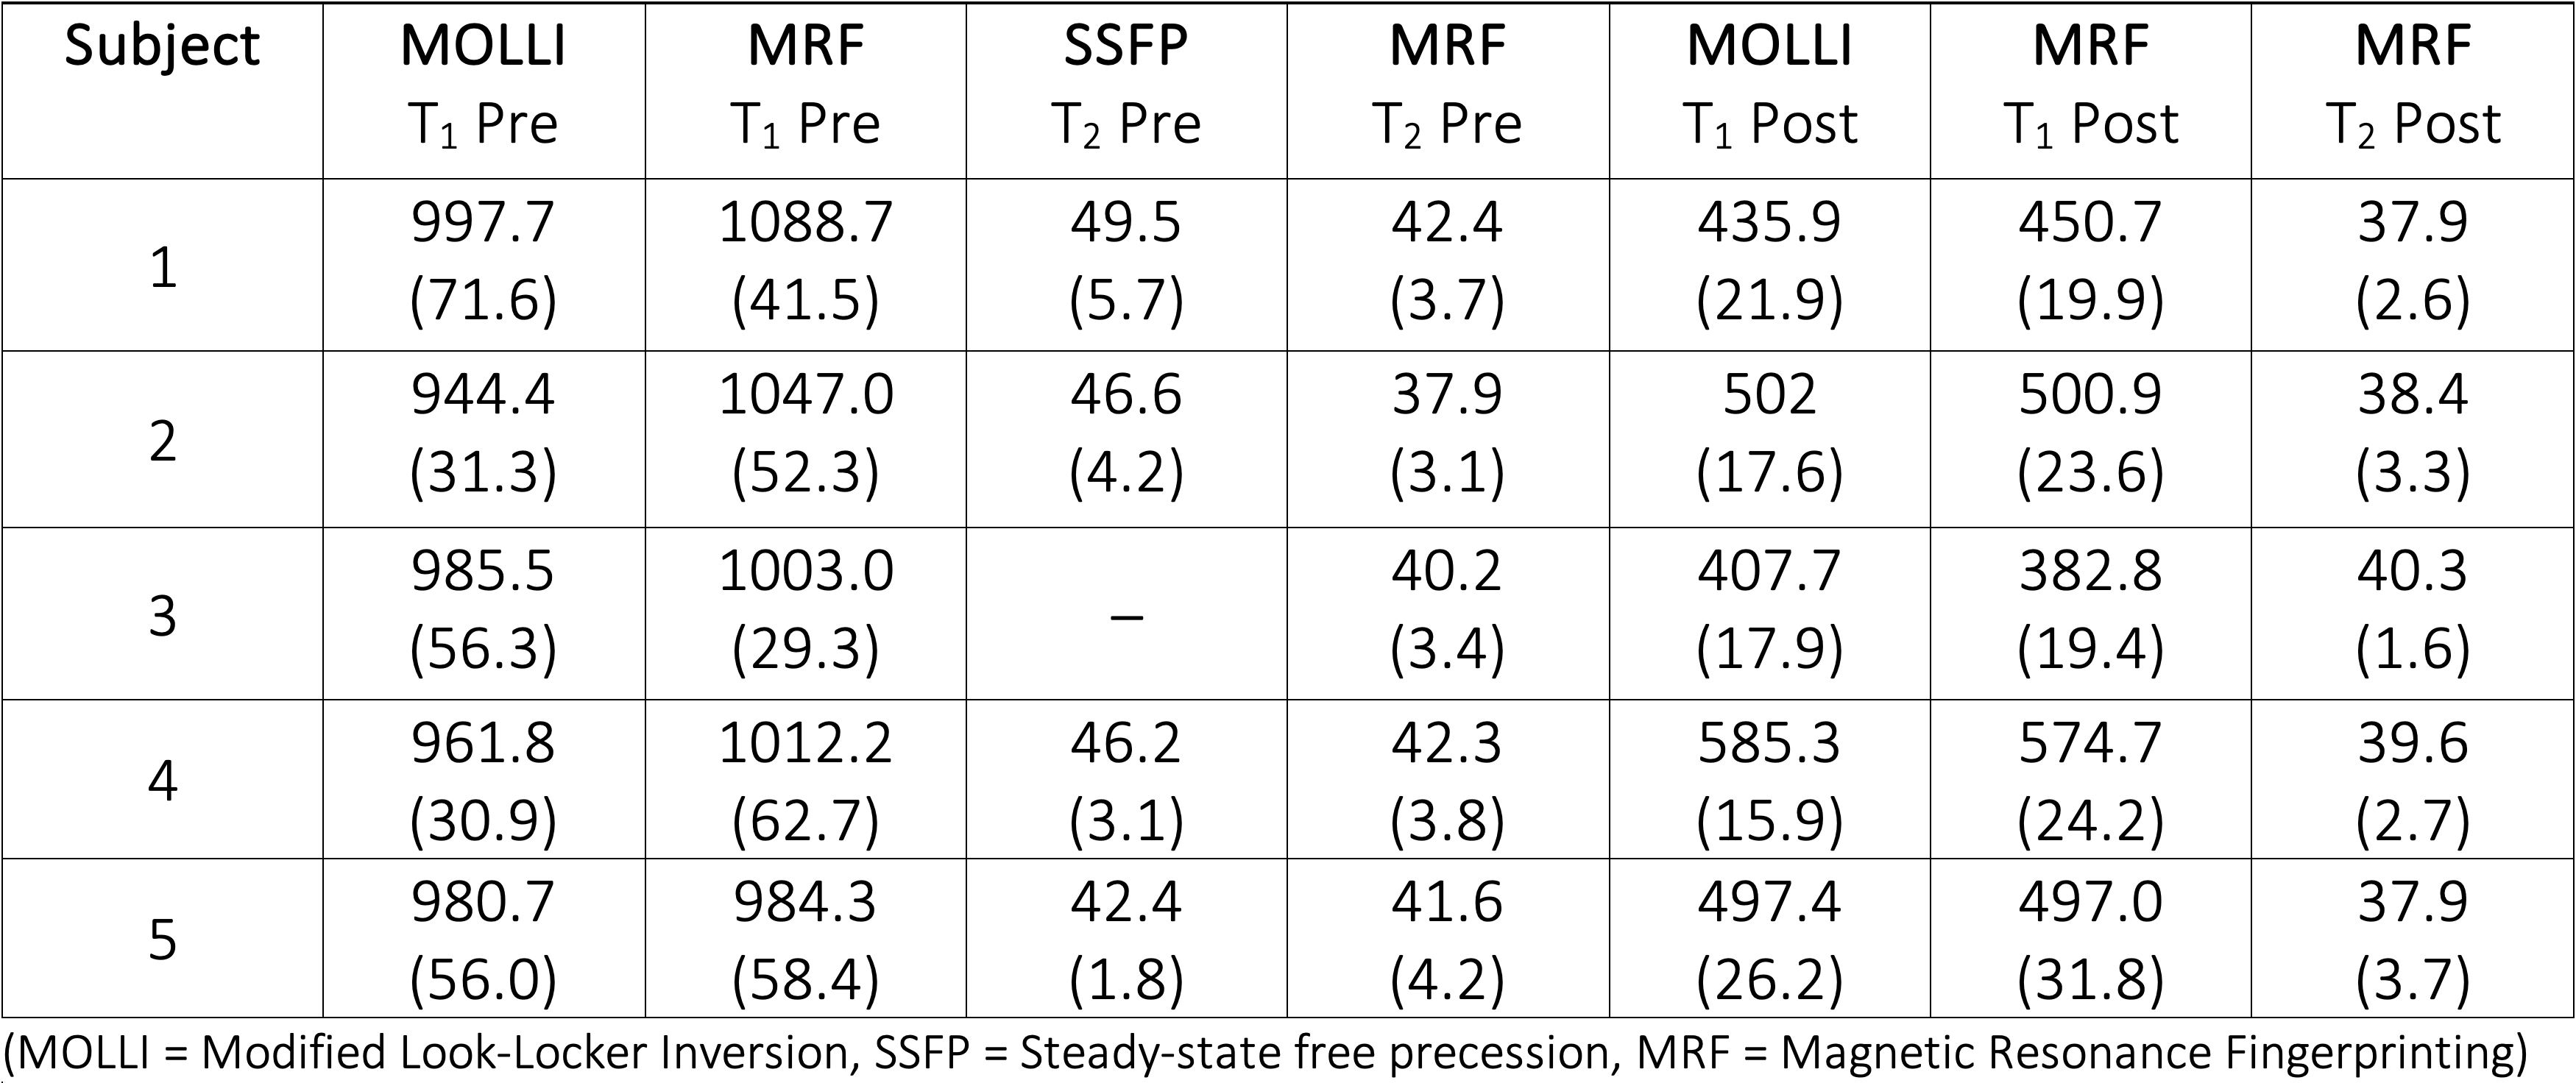
Table 1. Myocardial (septal) tissue parameters (T1 and T2) in ms for all subjects; mean (SD).
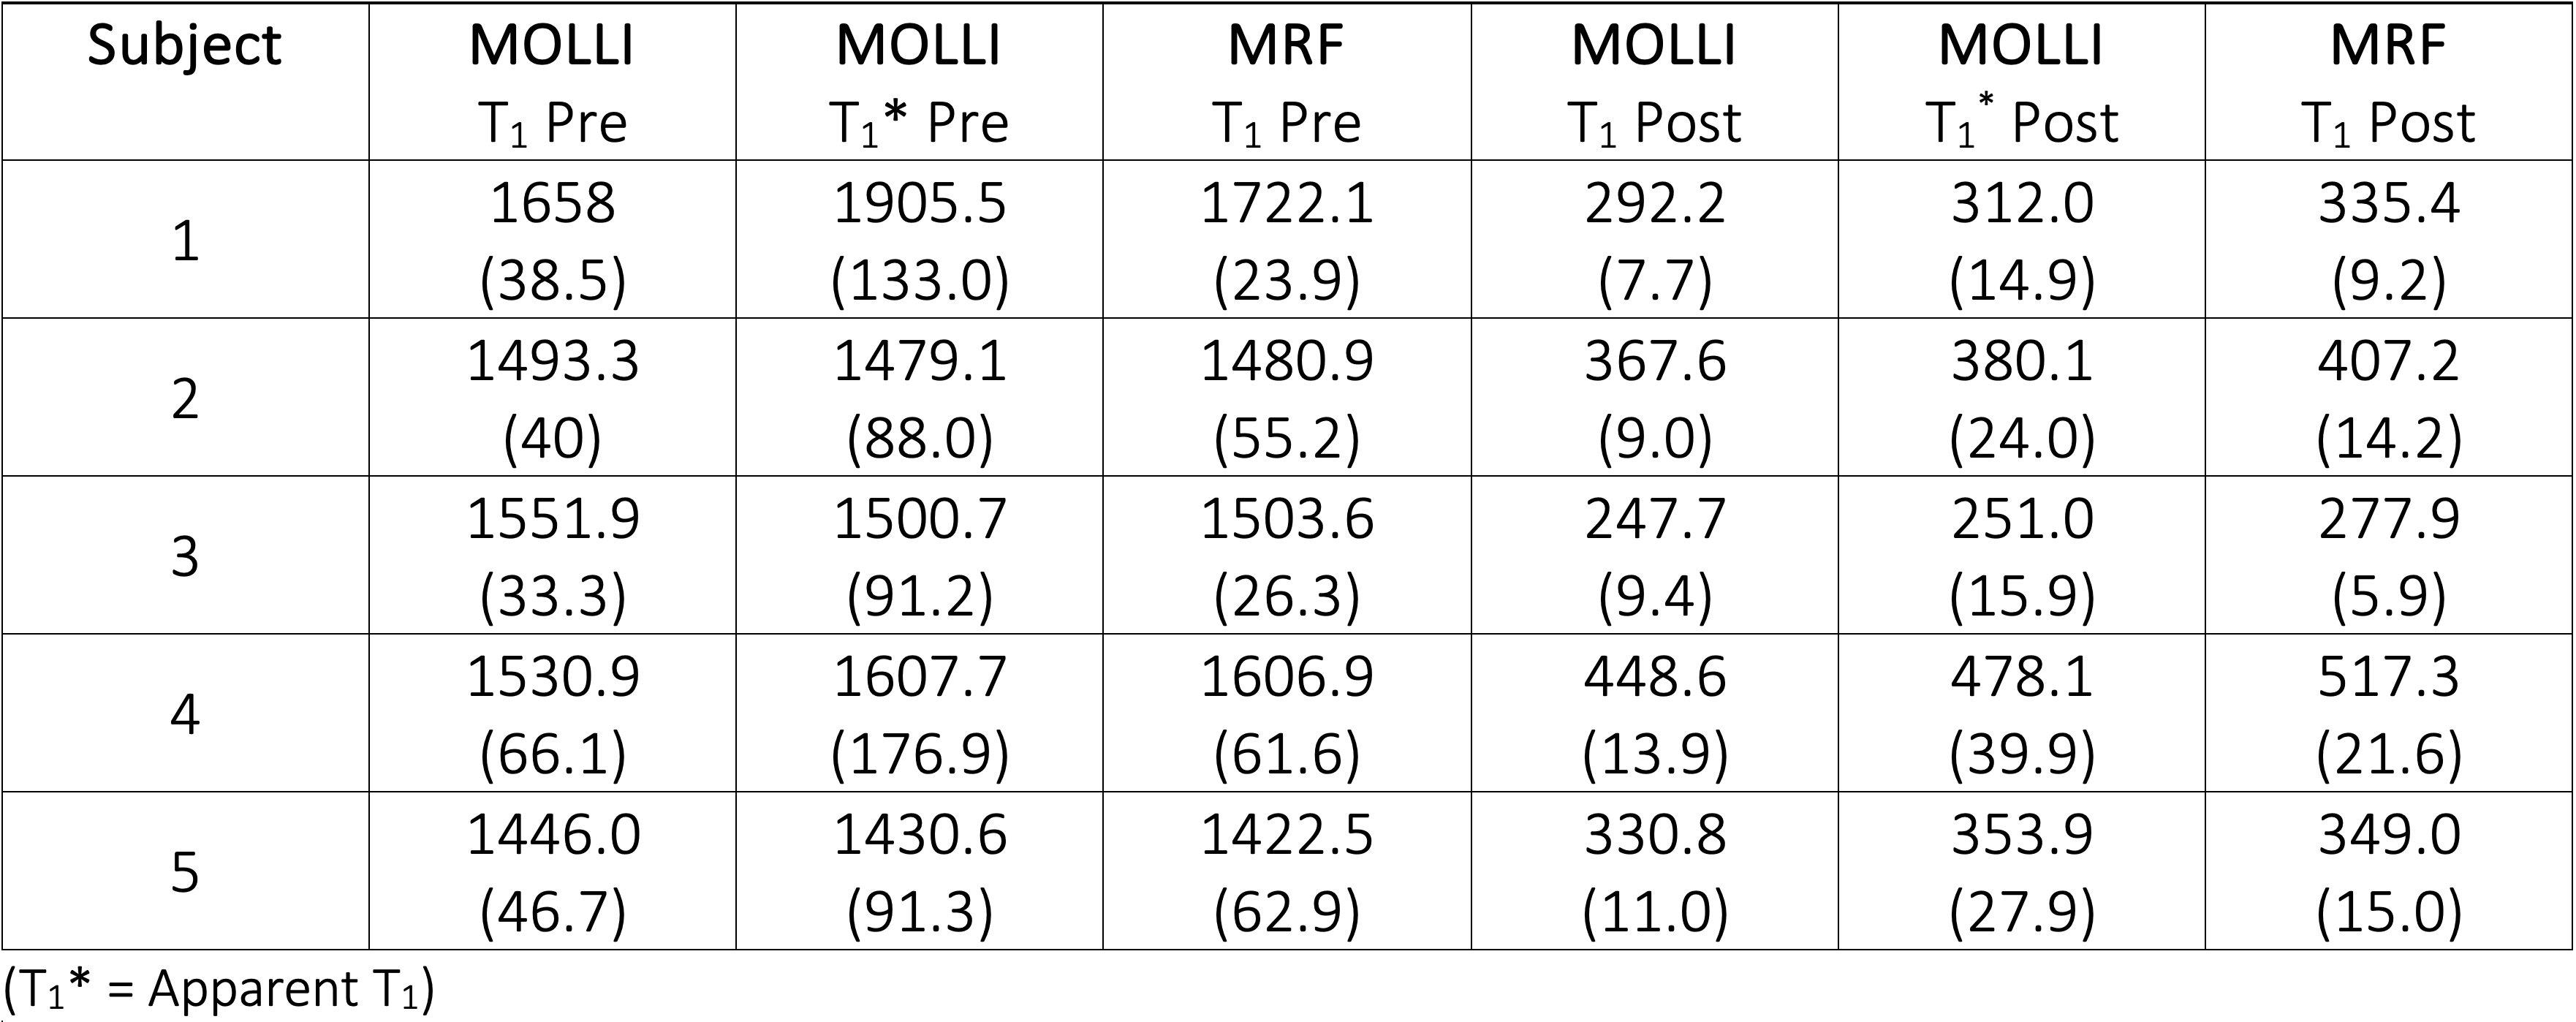
Table 2. Blood longitudinal relaxation times (T1 and T1*) in ms for all subjects; mean (SD).
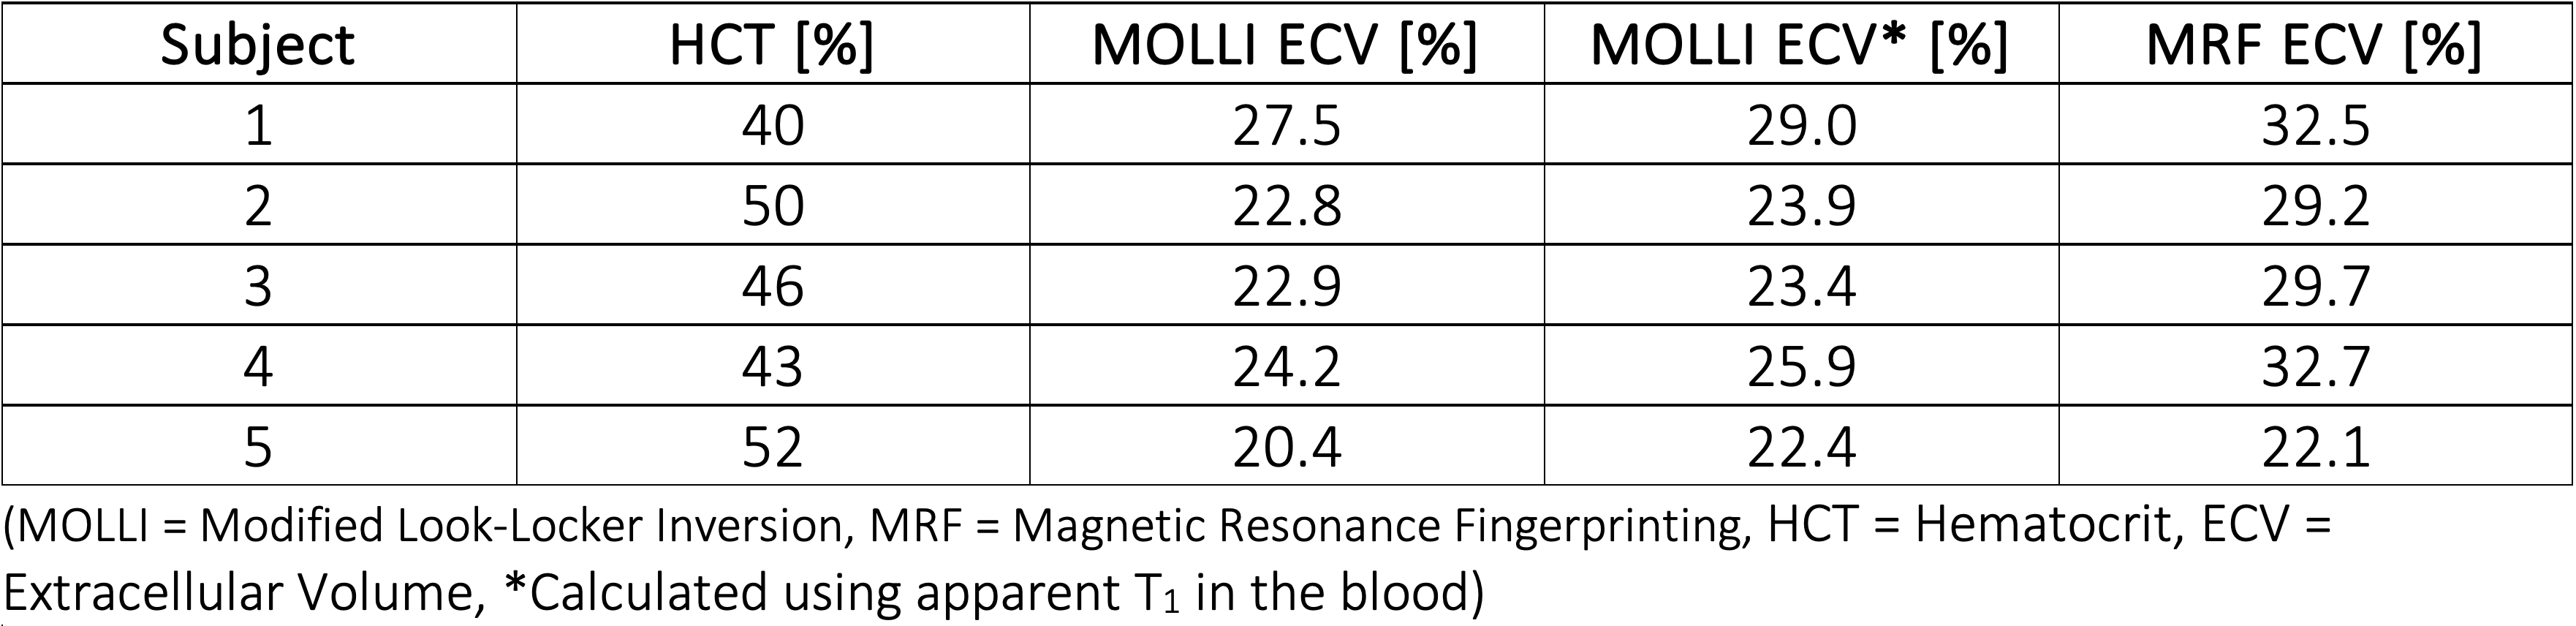
Table 3. Estimated extracellular volume fraction for all subjects.
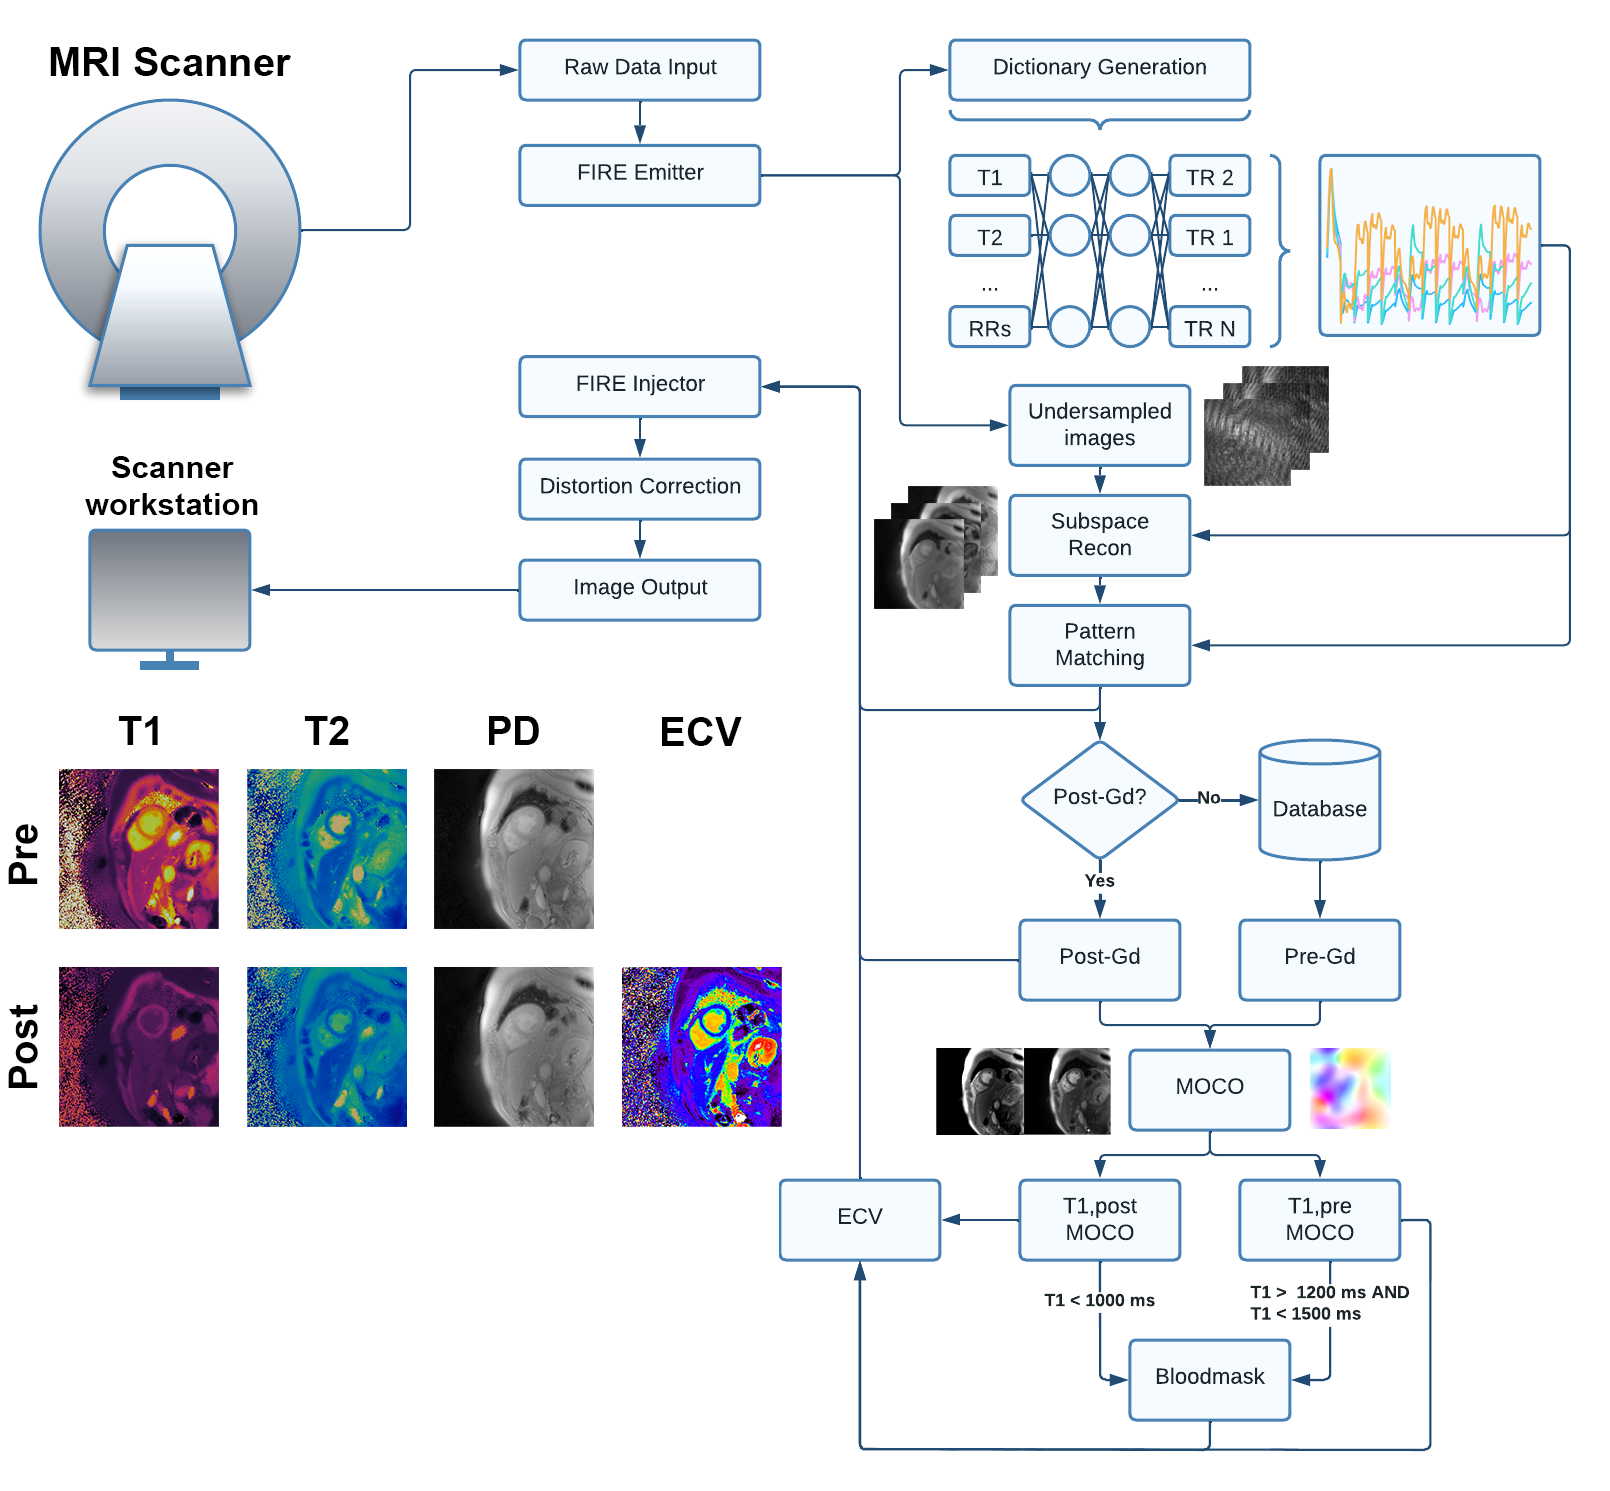
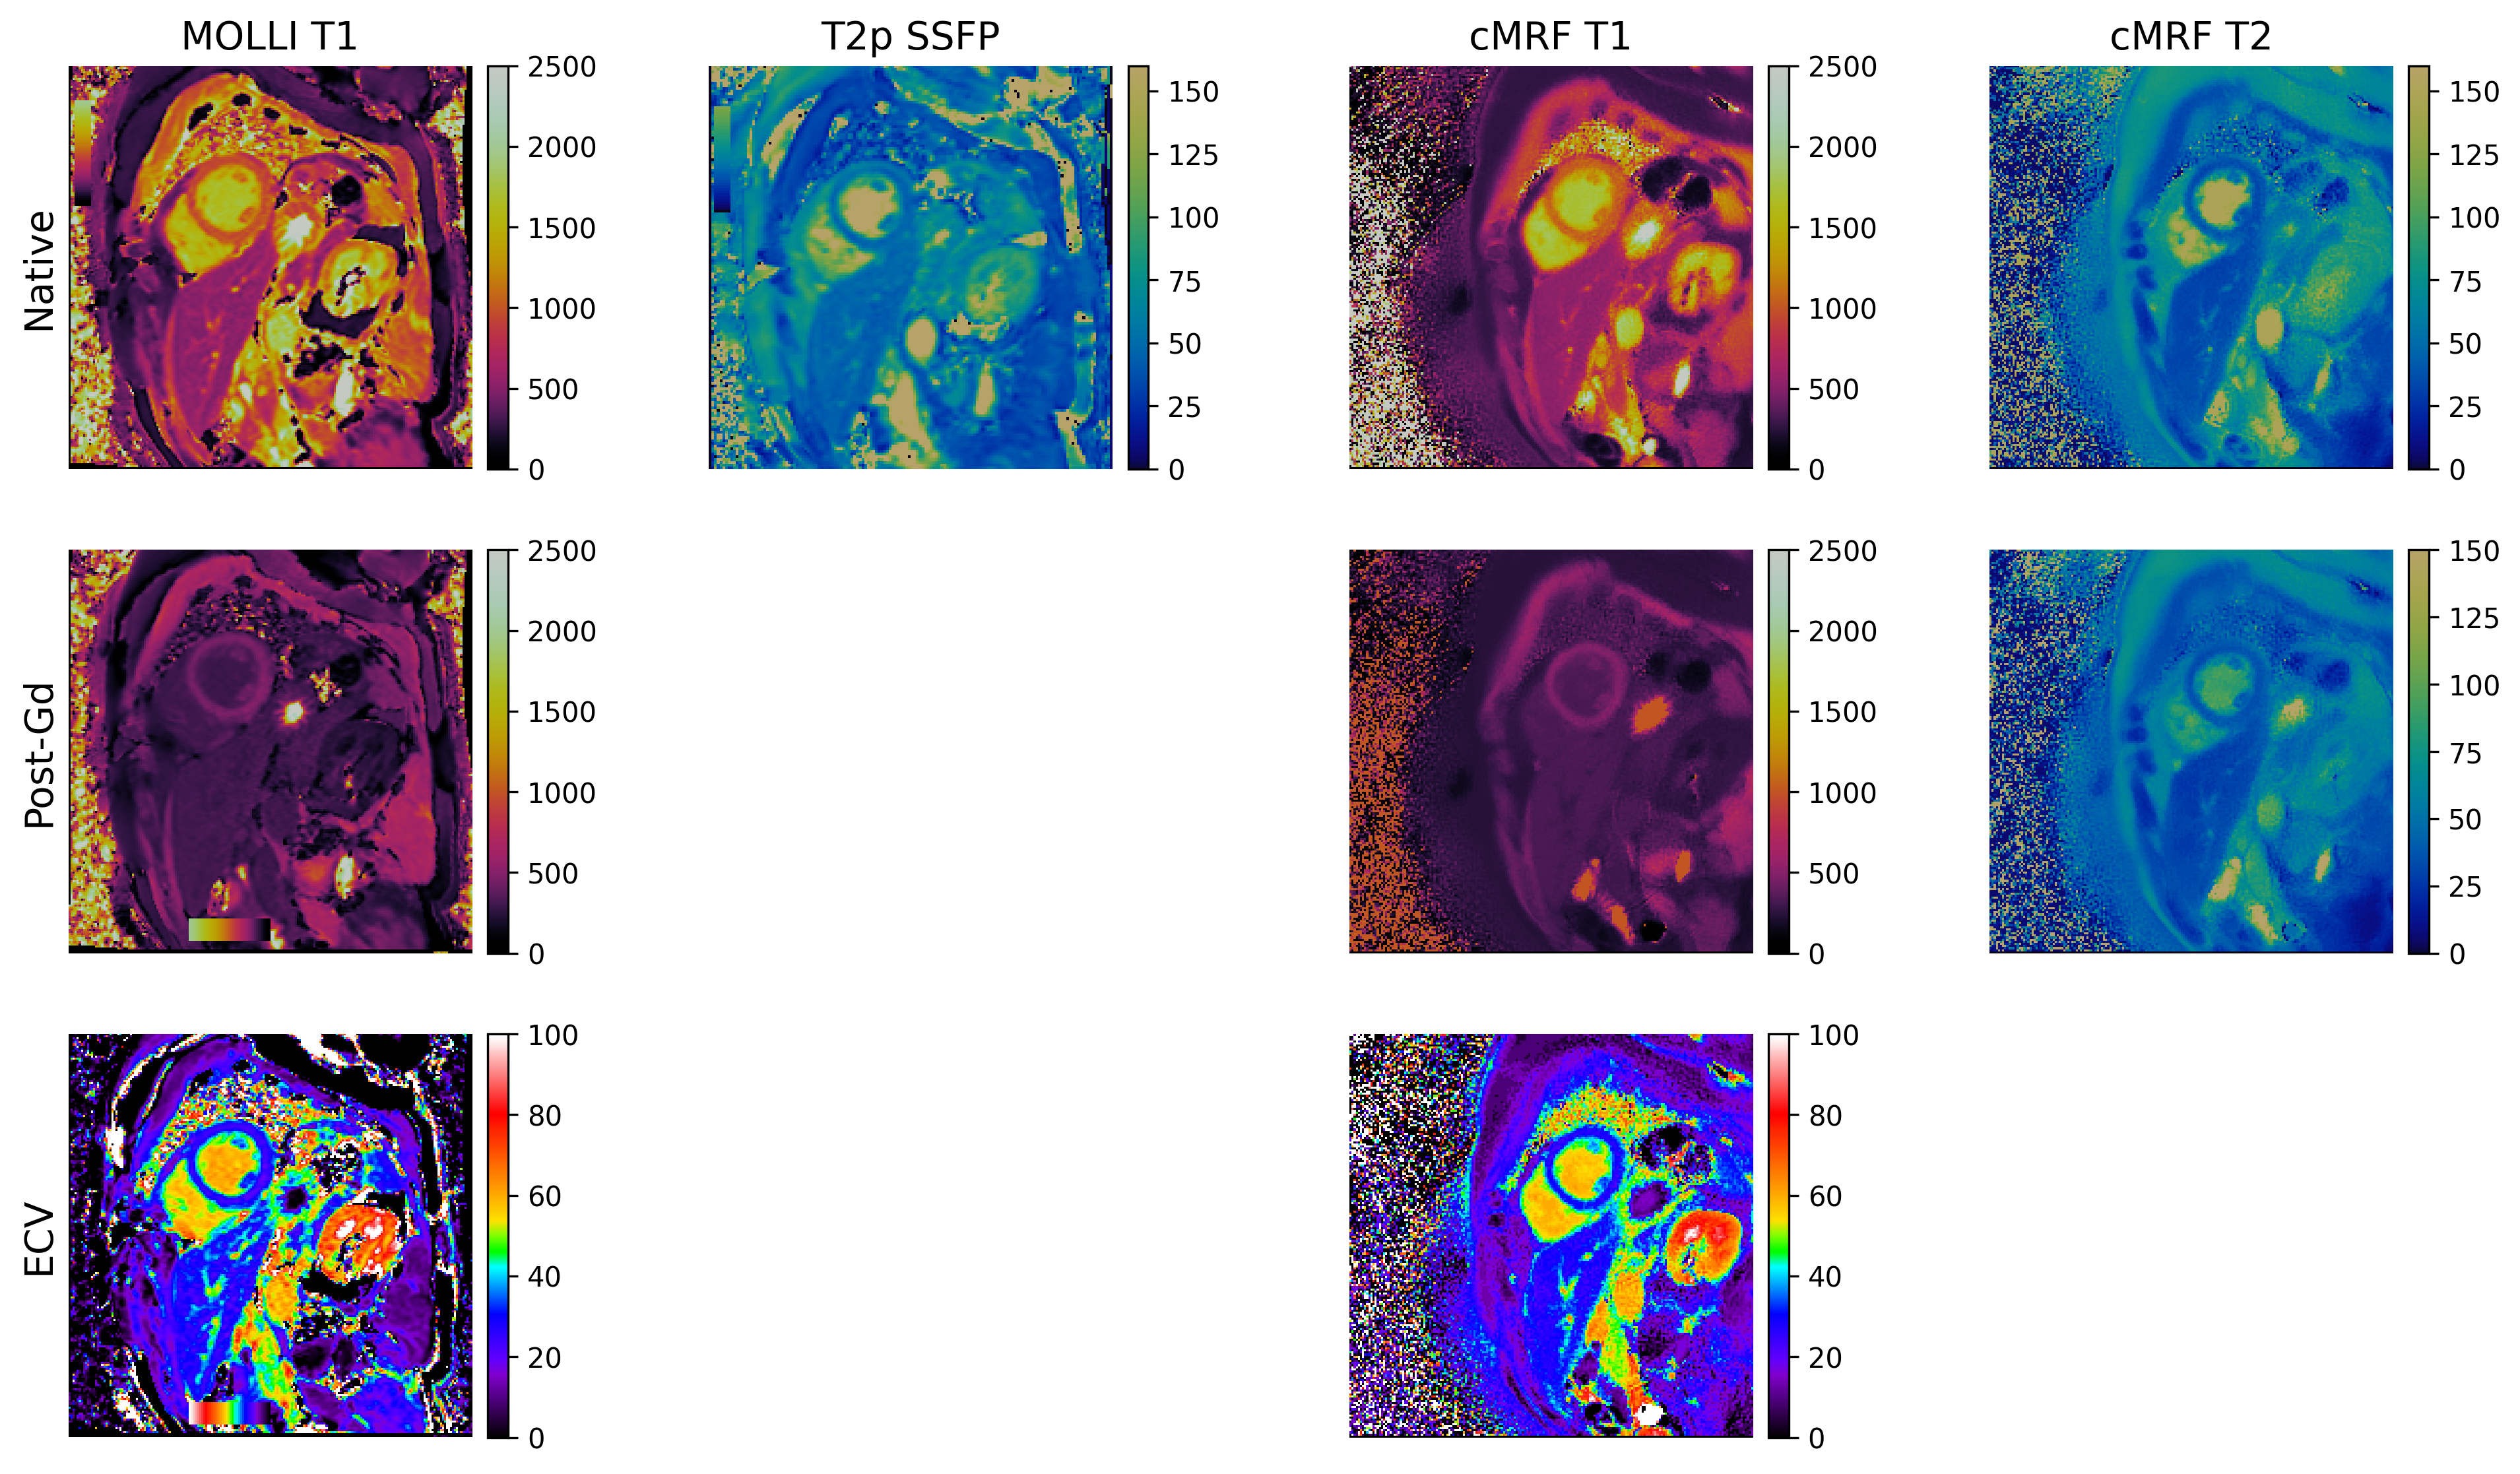
Figure 2. Representative images from one subject showing MOLLI T1-maps, T2p-SSFP T2-maps, cardiac MRF T1 and T2 maps as well as ECV maps calculated from both the MOLLI and cardiac MRF T1 values.