2362
Towards Prospective Free-Breathing Abdominal Magnetic Resonance Fingerprinting
Madison Kretzler1, Xinzhou Li2, Leonardo Kayat Bittencourt3,4, Mark Griswold1, and Rasim Boyacioglu1
1Radiology, Case Western Reserve University, Cleveland, OH, United States, 2MR R&D Collaborations, Siemens Medical Solutions USA, Inc., St. Louis, MO, United States, 3Radiology, University Hospitals Cleveland Medical Center, Cleveland, OH, United States, 4School of Medicine, Case Western Reserve University, Cleveland, OH, United States
1Radiology, Case Western Reserve University, Cleveland, OH, United States, 2MR R&D Collaborations, Siemens Medical Solutions USA, Inc., St. Louis, MO, United States, 3Radiology, University Hospitals Cleveland Medical Center, Cleveland, OH, United States, 4School of Medicine, Case Western Reserve University, Cleveland, OH, United States
Synopsis
Keywords: MR Fingerprinting/Synthetic MR, Liver, prospective, Free-breathing, Pilot tone
A Pilot Tone (PT) based comparison study is presented for abdominal free-breathing MRF using a previously validated PT extraction and vendor developed extraction methods. The initial steps towards prospective processing of the data for immediate availability of the free-breathing MRF quantitative maps on the console are demonstrated. In vivo comparison results for various free-breathing patterns are shown with consistent agreement between respiratory motion in PT extraction methods. Extraction of the respiration signal from PT via the vendor reconstruction software is the first step towards prospective free-breathing abdominal MRF.Introduction
Magnetic Resonance Fingerprinting (MRF)1 is a quantitative imaging framework for simultaneous mapping of multiple tissue properties. MRF in the abdomen is challenging due to motion, and breath-holds are preferred for 2D MRF. Recently, free-breathing abdominal MRF with Pilot Tone (PT)2-5 has been shown with retrospective extraction of the respiration signal from the raw data and offline reconstruction. In this abstract, we demonstrate initial steps towards prospective processing of the data for immediate availability of the free-breathing MRF maps on the console. PT signal extraction is carried out by the vendor (PT ICE) for future integrated prospective processing, in addition to previously validated PT extraction methods (PT PCA). Additionally, respiratory signals from the BioMatrix Respiratory Sensors (BRS) embedded in the scanner table were recorded. Respiration waveforms and quantitative maps using the BRS and two different PT extractions are compared.Methods
Acquisition:A breath-hold and four free-breathing MRF datasets with different breathing patterns were acquired from a volunteer after obtaining informed consent on a Siemens 3T MAGNETOM Vida (Siemens Healthcare, Erlangen, Germany) scanner. The volunteer was instructed to breathe normally, slower, faster, and with random variations of the first three cases but to keep their respiration amplitude stable. The 2D MRF sequence was a balanced SSFP variant with the following scan parameters: TR=8.6ms, FOV=450x450mm2, resolution=1.6x1.6x5mm3, 1758 time-points, 15.1s per single slice. For the free-breathing datasets 10 consecutive scans were performed in order to ensure sufficient respiratory data is collected for reconstruction. The time points from the 10 scans that belong to the end-inhalation state were extracted from the scanner table BRS and the PT signal for retrospective reconstruction.
PT:
The PT signal was implemented as a navigator for retrospective gating2,5. The function generator, which was synchronized to the 10MHz clock signal from the scanner, generated the constant RF PT signal positioned outside the image FOV. PT signals were encoded in the raw data through the receiver arrays (TIM body 18, spinal arrays, Siemens Healthcare).
PT PCA:
A 1D IFT was performed along the spiral readout direction and used to isolate/extract the index of the motion embedded PT signal. Principal Component Analysis (PCA) was applied to the PT signals extracted from all coils. The PT navigator was automatically selected from the principal component containing the most relative power in the respiratory motion frequency band2,5.
PT ICE:
A postprocessing functor based on Image Calculation Environment (ICE) of the Siemens Healthcare platform was created to detect respiratory motion by extracting the PT signal from the k-space data. PT indexes on each line of the k-space after Fourier transform was automatically detected based on the signal frequency shift. A sinusoidal model-based signal fitting and principle component analysis (PCA) was then performed on the PT signal from each channel to estimate the respiratory motion4,6.
Reconstruction:
The two PT navigators and the corresponding BRS data were normalized and thresholded in order to gather a window of accepted data points (~3000) for the end-inhalation state for each of the waveforms. An iterative low-rank reconstruction with pattern matching and quadratic interpolation was implemented for both the breath-hold and free-breathing with PT scans. The qRF-MRF dictionary was generated using Bloch simulations with combinations of signal evolutions consistent with T1 in a range of 10-5000ms, T2 and T2* in a range of 2-2000ms, and off-resonance in a range of -58Hz to 58Hz.
Results
Figures 1-4 show the three respiratory waveforms that were recorded/extracted from the BRS, PT PCA, and PT ICE processes as well as the breath-held and free-breathing 2D axial T1 and T2 maps for normal, slow, fast, and random breathing patterns.Discussion
The three waveforms broadly agree for all the breathing cases. However, there’s a better match of the PT PCA and PT ICE waveforms for the slow and fast case possibly due to the narrow and stable frequency spectrum throughout. This similarity is also reflected in the T1 and T2 maps for PT PCA and PT ICE for the slow and fast cases. They deviate more from each other for random and normal cases. There’s a slowly varying amplitude component in the PT ICE visible in the normal free breathing case. This could be due to the separation of the DC-like drift components from the physiological signals with PT PCA. Both PT ICE and PT PCA suffer when there’s amplitude modulation (due to shallow or deep breathing) as these points do not contribute to the time points for the reconstruction with the applied global thresholding.Conclusion
Extraction of the respiration signal from PT via the vendor reconstruction software is the first step towards prospective free-breathing abdominal MRF. The similarity of the PT PCA and PT ICE both in the respiration waveforms and the quantitative maps suggest that the PT processing functor (PT ICE) could be combined with the existing reconstruction pipeline for an online implementation of the free-breathing abdominal MRF.Acknowledgements
This study is supported by Siemens Medical Solutions USA and NIH Grant R01CA266702.References
- Ma D, Gulani V, Seiberlich N, Liu K, Sunshine JL, Duerk JL, Griswold MA. Magnetic resonance fingerprinting. Nature. 2013 Mar 14;495(7440):187-92. doi: 10.1038/nature11971. PMID: 23486058; PMCID: PMC3602925.
- Huang SS, Boyacioglu R, Bolding R, MacAskill C, Chen Y, Griswold MA. Free-Breathing Abdominal Magnetic Resonance Fingerprinting Using a Pilot Tone Navigator. J Magn Reson Imaging. 2021 Oct;54(4):1138-1151. doi: 10.1002/jmri.27673. Epub 2021 May 5. PMID: 33949741.
- Ludwig J, Speier P, Seifert F, Schaeffter T, Kolbitsch C. Pilot tone-based motion correction for prospective respiratory compensated cardiac cine MRI. Magn Reson Med. 2021 May;85(5):2403-2416. doi: 10.1002/mrm.28580. Epub 2020 Nov 23. PMID: 33226699.
- Vahle T, Bacher M, Rigie D, Fenchel M, Speier P, Bollenbeck J, Schäfers KP, Kiefer B, Boada FE. Respiratory Motion Detection and Correction for MR Using the Pilot Tone: Applications for MR and Simultaneous PET/MR Examinations. Invest Radiol. 2020 Mar;55(3):153-159. doi: 10.1097/RLI.0000000000000619. PMID: 31895221; PMCID: PMC7039314.
- Huang S, Chen Y, Bolding R, Kayat Bittencourt L, Griswold MA, Boyacioglu R. Free Breathing Abdominal Tissue Quantification using 2D MR Fingerprinting with quadratic RF phase (qRF-MRF). In: ISMRM 2022; London.
- Solomon E, Rigie DS, Vahle T, Paška J, Bollenbeck J, Sodickson DK, Boada FE, Block KT, Chandarana H. Free-breathing radial imaging using a pilot-tone radiofrequency transmitter for detection of respiratory motion. Magn Reson Med. 2021 May;85(5):2672-2685. doi: 10.1002/mrm.28616. Epub 2020 Dec 11. PMID: 33306216; PMCID: PMC7902348.
Figures
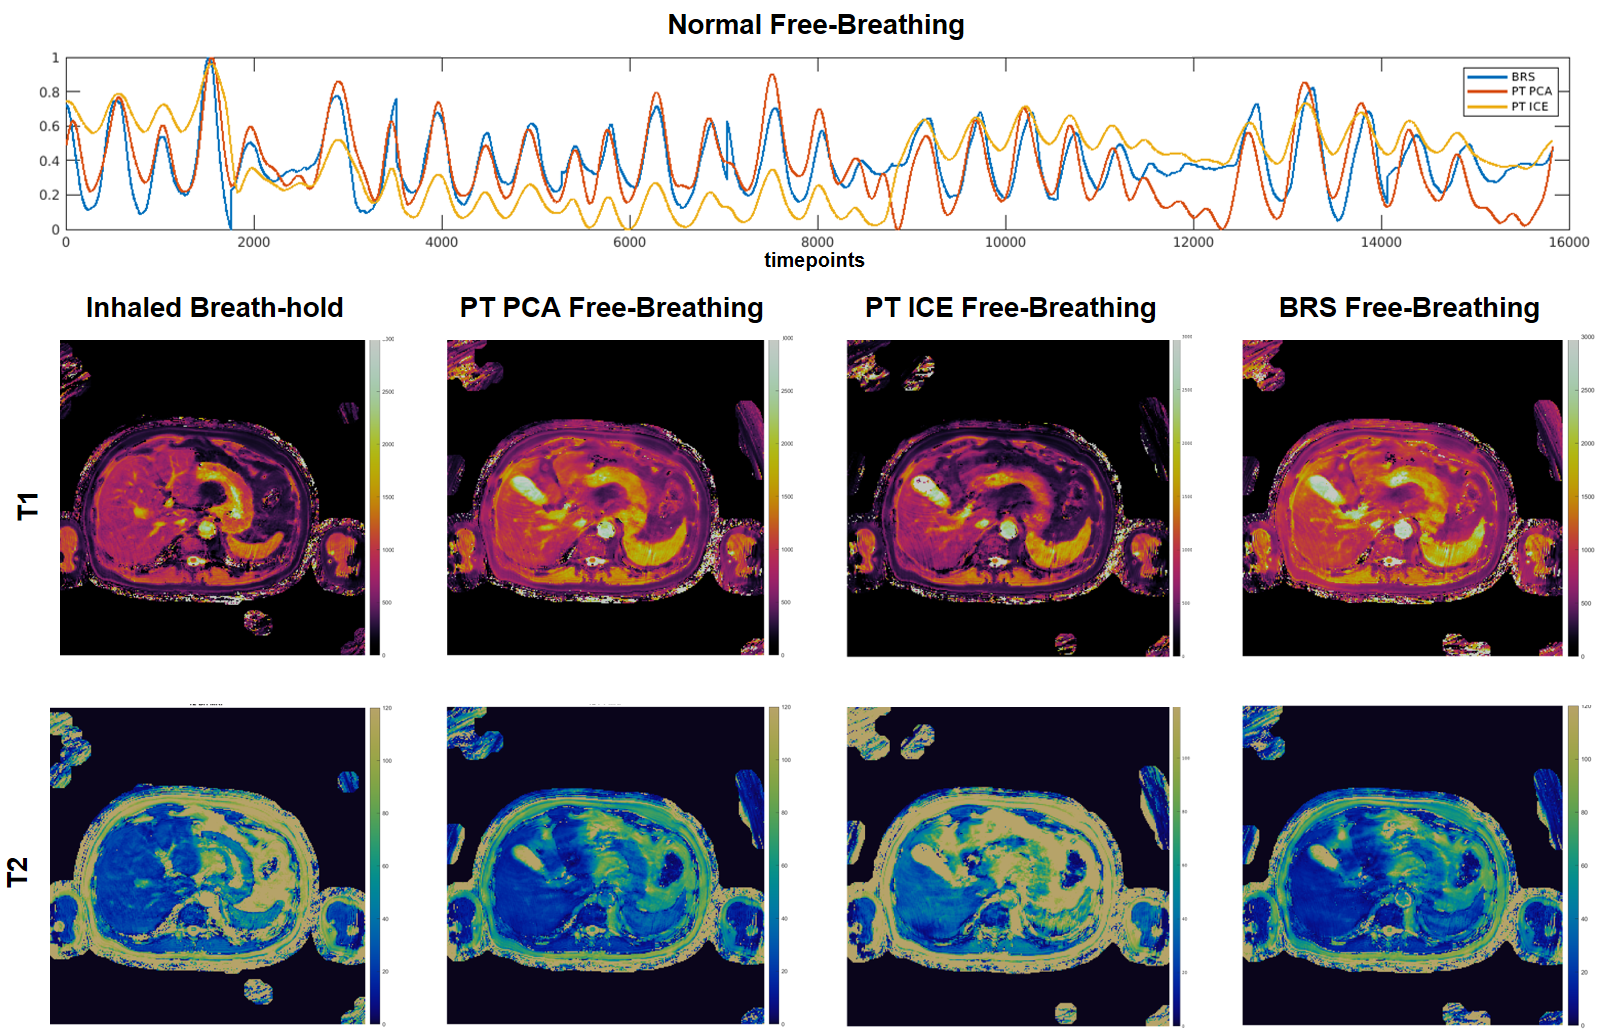
Figure 1: (top) Respiratory waveforms for BRS (blue), PT PCA (red), PT ICE (yellow) plotted together for the normal free-breathing case. BRS and PT PCA waveforms show consistent agreement. The PT ICE waveform indicates the same peak locations; however, contains an amplitude bias throughout. Resulting 2D axial T1 maps (middle) and T2 maps (bottom) of the inhaled breath-hold, PT PCA, PT ICE, and BRS free-breathing show consistent slice position agreement across methods with a slight difference for PT ICE.
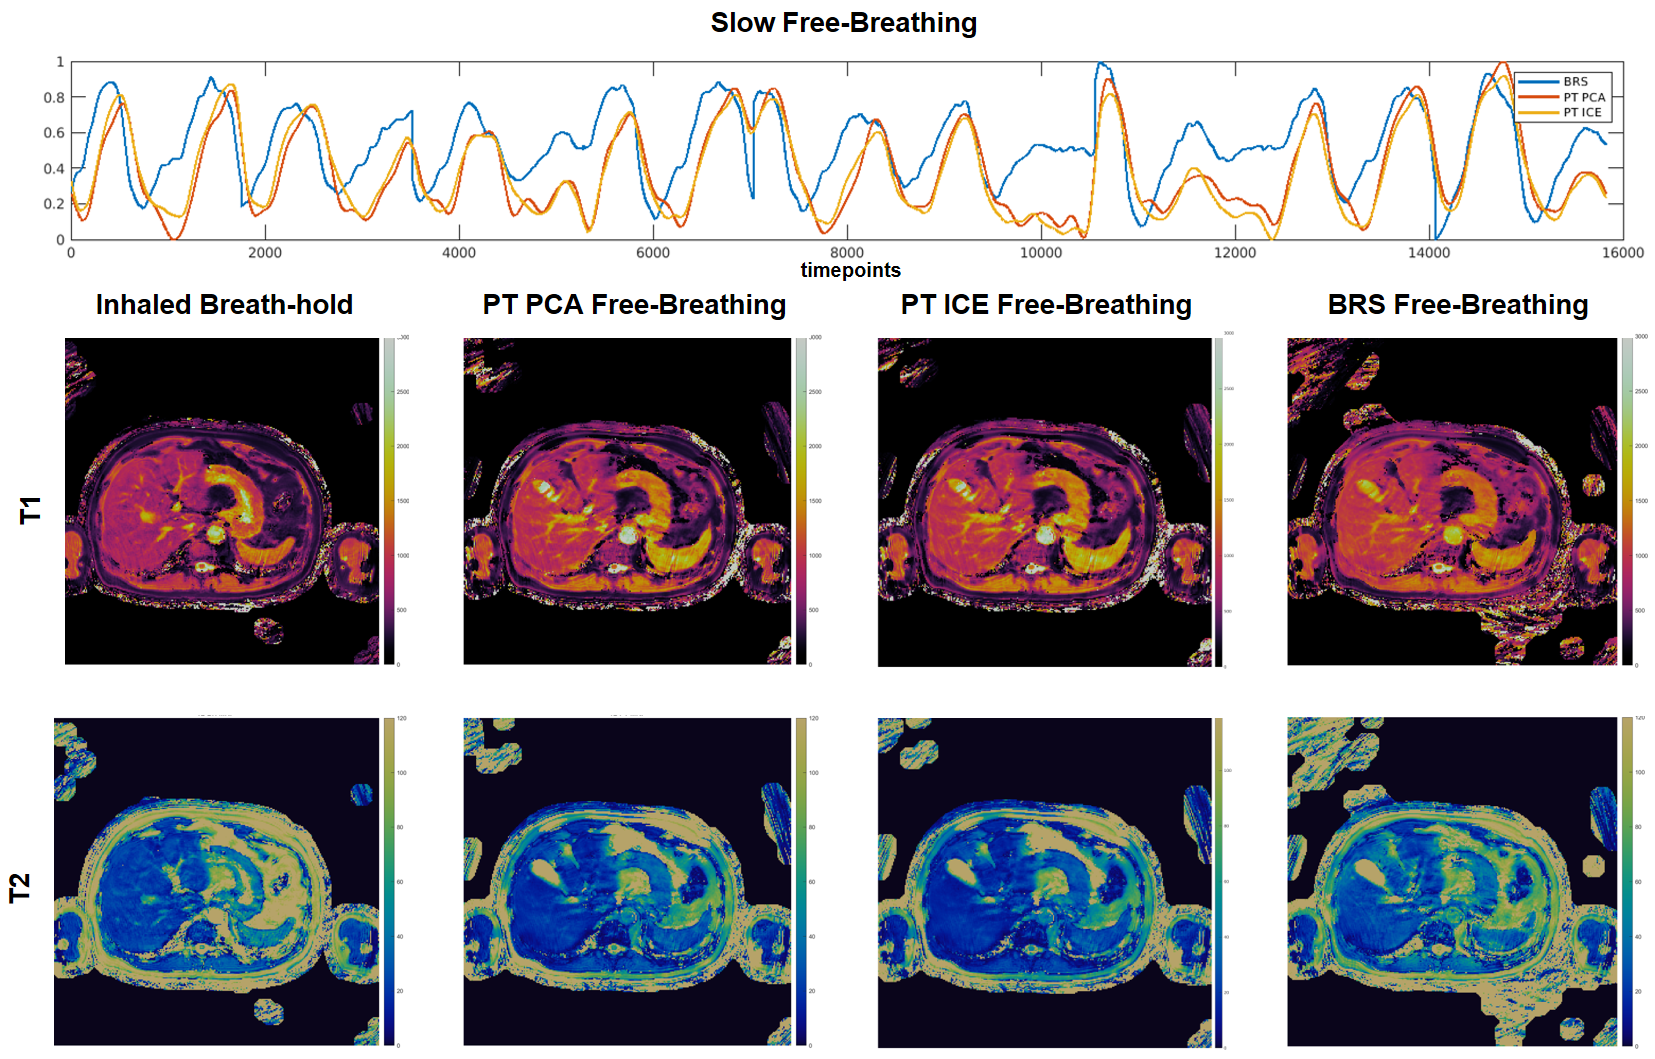
Figure 2: (top) Respiratory waveforms for BRS (blue), PT PCA (red), PT ICE (yellow) plotted together for the slow free-breathing case.The PT PCA and ICE waveforms show broad agreement throughout the scan. The BRS signal, while showing similar peak locations, appears slightly shifted in time. However, the resulting 2D axial T1 maps (middle) and T2 maps (bottom) of the inhaled breath-hold, PT PCA, PT ICE, and BRS free-breathing (from left to right) show consistent slice position agreement across methods.
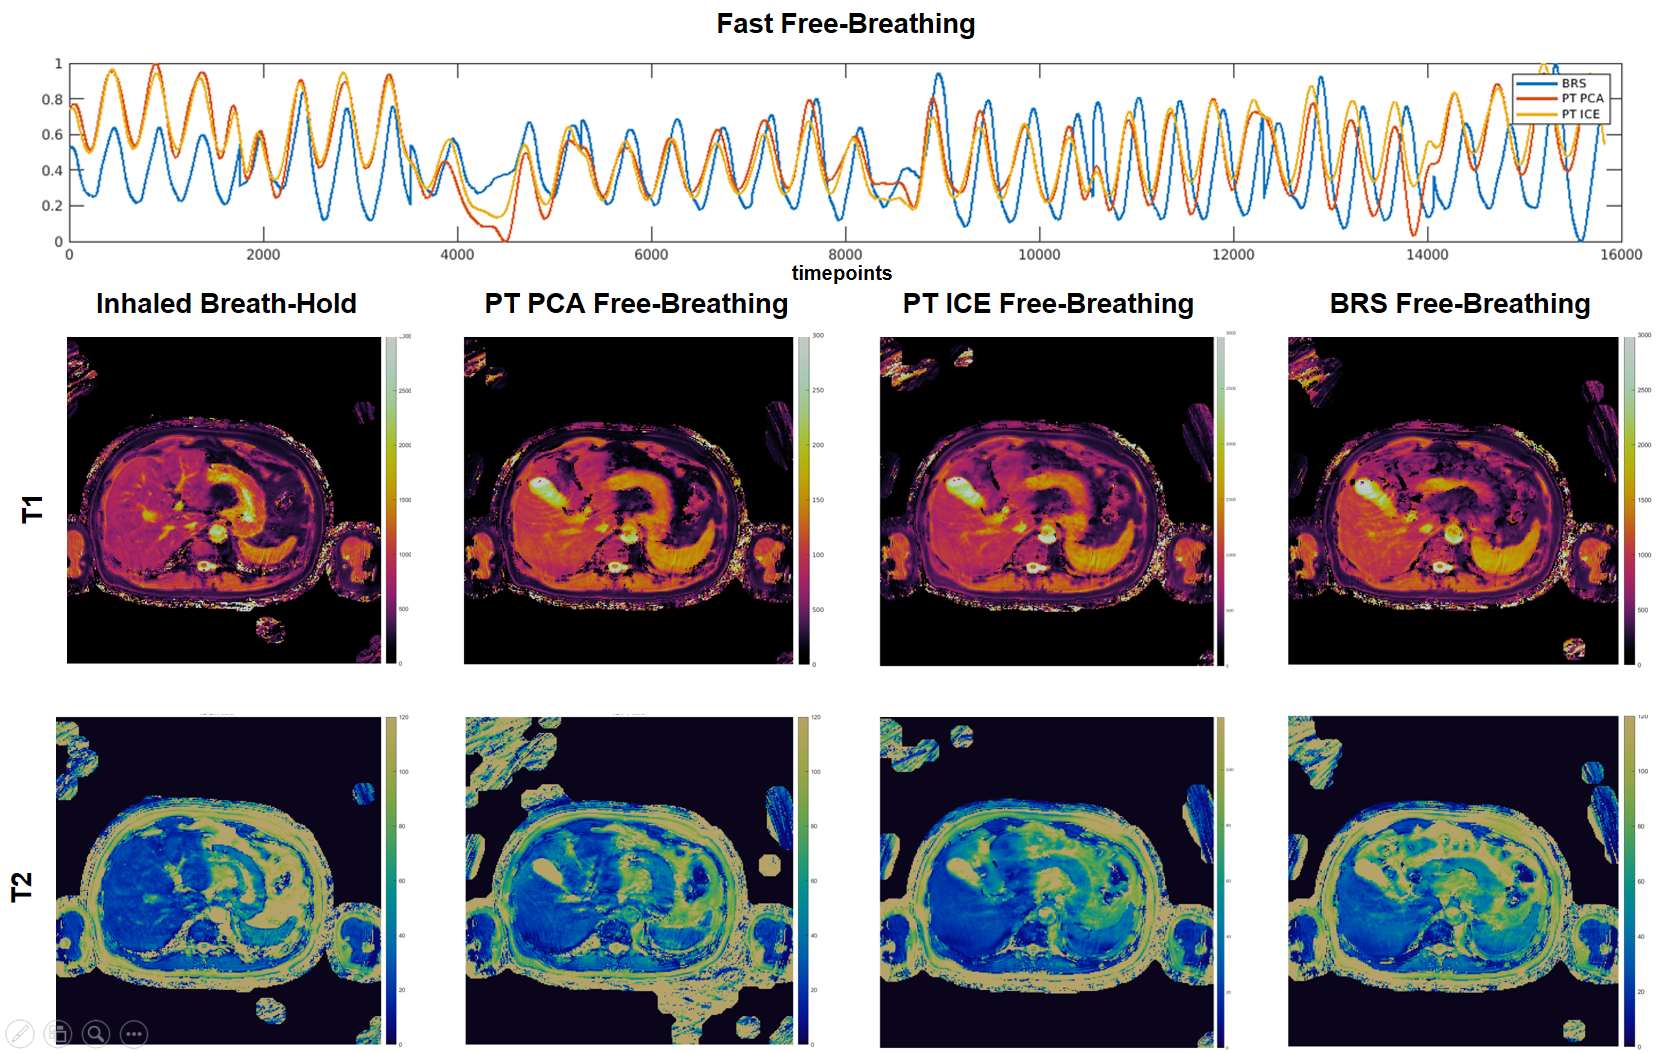
Figure 3: (top) Respiratory waveforms for BRS (blue), PT PCA (red), PT ICE (yellow) plotted together for the fast free-breathing case. All waveforms show agreement in peak locations with a slight deviation of amplitude between PT waveforms and BRS at the beginning and end. PT PCA and ICE waveforms are nearly identical. Resulting 2D axial T1 maps (middle) and T2 maps (bottom) of the inhaled breath-hold, PT PCA, PT ICE, and BRS free-breathing show consistent slice position agreement.
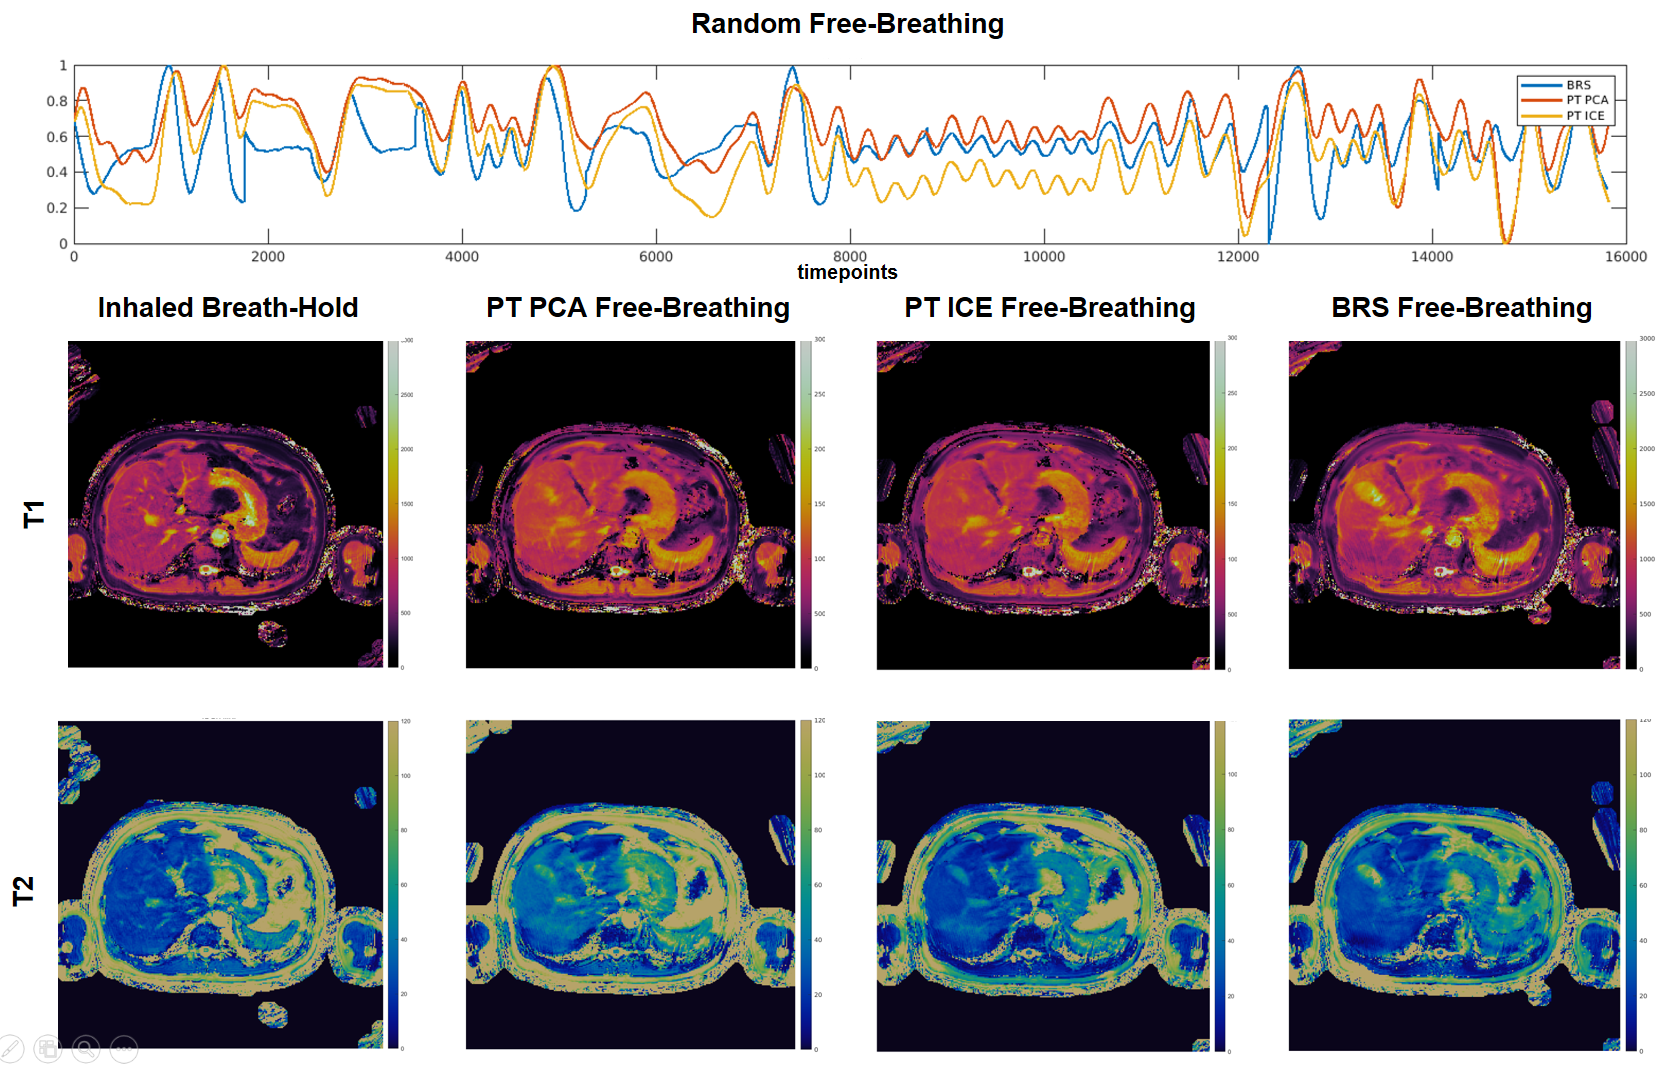
Figure 4: (top) Respiratory waveforms for BRS (blue), PT PCA (red), PT ICE (yellow) plotted together for the random free-breathing case. All three waveforms show similar peak agreement throughout the scan with a slight deviation in amplitudes. The resulting 2D axial T1 maps (middle) and T2 maps (bottom) of the inhaled breath-hold, PT PCA, PT ICE, and BRS free-breathing show consistent slice position agreement.
DOI: https://doi.org/10.58530/2023/2362