2359
MR Vascular Fingerprinting with 3D realistic blood vessel structures and machine learning to assess oxygenation changes in human volunteers1Univ. Grenoble Alpes, INSERM U1216, Grenoble Institut Neurosciences, GIN, Grenoble, France, 2Biomedical Engineering, University of California Davis, Davis, CA, United States, 3Department of Radiology, Stanford University, Stanford, CA, United States
Synopsis
Keywords: MR Fingerprinting/Synthetic MR, Oxygenation
The MR vascular fingerprinting (MRvF) approach extends the concept of MR fingerprinting to the study of microvascular properties and functions. Encouraging results have been obtained in healthy human volunteers as well as in stroke and tumor models in rats. However, it has been suggested that the method has a low sensitivity to blood oxygenation measurements. We improved the MRvF approach by using simulations with 3D realistic blood vessels from animal microscopy, new fingerprint-pattern organization and machine learning tools. The method was tested in retrospective data acquired in healthy-human volunteers while breathing different gas mixtures (Hyperoxia (100%O2), Normoxia (21%O2), hypoxia (14%O2)).Introduction
MR vascular Fingerprinting1 (MRvF) uses the MR Fingerprinting2 framework to measure vascular properties such as Blood Volume fraction (BVf), mean vessel radius (R) and blood oxygen saturation (SO2). The MR signal evolution (Free Induction Decay + Spin echo=fingerprint) is sampled in each voxel and compared to a dictionary of curves obtained using numerical simulations of the same experiment. Encouraging results have been obtained in healthy human volunteers1 as well as in stroke and tumor models in rats3 when 2D cylinders were used as surrogates of blood vessels during dictionary generation. However, it has also been shown that this initial method has a low sensitivity to blood oxygenation measurements and that better rearrangements of the fingerprint patterns as well as simulations with realistic vascular networks can improve these estimates in rodents4. In the present study, we tested this new MRvF approach in retrospective data5 acquired in healthy human volunteers while breathing different gas mixtures (Hyperoxia (100%O2), Normoxia (21%O2), hypoxia (14%O2)).Materials and Methods
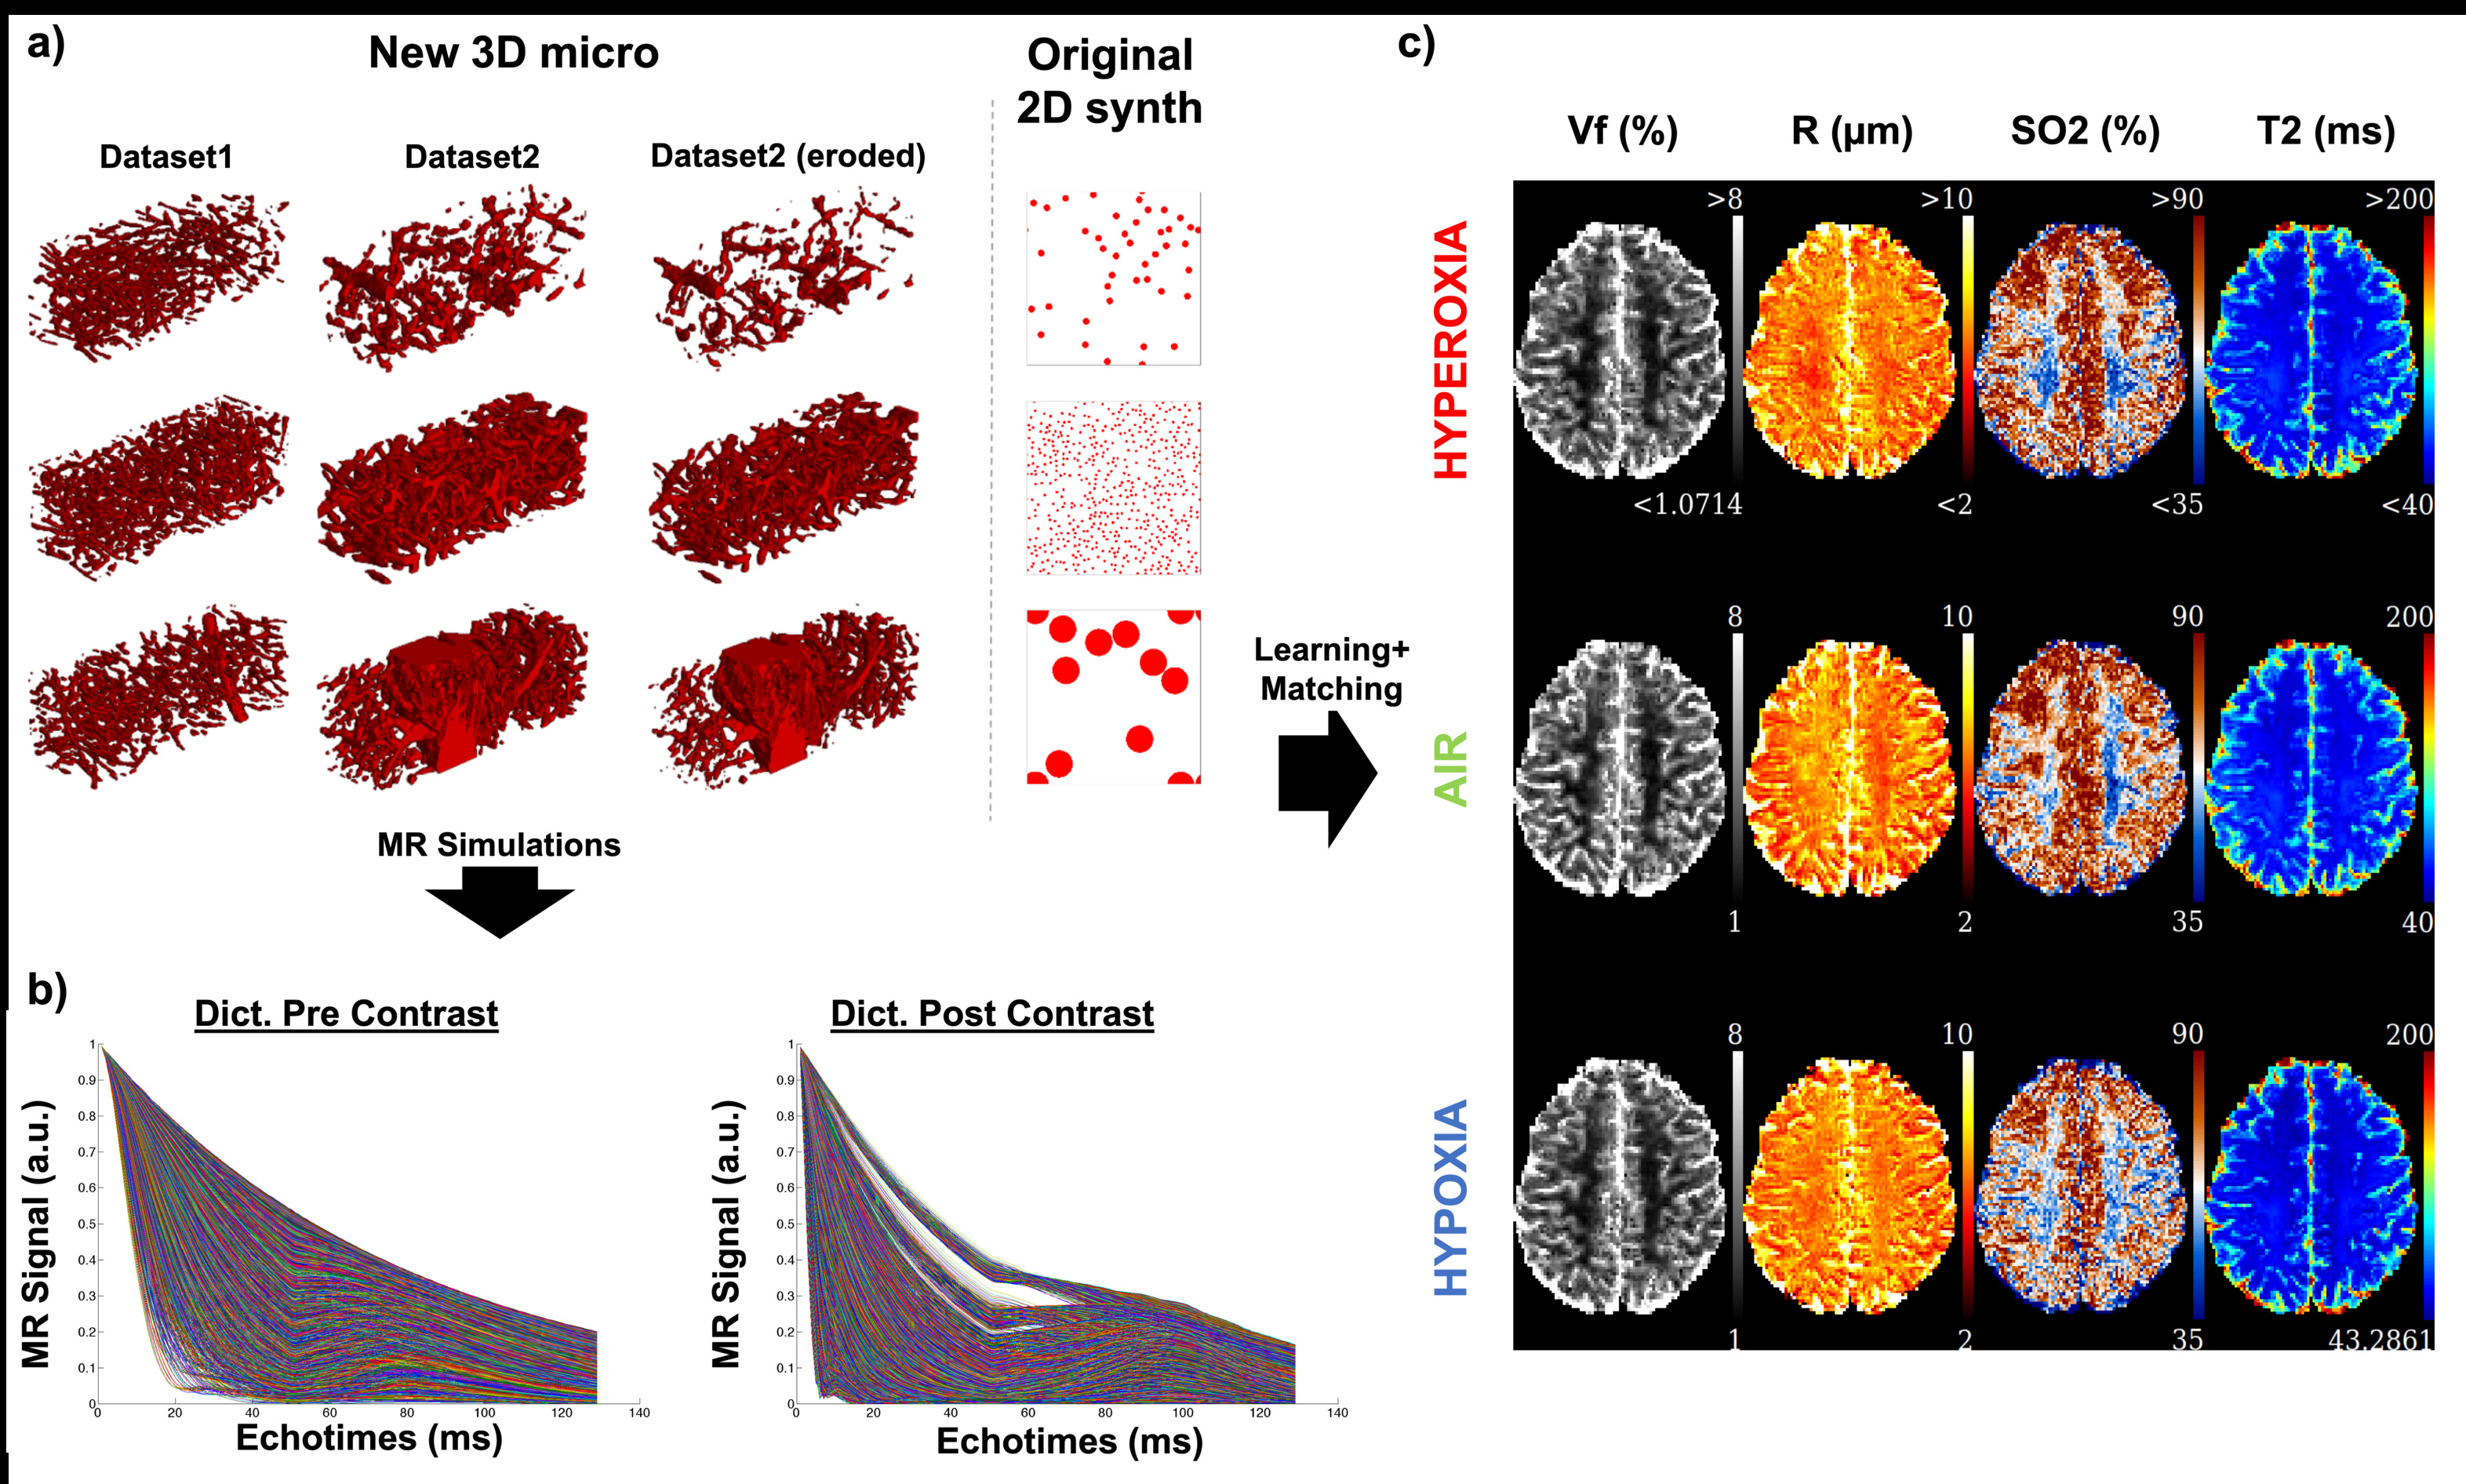
Data: The local IRB committee approved all studies. Experiments were performed at 3T (GE Healthcare Systems, Waukesha, WI) with an 8-channel GE receive-only head coil. The MR acquisition protocol included a GESFIDE sequence for fingerprinting (TR=2000ms, 40echoes, SE=100ms, FOV=20*20cm, ST=1.5mm, 128*128, 12slices, Tacq=4min). 10 volunteers were scanned while breathing different gas mixtures (Hyperoxia (100%O2), Normoxia (21%O2), hypoxia (14%O2)). Each epoch lasted 6 minutes and acquisitions started after 1 min to ensure stable gas environment and subject physiology. The protocol was repeated after intravenous injection of Feraheme (off label contrast agent, 7 mg Fe/kg, AMAG Pharmaceuticals Inc., Cambridge, MA, USA). Here, the concatenation of the GESFIDE acquisitions pre-and post contrast was taken as ‘vascular fingerprint’ 4.Dictionary generation: Around 28,000 MRI-size voxels containing realistic vascular structures were extracted from whole brain high resolution (3microns isotropic) rodent microscopy datasets6-7 using ImageJ (Rasband, WS, NIH, Maryland, USA). Erosion transformations were performed to obtain continuous Vf and R distributions (Fig.2a). The original MRvF 2D geometry is also presented for comparison. After assigning to each voxel one SO2 and one T2 value in the range (35-90%) and (45-300ms), respectively, MR simulations including magnetic field estimation and water diffusion were performed to create the ‘3D micro’ dictionary (Fig.2b).
Reconstruction: All data were processed with Matlab using the MP3 software8. A dictionary learning tool9 was used in order to generalize the results and allow a better translation from animal to human vascular structures. Gray and White matter ROIs were defined using T1w images and paired student’s tests were used to assess the significance of distributions difference, with a p-value of 5%.
Results
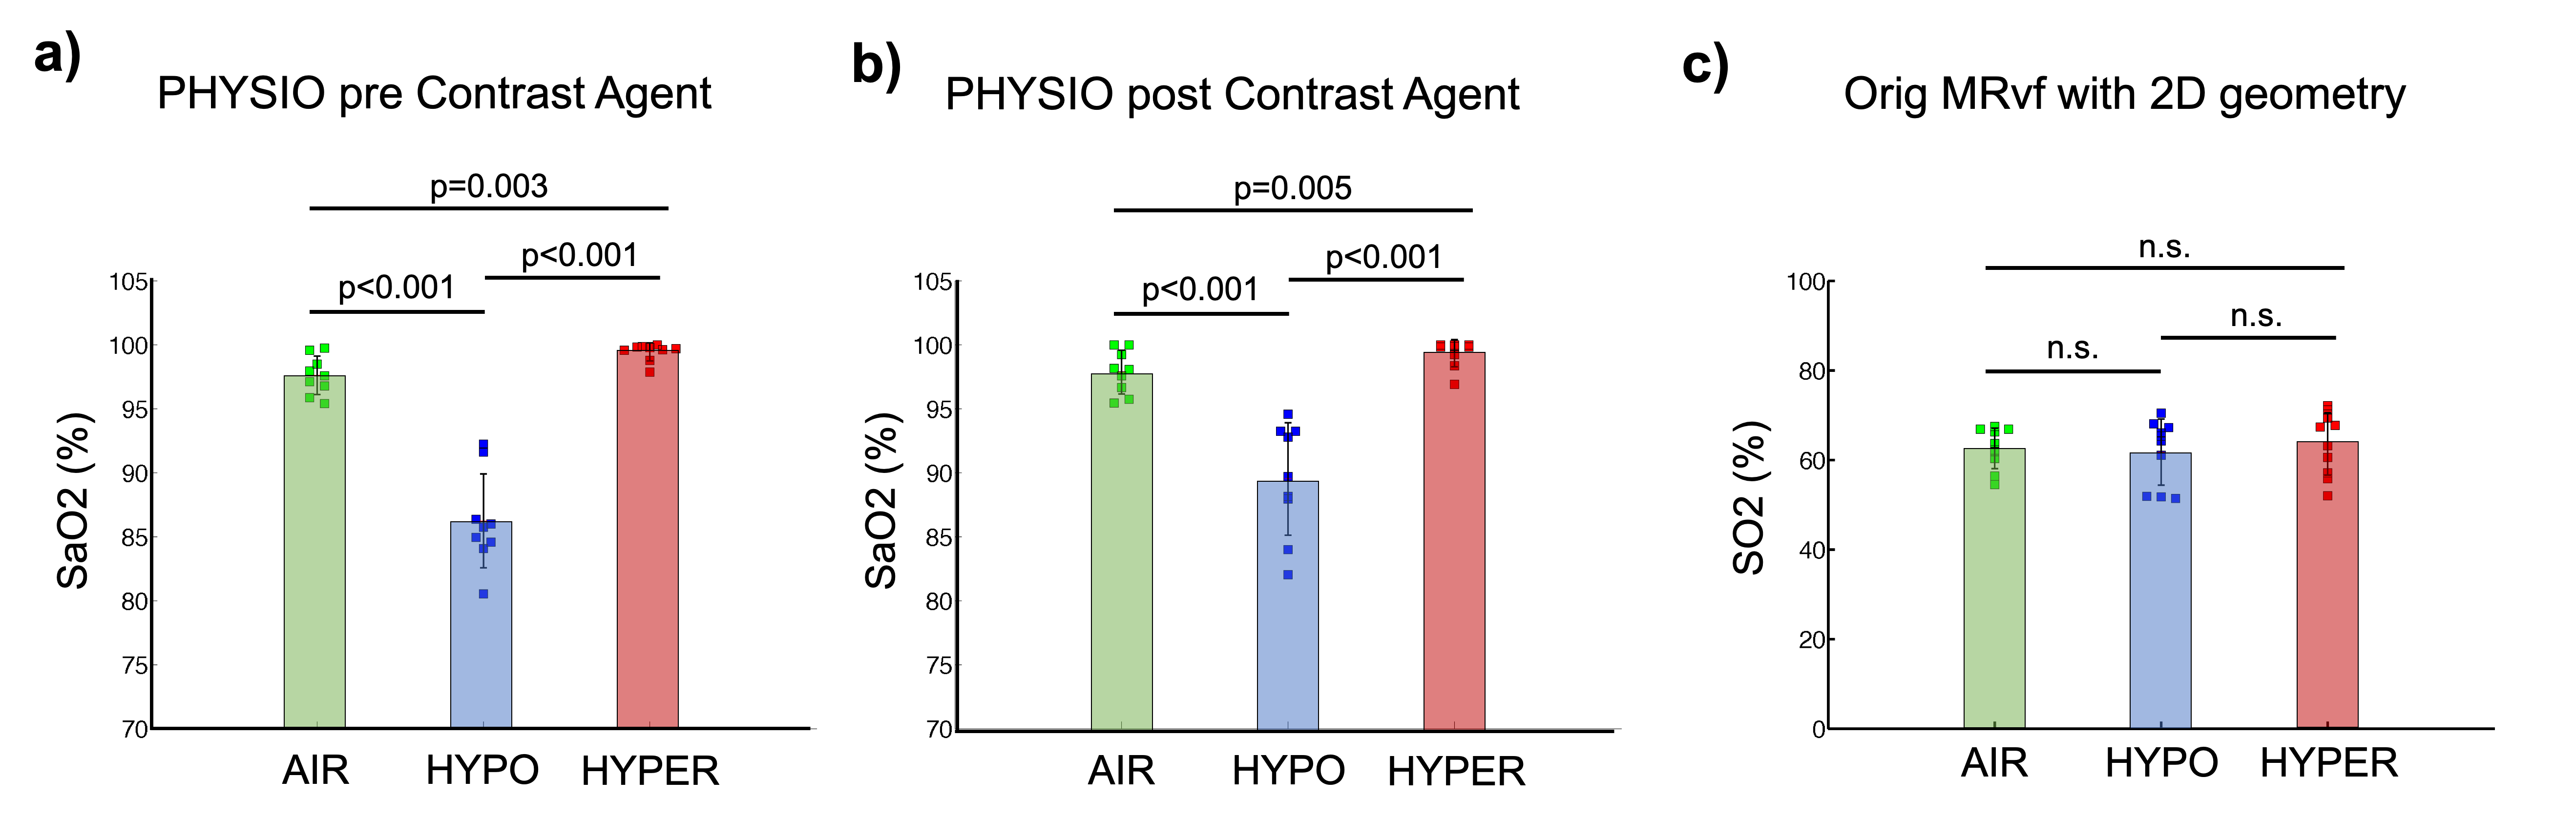
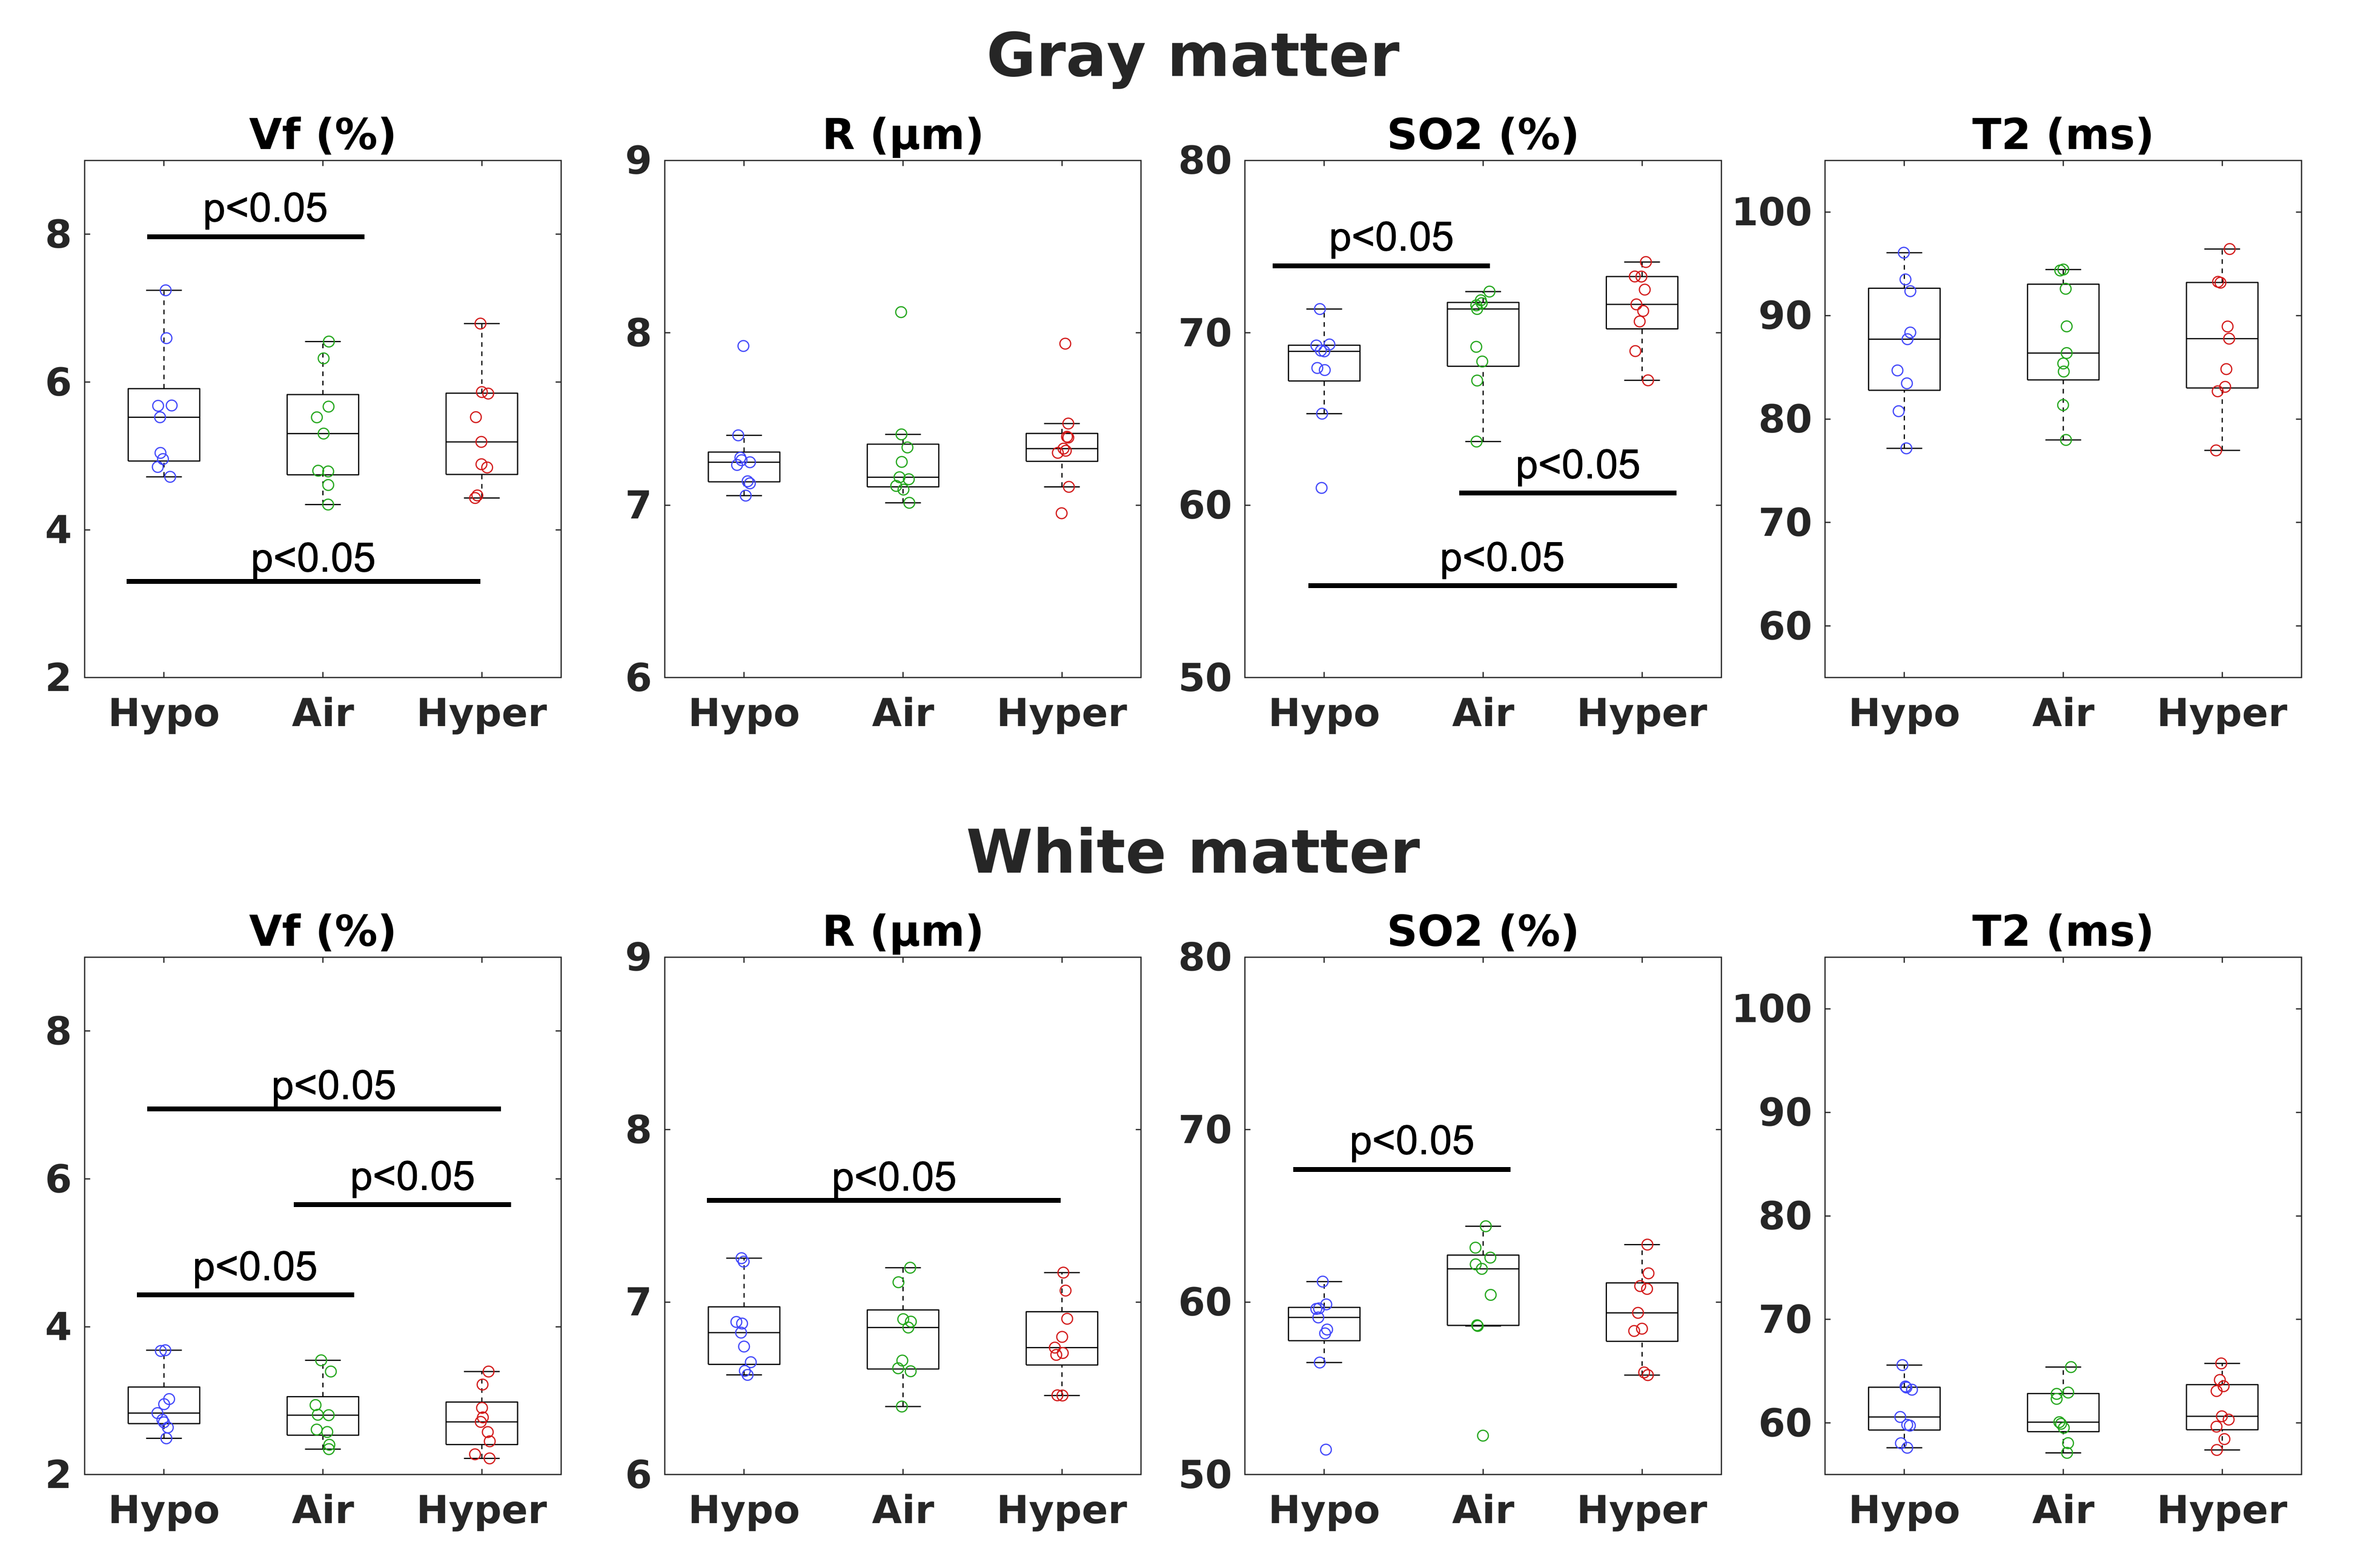
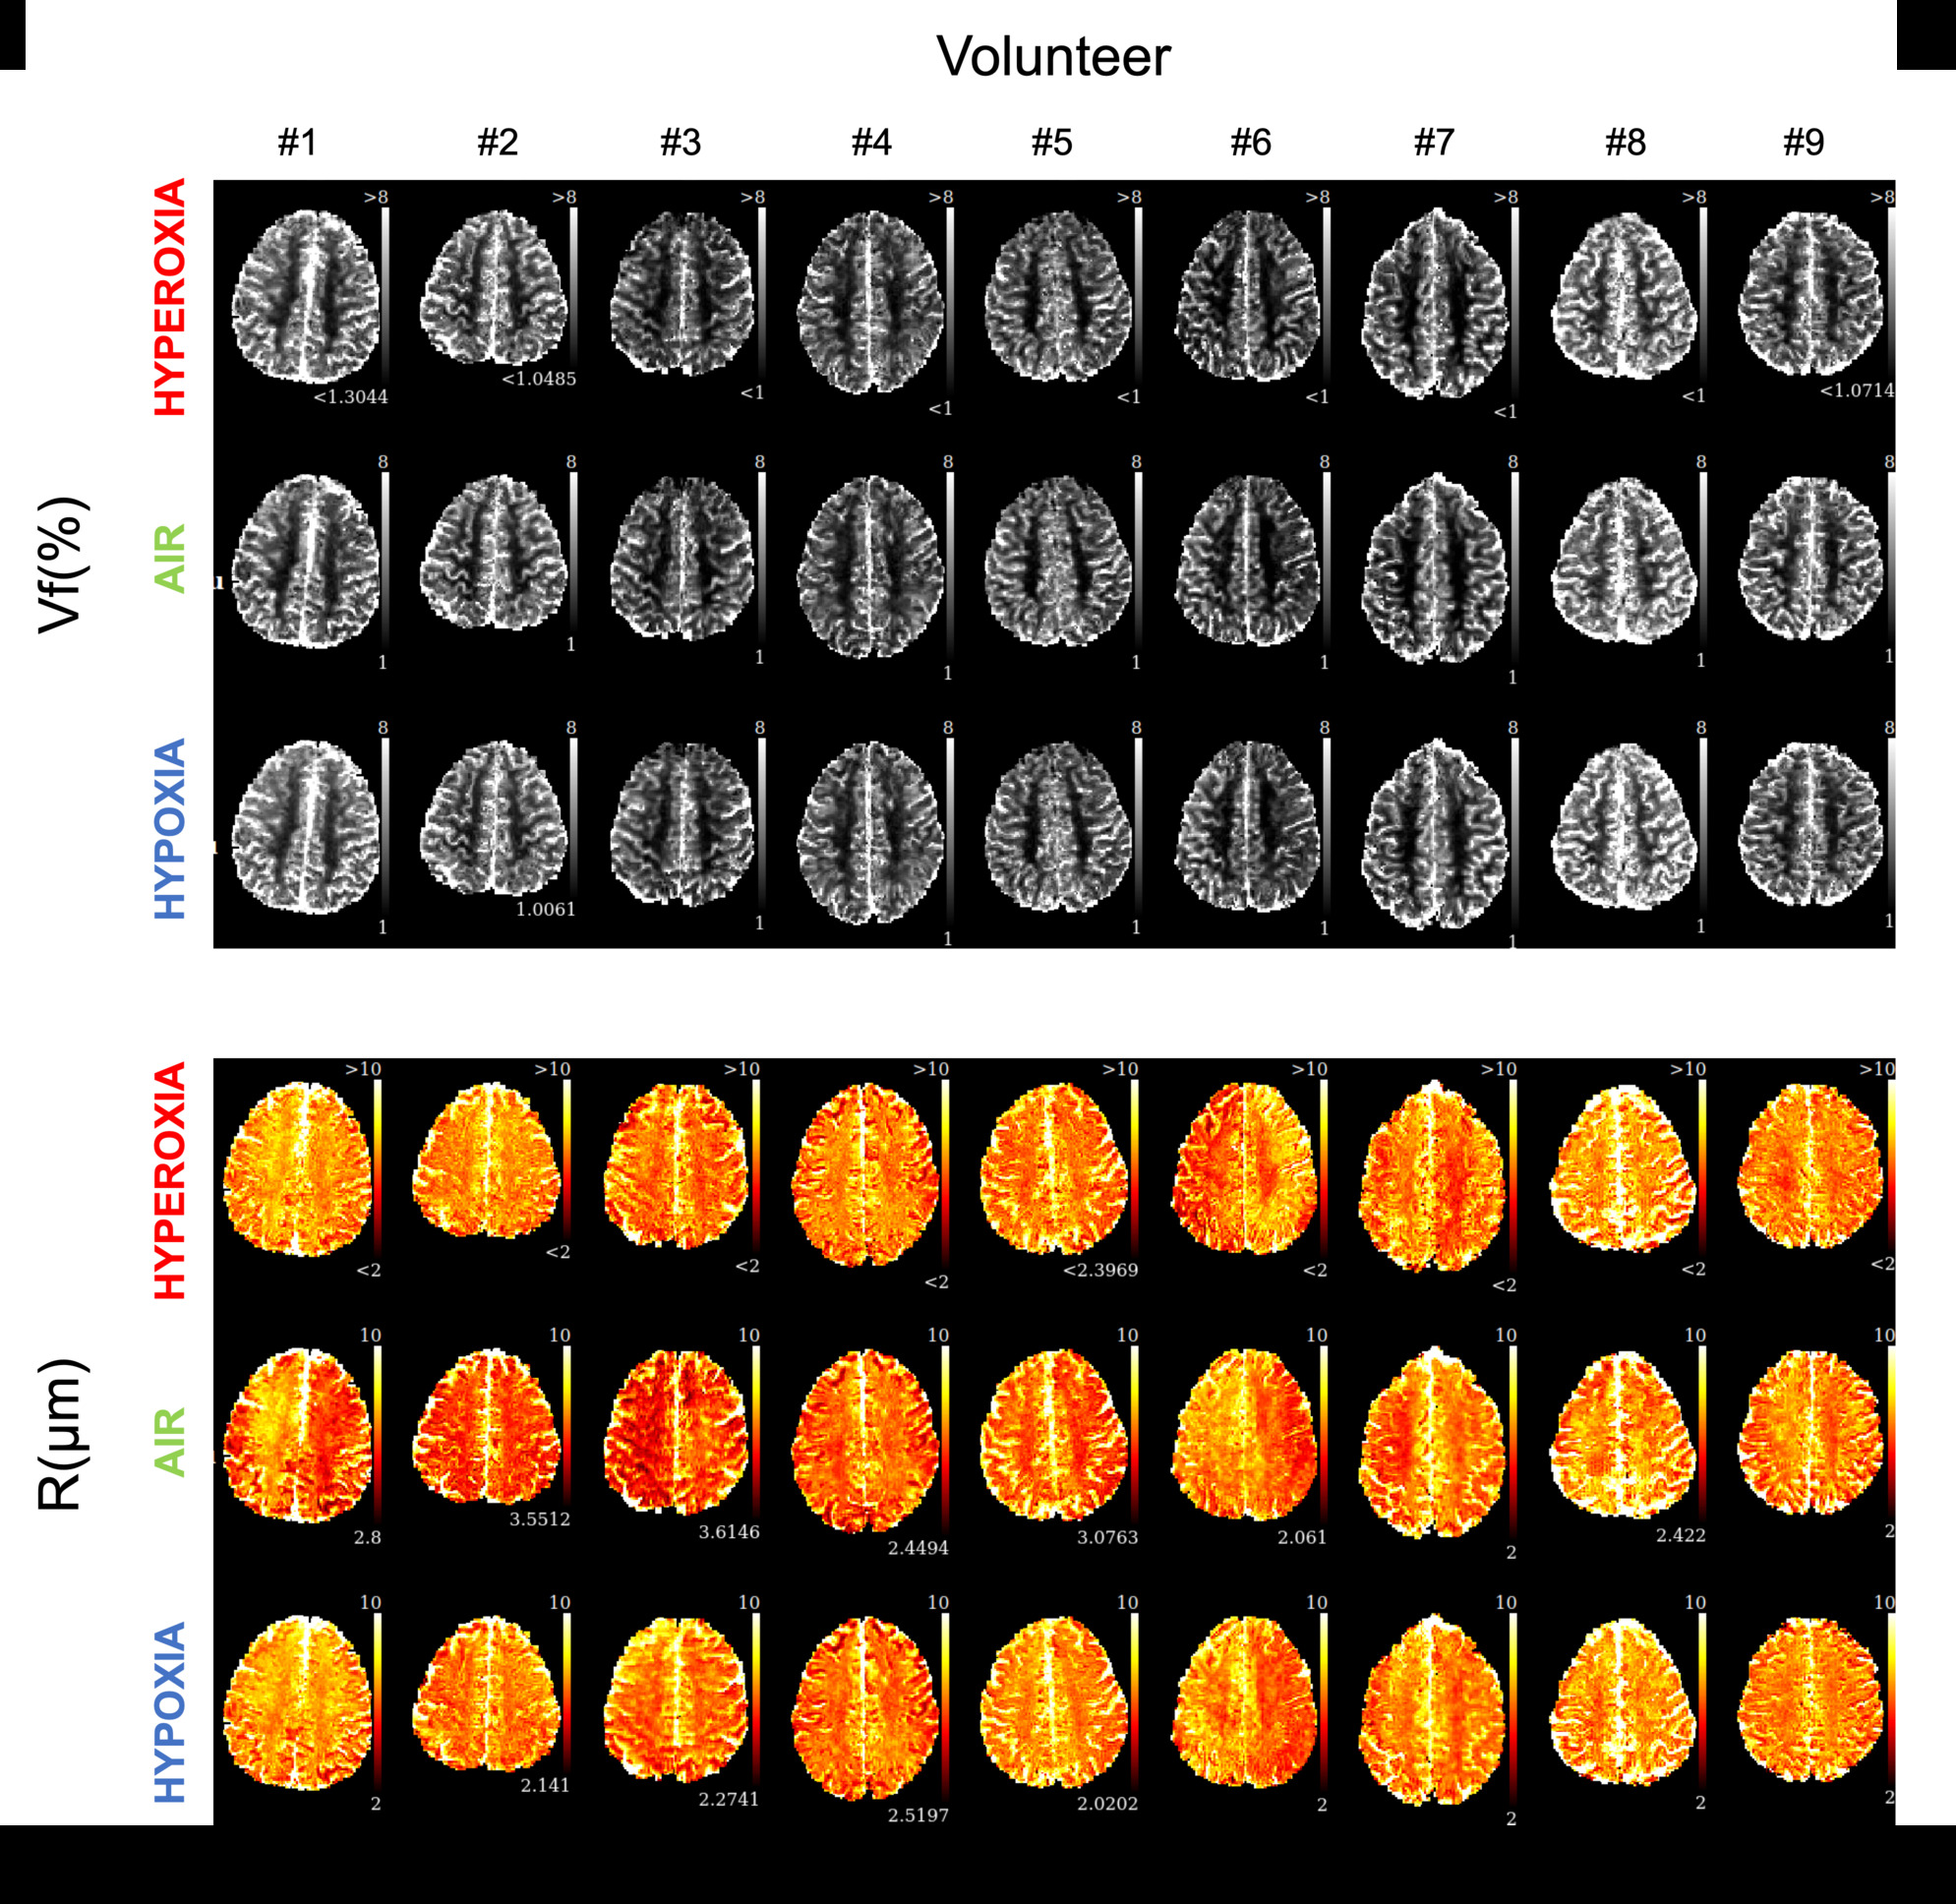
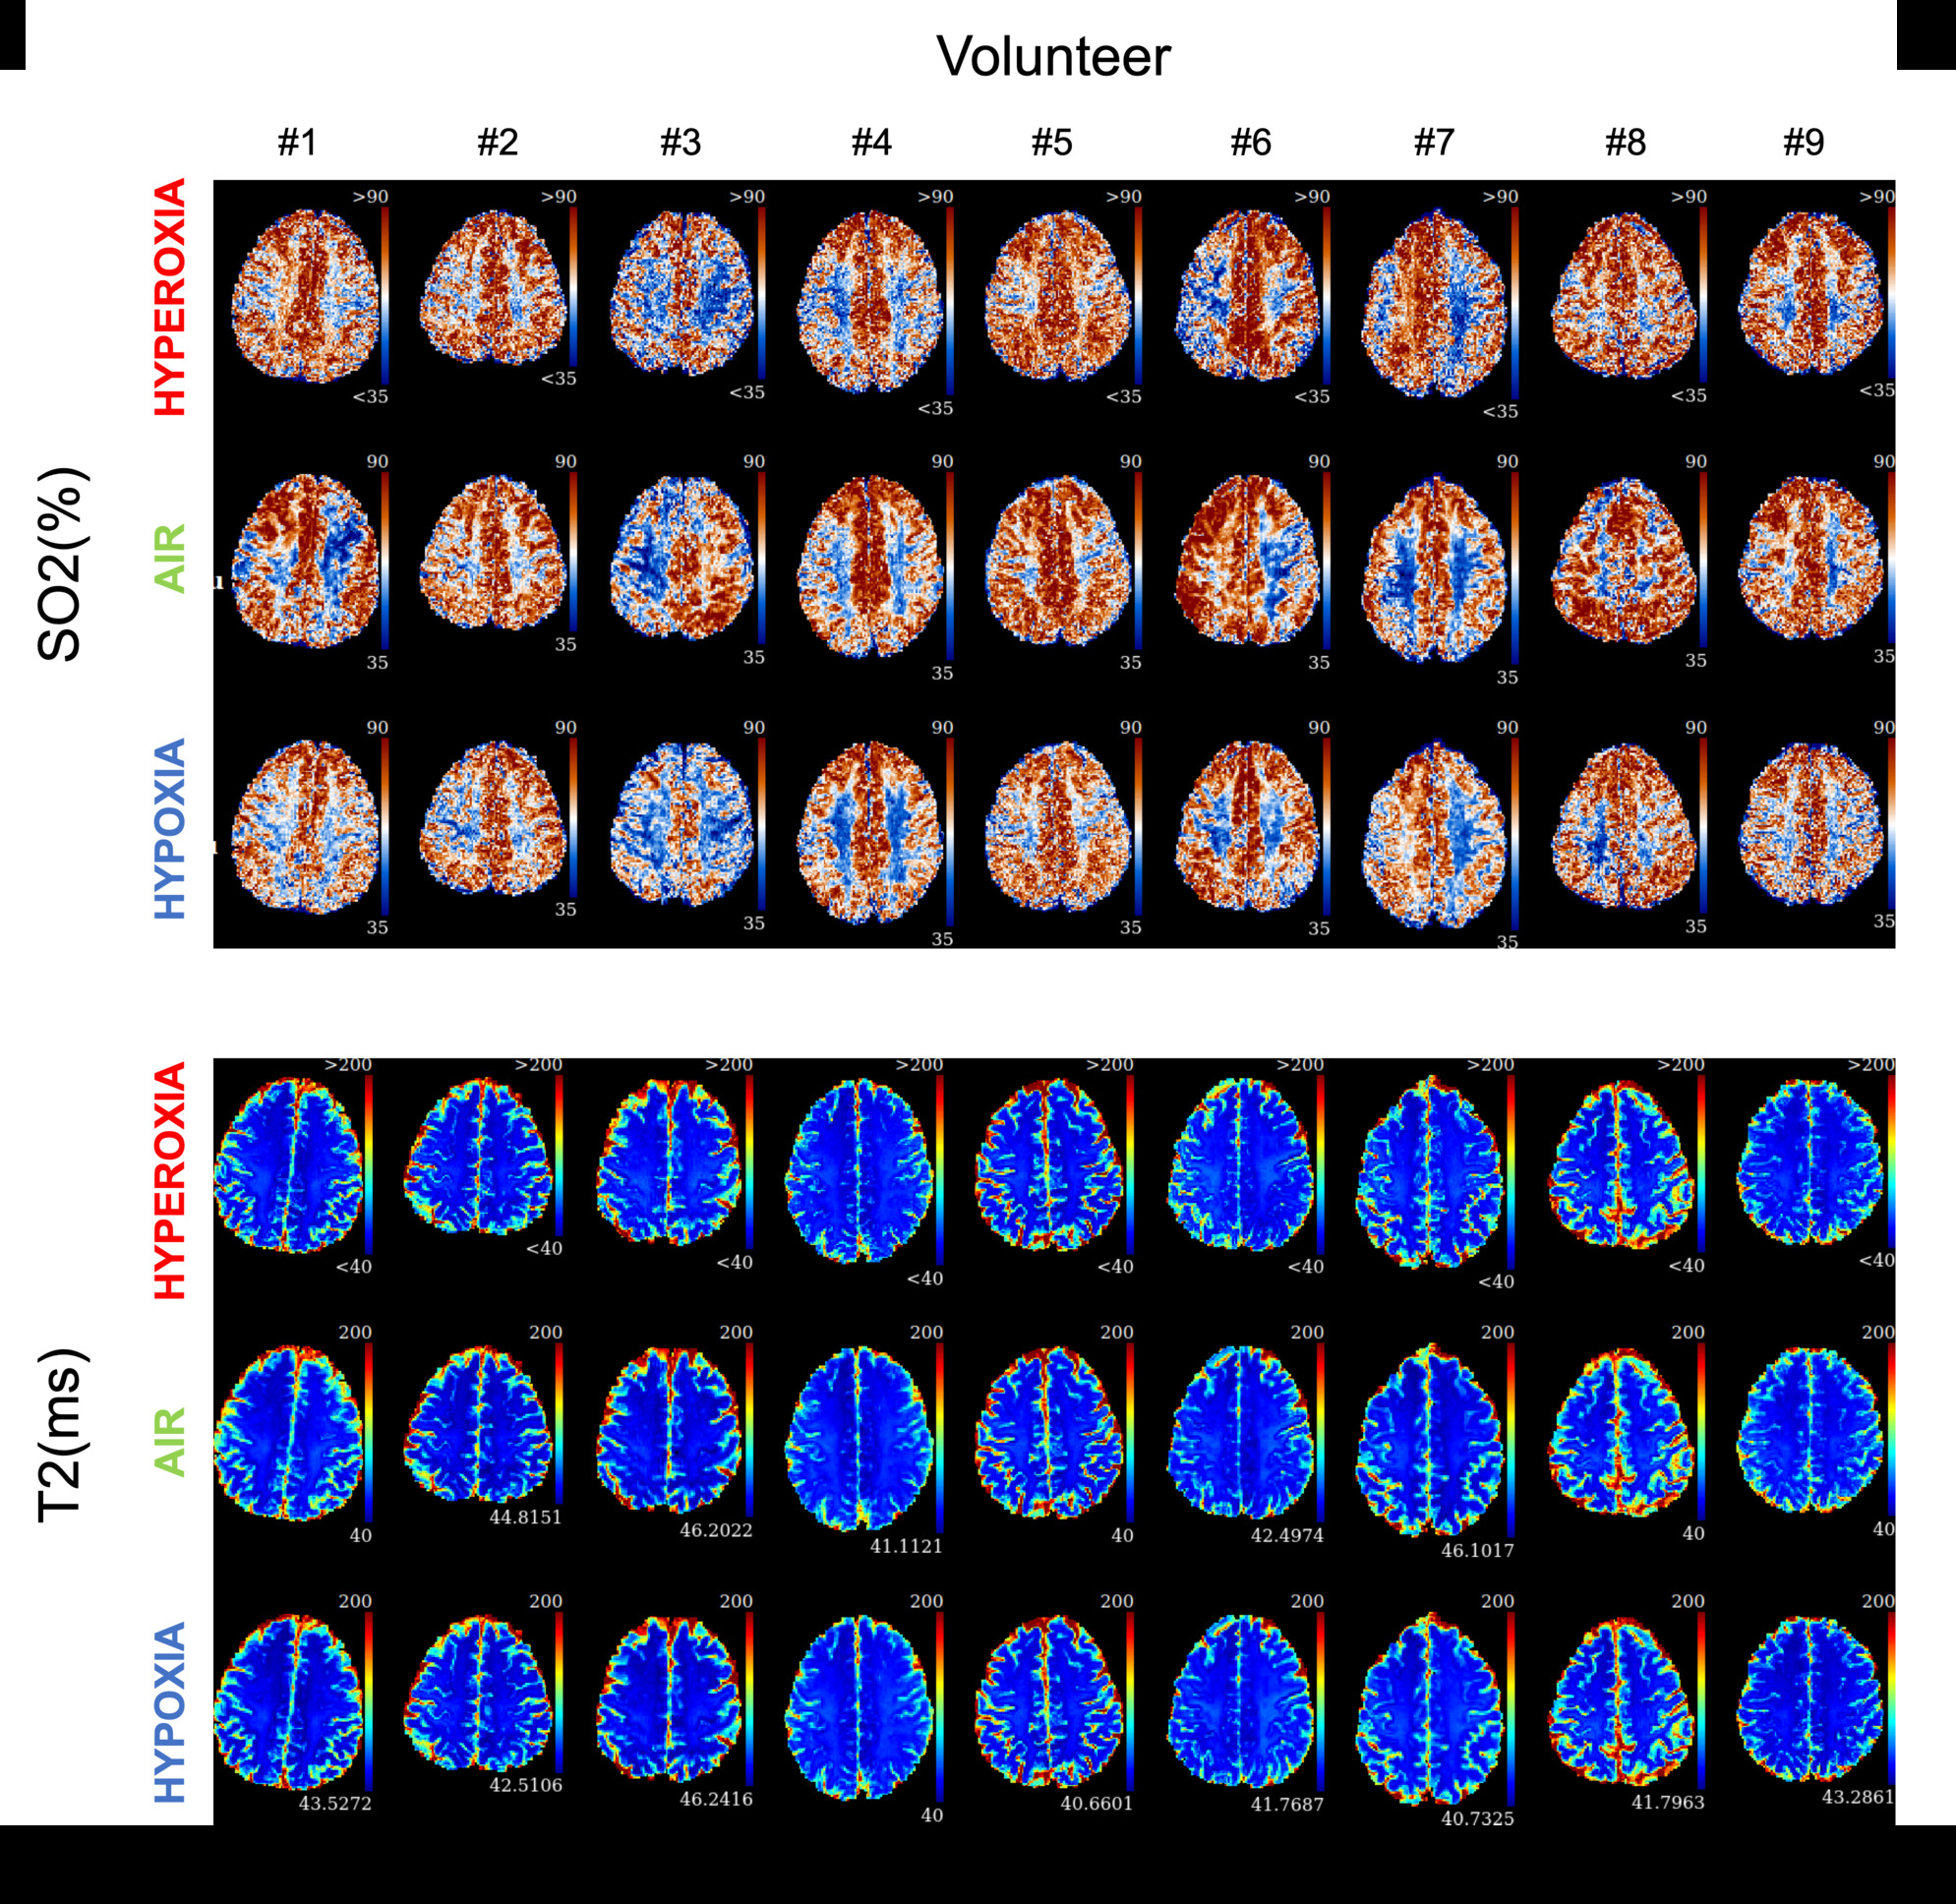
Physiological monitoring (Fig.1a-b) indicated global changes of arterial blood oxygenation during the gas challenges. The original MRvF approach with 2D vessels simulations did not detect significant variations of SO2 during the gas challenges (Fig1c). MRvF parametric maps obtained with the new 3D geometry and concatenation pattern in one volunteer during the 3 challenges are presented in Fig.2c. High quality CBV maps show good contrasts between GM and WM, while Vessel Radius maps are more homogeneous. SO2 maps, although homogeneous in the grey matter, show lower values in the white matter regions. T2 maps are in line with standard multi spin-echo acquisitions. For all the estimates except SO2 in WM, the numerical values obtained during normoxia and averaged over the volunteers are consistent with previous reports and physiological measurements (Fig3). One can also notice lower SO2 values during hypoxia compared to normoxia in the maps Fig2c as well as significant differences found at group level (Fig4). Some changes can also be observed in the CBV and R estimates between the gas challenges, possibly reflecting vasodilation or constriction. Parametric maps obtained in one slice in each volunteer are also shown in Fig4 and Fig5.Conclusion
This study shows significant improvement of MRvF estimates when using realistic simulations, new acquisition patterns and machine learning tools. Further improvements can be made by including vascular geometries obtained in healthy or pathological human brains or by using algorithms for realistic networks generations10. These new networks could allow for the simulation of blood flow and oxygen variations along the vessels. Better simulations including myelin and iron magnetic susceptibility effects as well as phase MR phase measurements should also improve the SO2 results in the white matter tissues. In parallel, automatic sequence design tools could be used to find new fingerprint patterns that don’t require the use of exogenous contrast agent.Acknowledgements
Supported by ANR MRFUSE (ANR-20-CE19-0030).References
[1] Christen, T., N. A. Pannetier, W. W. Ni, D. Qiu, M. E. Moseley, N. Schuff and G. Zaharchuk, MR vascular fingerprinting: A new approach to compute cerebral blood volume, mean vessel radius, and oxygenation maps in the human brain, NeuroImage 89, 262 (2014).
[2] Ma, D., V. Gulani, N. Seiberlich, K. Liu, J. L. Sunshine, J. L. Duerk and M. A. Griswold, Magnetic resonance fingerprinting, Nature 495, 187 (2013).
[3] Lemasson, B., N. Pannetier, N. Coquery, L. S. B. Boisserand, N. Collomb, N. Schuff, M. Moseley, G. Zaharchuk, E. L. Barbier and T. Christen, MR Vascular Fingerprinting in Stroke and Brain Tumors Models, Scientific Reports 6, 37071 (2016).
[4] Delphin, A., F. Boux, C. Brossard, J./. Warnking, B. Lemasson, E.B. Barbier and T. Christen, Using 3D realistic blood vessel structures and machine learning for MR vascular Fingerprinting, Proc ISMRM, London (2022)
[5] Christen T., W.W. Ni, J. Guo, A.P. Fan, M.M. Moseley and G. Zaharchuk, MR vascular Fingerprinting during gas challenges. Proc ISMRM, Paris (2018).
[6] Di Giovanna, A. P., A. Tibo, L. Silvestri, M. C. Müllenbroich, I. Costantini, A. L. Allegra Mascaro, L. Sacconi, P. Frasconi and F. S. Pavone, Whole-Brain Vasculature Reconstruction at the Single Capillary Level, Scientific Reports 8, 12573 (2018).
[7] Todorov, M. I., J. C. Paetzold, O. Schoppe, G. Tetteh, S. Shit, V. Efremov, K. Todorov-Völgyi, M. Düring, M. Dichgans, M. Piraud, B. Menze and A. Ertürk, Machine learning analysis of whole mouse brain vasculature, Nature Methods 17, 442 (2020).
[8] Brossard, C., O. Montigon, F. Boux, A. Delphin, T. Christen, E. L. Barbier and B. Lemasson, MP3: Medical Software for Processing Multi-Parametric Images Pipelines, Frontiers in Neuroinformatics 14 (2020).
[9] Boux, F., F. Forbes, J. Arbel, B. Lemasson and E. L. Barbier, Bayesian Inverse Regression for Vascular Magnetic Resonance Fingerprinting, IEEE Transactions on Medical Imaging 40, 1827 (2021).
[10] Linninger, A., G. Hartung, S. Badr and R. Morley, Mathematical synthesis of the cortical circulation for the whole mouse brain-part I. theory and image integration, Computers in Biology and Medicine 110, 265 (2019).
Figures