2357
Correlation of quantitative synthetic mapping imaging with cervical squamous carcinoma pathology1The 2nd Affiliated Hospital of Chengdu Medical College Nuclear Industry 416 Hospital, Chengdu, China, 2GE Healthcare, Beijing, China
Synopsis
Keywords: MR Fingerprinting/Synthetic MR, MR Value
Clinical and pathological staging are vital for management of Cervical squamous carcinoma (CSC). In this study, using synthetic MR technique, we investigate quantitative T1, T2 and PD measurements in different clinical and pathological stage groups. Performance of those quantitative measurements in diagnosing poorly-differentiated CSC is also investigated. We find T2 values are higher in late clinical stage CSC. Results also show a correlation between quantitative measurements and the degree of pathological differentiation. ROC analysis demonstrate that T1 and T2 values can differentiate poorly-differentiated CSC from intermediate and well differentiated CSC1.Introduction
Uterus cervical cancer is the third most common malignant tumor in the female and has the highest mortality rate. Features such as pathologic staging, grading, clinical stage, and lymph node metastasis, are critical to treatment planning and prognostic assessment2. Cervical squamous carcinoma (CSC) accounts for major portion of total cervical cancer incidence. Accurately grading of differentiation of UCC is beneficial to the prognosis of CSC patients. Several magnetic resonance imaging techniques have been applied to analyze the pathological features of cervical cancer. However, conventional imaging methods can only reflect the morphological features of a lesion and cannot evaluate grade of differentiation. Recently, a novel quantitative MR technique termed as ‘Synthetic MRI’ can simultaneously generate multiple sequences in a single scan, including morphological images like T1-weighted imaging (T1WI), T2-weighted imaging (T2WI), and quantitative images of T1 map, T2 map, and proton density (PD) map. There have been some promising findings of Synthetic MRI in brain, prostate and breast3. The purpose of this study was to investigate the feasibility of using T1, T2 and PD values obtained by synthetic quantitative MRI to assess the level of differentiation and clinical staging of CSC.Methods
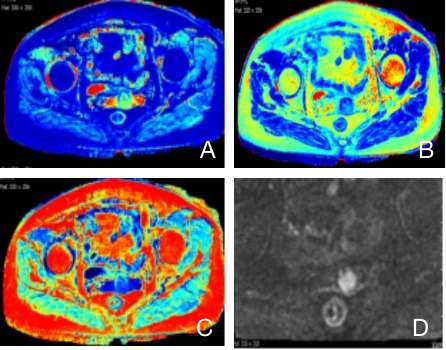
This prospective study was approved by the medical ethics committee. Ethical approval and consent forms were obtained. In total, 37 histologically confirmed CSC patients, aged 35-83 years, with a mean of (51.9 ±11.3) years, were included in this study. All subjects were grouped with histological (well-, moderately- and poorly- differentiated) and clinical results (Early clinical stage and Late clinical stage) for comparative purpose. All patients underwent MR examination with a 3.0T scanner (Signa Architect, GE Healthcare, Milwaukee, WI)) with a dedicated 16 channels body coil. Each subjects were scanned with conventional sequences (T1WI, T2WI, STIR, DWI) and followed by synthetic MRI (MAGnetic resonance image Compilation, MAGiC) sequence. Detailed scan parameters for MAGiC sequence were: TR 4000ms, TE 13.6ms, slice thickness 3.5mm, slice spacing 0.5mm, total 24 slices, FOV 36cm×36cm, acquisition matrix 320×256, number of average 1. After scan was done, images were transferred to vendor provided workstation (AW4.7, GE Healthcare) for post processing. Quantitative maps, including T1, T2, and PD maps, were generated from the raw data produced by the MAGiC imaging sequence using a vendor-provided program (MAGiC, v. 100.1.1). T1 values, T2 values and PD values were measured with region of interest (ROI) manually drawn to cover the largest area of the lesion. Measurements were performed 3 times and the average value was recorded (Figure 1). One-way ANOVA test was used to compare the differences in T1, T2 and PD values among different pathological groups. The Mann-Whitney U test was used to compare the differences between clinically Early and Later stages, i.e. dichotomised FIGO stages (FIGO I~IIA1 vs. IIA2~IV). The receiver operating characteristic (ROC) were plotted, and the area under the curve was calculated for each parameter in the diagnosis of CSC . P < 0.05 was considered a statistically significant.Results
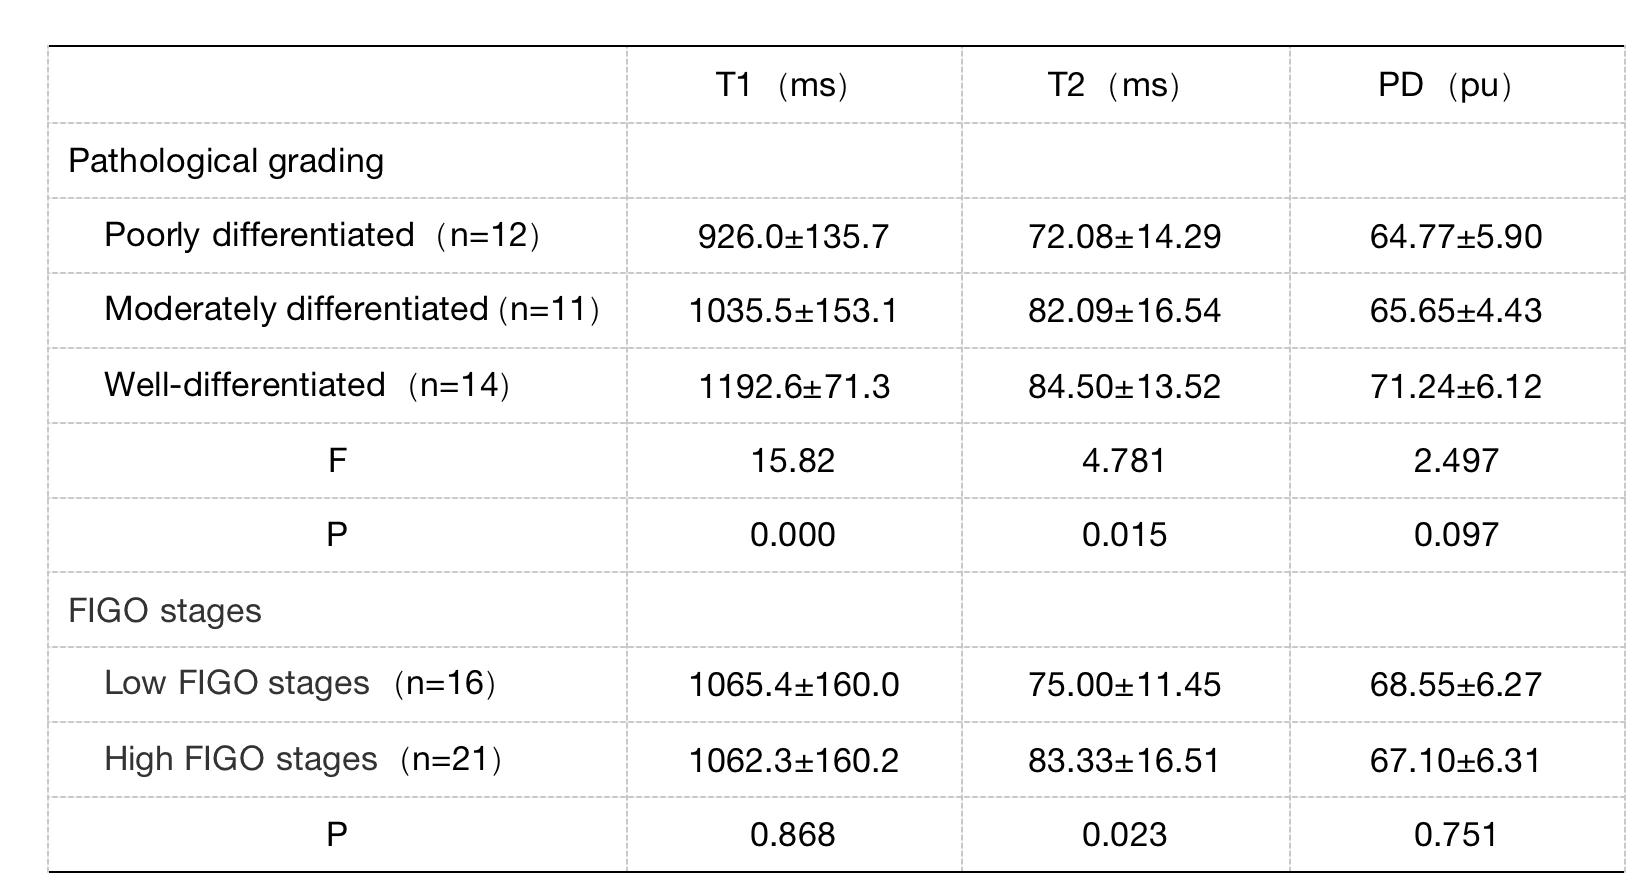
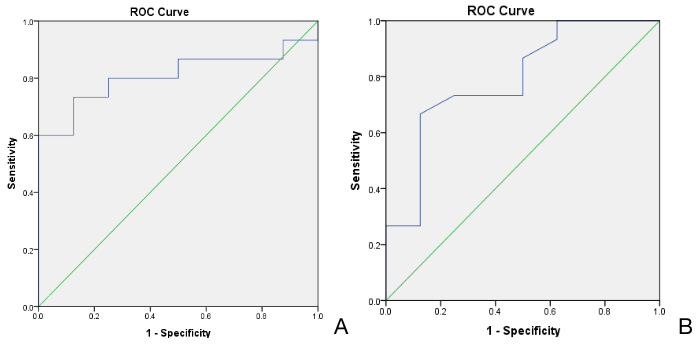
The differences in T1 and T2 values among different pathological grades of CSC were statistically significant (P values 0.000; 0.015, respectively), and the differences in PD values were not statistically significant (P=0.097)(Table 1). The difference in T2 values in clinical staging of CSC was statistically significant (P=0.023). The AUC values of T1 and T2 values for the diagnosis of poorly differentiated squamous carcinoma were 0.792 (sensitivity 74.3%, specificity 75.0%) and 0.808 (sensitivity 73.3%, specificity 87.5%), respectively(Figure 2).Discussion and Conclusion
Our study demonstrated a correlation between the quantitative parameters and the degree of pathological differentiation of CSC in which the T1 and T2 values were lower in poorly-differentiated cervical squamous carcinoma than in moderately- and well-differentiated CSC. T2 value could differentiate FIGO stages in SCC, with higher T2 value in high FIGO stages than low FIGO stages. The results of this study showed that the T1 and T2 values of CSC decreased as the degree of differentiation decreased, with T2 having higher diagnostic efficacy (AUC=0.808). Since T1 value is mainly affected by the composite water signal in the cellular and extracellular space4, we suspect the lower T1 value in poorly-differentiated CSC patients is mainly due to the decrease of interstitial space, enriched cell proliferation, larger nucleus, reduced cell space and the decrease of water content1. The distribution of T1 value corresponds to the histopathological manifestation of the central necrotic area, tumor cell count and fibrosis of the tumor, and the tumor center has lower T1 value than the peritumor area5.Acknowledgements
No acknowledgement found.References
1.Haaf, P.; Garg, P.; Messroghli, D.R.; et al. Cardiac T1 Mapping and Extracellular Volume (ECV) in clinical practice: A comprehensive review. Cardiovasc. Magn. Reson. 2016, 18, 89.
2.Chen XL, Chen GW, Xu GH, et al. Tumor size at magnetic resonance imaging association with lymph node metastasis and lymphovascular space invasion in resectable CC: A multicenter evaluation of surgical specimens. Int J Gynecol Cancer 2018;28:1545-1552.
3.Matsuda M, Tsuda T, Ebihara R, et al. Enhanced Masses on Contrast-Enhanced Breast: Difffferentiation Using a Combination of Dynamic Contrast-Enhanced MRI and Quantitative Evaluation with Synthetic MRI. J Magn Reson Imaging 2020.
4.Tirkes T,Lin C,Cui E,et al.Quantitative MR evaluation of chronic pancreatitis: extracellular volume fraction and MR relaxometry.AJR Am J Roentgenol,2018,210: 533-542.
5.Keller S, Borde T, Brangsch J, A,et al. Native T1 Mapping Magnetic Resonance Imaging as a Quantitative Biomarker for Characterization of the Extracellular Matrix in a Rabbit Hepatic Cancer Model. Biomedicines. 2020 Oct 13;8(10):412.
Figures