2354
Magnetic resonance fingerprinting in patients with Parkinson's disease
Yaping Wu1, Qian Xie2, Ge Zhang1, Yan Bai1, Xipeng Yue1, Wei Wei1, Fangfang Fu1, Nan Meng1, Xianchang Zhang3, Yusong Lin4,5,6, and Meiyun Wang1
1Department of Medical Imaging, Henan Provincial People’s Hospital, Zhengzhou, China, 2School of Computer and Artificial Intelligence, Zhengzhou University, Zhengzhou, China, 3MR Collaboration, Siemens Healthineers Ltd., Beijing, China, 4School of Cyber Science and Engineering, Zhengzhou University, Zhengzhou, China, 5Collaborative Innovation Center for Internet Healthcare, Zhengzhou University, Zhengzhou, China, 6Hanwei IoT Institute, Zhengzhou University, Zhengzhou, China
1Department of Medical Imaging, Henan Provincial People’s Hospital, Zhengzhou, China, 2School of Computer and Artificial Intelligence, Zhengzhou University, Zhengzhou, China, 3MR Collaboration, Siemens Healthineers Ltd., Beijing, China, 4School of Cyber Science and Engineering, Zhengzhou University, Zhengzhou, China, 5Collaborative Innovation Center for Internet Healthcare, Zhengzhou University, Zhengzhou, China, 6Hanwei IoT Institute, Zhengzhou University, Zhengzhou, China
Synopsis
Keywords: MR Fingerprinting/Synthetic MR, MR Fingerprinting, Parkinson's disease
This study investigated the utility of 3D high resolution magnetic resonance fingerprinting (MRF) to detect potential brain changes in Parkinson’s disease (PD). MRF T1 and T2 maps of the brains of 22 PD patients and 22 volunteers were non-linearly normalized into the MNI space to explore the group differences using whole-brain analysis. PD patients had significantly higher T1 and T2 values in the right inferior temporal gyrus anterior/posterior division, right temporal fusiform cortex anterior division, right planum polare and red nucleus. Our findings suggest that quantitative parameters acquired from 3D MRF may provide additional information for precise diagnosis of PD.Introduction
Parkinson’s Disease is a neurodegenerative disease that affects the aging population [1]. With the onset of the disease, the patients suffer from mobility disorders such as tremors, bradykinesia, impairment of posture and balance, etc., and it progressively worsens in the due course of time. It is difficult to diagnose PD with conventional MR imaging such as T1 or T2 weighted imaging [2]. MR fingerprinting (MRF) emerged as a novel acquisition and reconstruction technique that could simultaneously and efficiently obtain multiple quantitative parameters such as T1 and T2 relaxometry [3]. These biophysical parameters derived from MRF may help to recognize the subtle changes of brain tissue in PD patients, thus providing additional information PD diagnosis. Recently, fast 3D MRF techniques have been proposed to provide high-resolution whole brain quantitative maps in less than 10 minutes [4]. The purpose of this study was to use 3D high resolution quantitative MRF T1 and T2 maps to explore the microstructural changes in the brain of patients with PD.Methods
This study enrolled 22 PD patients (16 males and 6 femals; age range 45 – 73 years, mean age 63 ± 8 years) and 22 sex- and age-matched healthy controls (HC). All enrolled participants received scans on a 3T MAGNETOM Prisma scanner (Siemens Healthcare, Erlangen, Germany) equipped with a 64-channel head coil (Fig. 1). The scan protocol included MRF and Magnetization Prepared 2 Rapid Acquisition Gradient Echoes (MP2RAGE) sequence. A prototype 3D FISP MRF sequence [4] (C2P sequence, https://www.nmr.mgh.harvard.edu/~berkin/mrf_3d.html) was performed with the following parameters: FOV = 240 x 240 mm2; voxel size = 1.2 x 1.2 x 1.2 mm3; flip angles varied sinusoidally from 5 to 80 degrees; TR varied between 12 to 13 ms with a Perlin noise pattern; 460 measurements; 160 slices; and acquisition time = 8:49 mins.The MRF T1 and T2 maps were non-linearly registered to the template in the MNI space with the deformation field generated from segmentation of the T1-MP2RAGE-UNI image using SPM12 (https://www.fil.ion.ucl.ac.uk/spm/software/spm12/). Subsequently, the mean values of the T1 and T2 maps were calculated for 96 different cortical regions and 32 subcortical regions in the whole brain using masks from the Harvard-Oxford atlas and compared between the PD group and HC. The Shapiro-Wilk test and Levene’s test were used to evaluate the distribution type and homogeneity of variance. An independent sample T-test was used to compare the groups with SPSS 22.0. P<0.05 was considered statistically significant.Results
PD patients showed significantly higher T1 values than HC in brain areas such as the middle temporal gyrus (MTG) anterior division (left and right), and right MTG posterior division, as shown in Table 1. PD patients showed significantly higher T2 values than HC in brain areas such as right paracingulate gyrus, right temporal fusiform cortex (TFC) posterior division, and left planum polare. The detailed results are shown in Table 2. Both the T1 and T2 maps showed significant higher in the right inferior temporal gyrus (ITG) anterior division, right ITG posterior division, right TFC anterior division, and right planum polare. In terms of subcortical gray matter nuclei, T2 value of red nucleus in PD patients was significantly higher than that in HC (left 40±49 vs 52±25, P = 0.040; right 40±24 vs 50±19,P = 0.009).Discussion
It is a challenging task to diagnose PD only by medical imaging. Magnetic resonance imaging (MRI) is the primary diagnostic tool for neurological diseases. Previous studies have shown abnormal brain functions in the temporal and frontal lobes of PD patients, suggesting that these brain regions may be the locus of PD pathogenesis.Our results showed that T1 values in some brain regions of PD patients were significantly higher than HC, mainly including bilateral temporal lobe and right orbitofrontal cortex. T2 values of some brain regions in PD patients were significantly higher in right temporal lobe and paracingulate gyrus. This study showed that T2 values in bilateral red nucleus became higher in PD patients, which may also be helpful in diagnosing or evaluating the progression of PD, but further details need to be studied.Conclusion
The T1 and T2 maps acquired from MRF sequences can be used for quantitative analysis of cortical and subcortical changes, which may also be helpful in diagnosing or evaluating the progression of PD.Acknowledgements
This paper is supported by the National Key R&D Program of China (2017YFE0103600), National Natural Science Foundation of China (81720108021), Zhongyuan Thousand Talents Plan Project (ZYQR201810117), Zhengzhou Collaborative Innovation Major Project (20XTZX05015), Key Project of Henan Province Medical Science and Technology Project (LHGJ20210005), the Henan Provincial Science and Technology Research Projects (222102310627).References
[1] Chakraborty, S., Aich, S., & Kim, H. C. (2020). Detection of Parkinson’s disease from 3T T1 weighted MRI scans using 3D convolutional neural network. Diagnostics, 10(6), 1–17.[2] Traynor, C. R., Barker, G. J., Crum, W. R., Williams, S. C. R., & Richardson, M. P. (2011). Segmentation of the thalamus in MRI based on T1 and T2. NeuroImage, 56(3), 939–950.[3] Ma, D., Gulani, V., Seiberlich, N., Liu, K., Sunshine, J. L., Duerk, J. L., & Griswold, M. A. (2013). Magnetic resonance fingerprinting. Nature, 495(7440), 187–192.[4] Liao, C., Bilgic, B., Manhard, M.K., Zhao, B., Cao, X., Zhong, J., Wald, L.L., Setsompop, K., 3D MR fingerprinting with accelerated stack-of-spirals and hybrid sliding-window and GRAPPA reconstruction, NeuroImage (2017).Figures
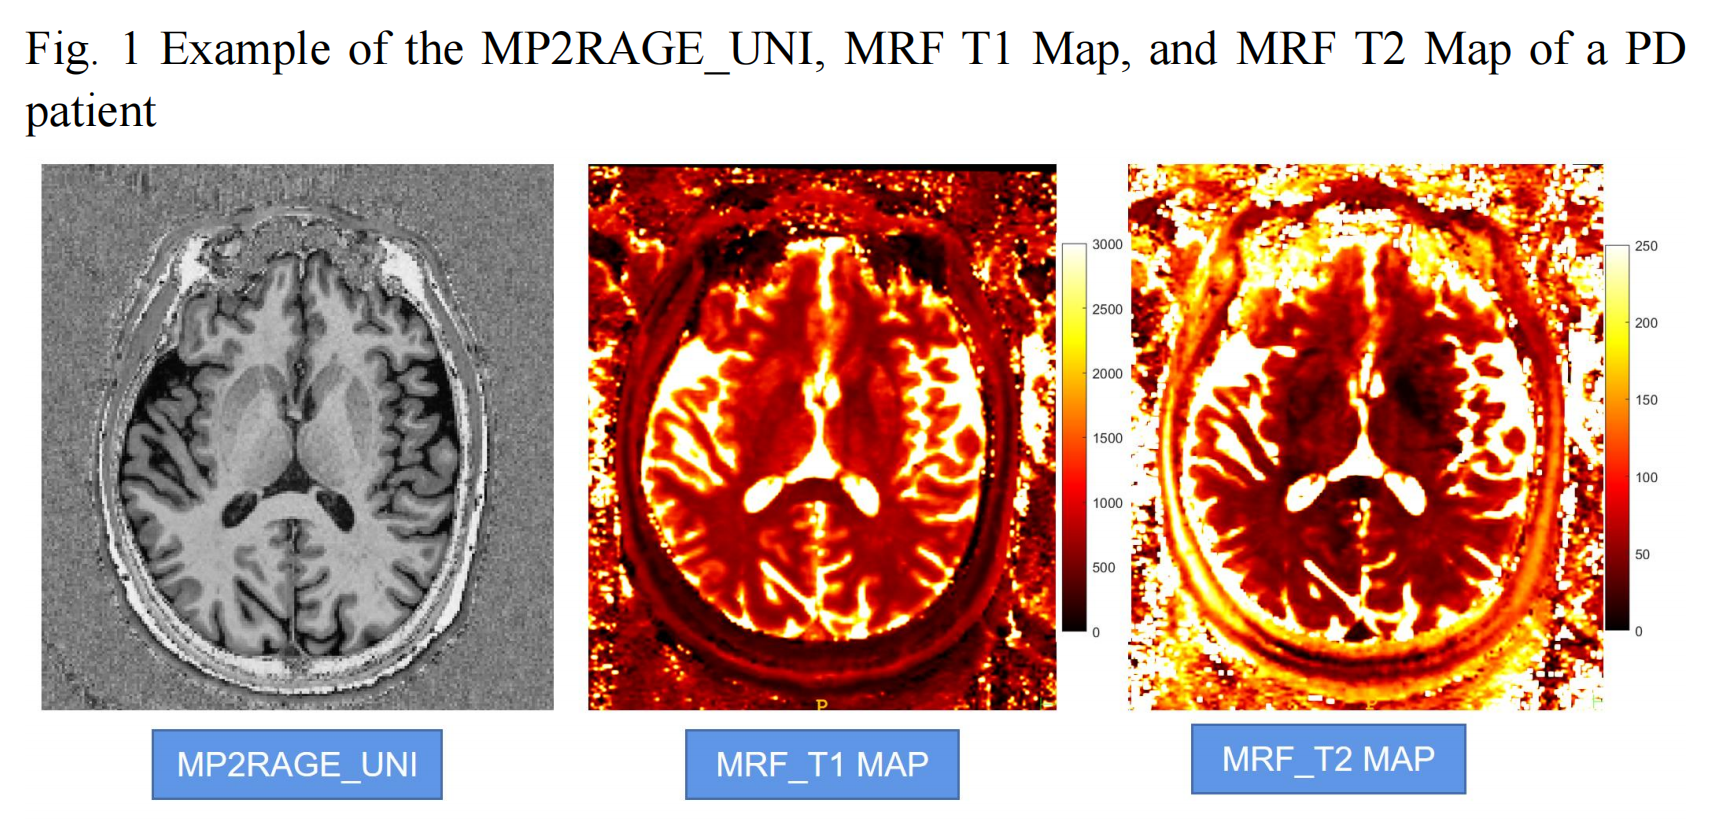
Fig. 1 Example of the MP2RAGE_UNI, MRF T1 Map, and MRF T2 Map of a PD
patient
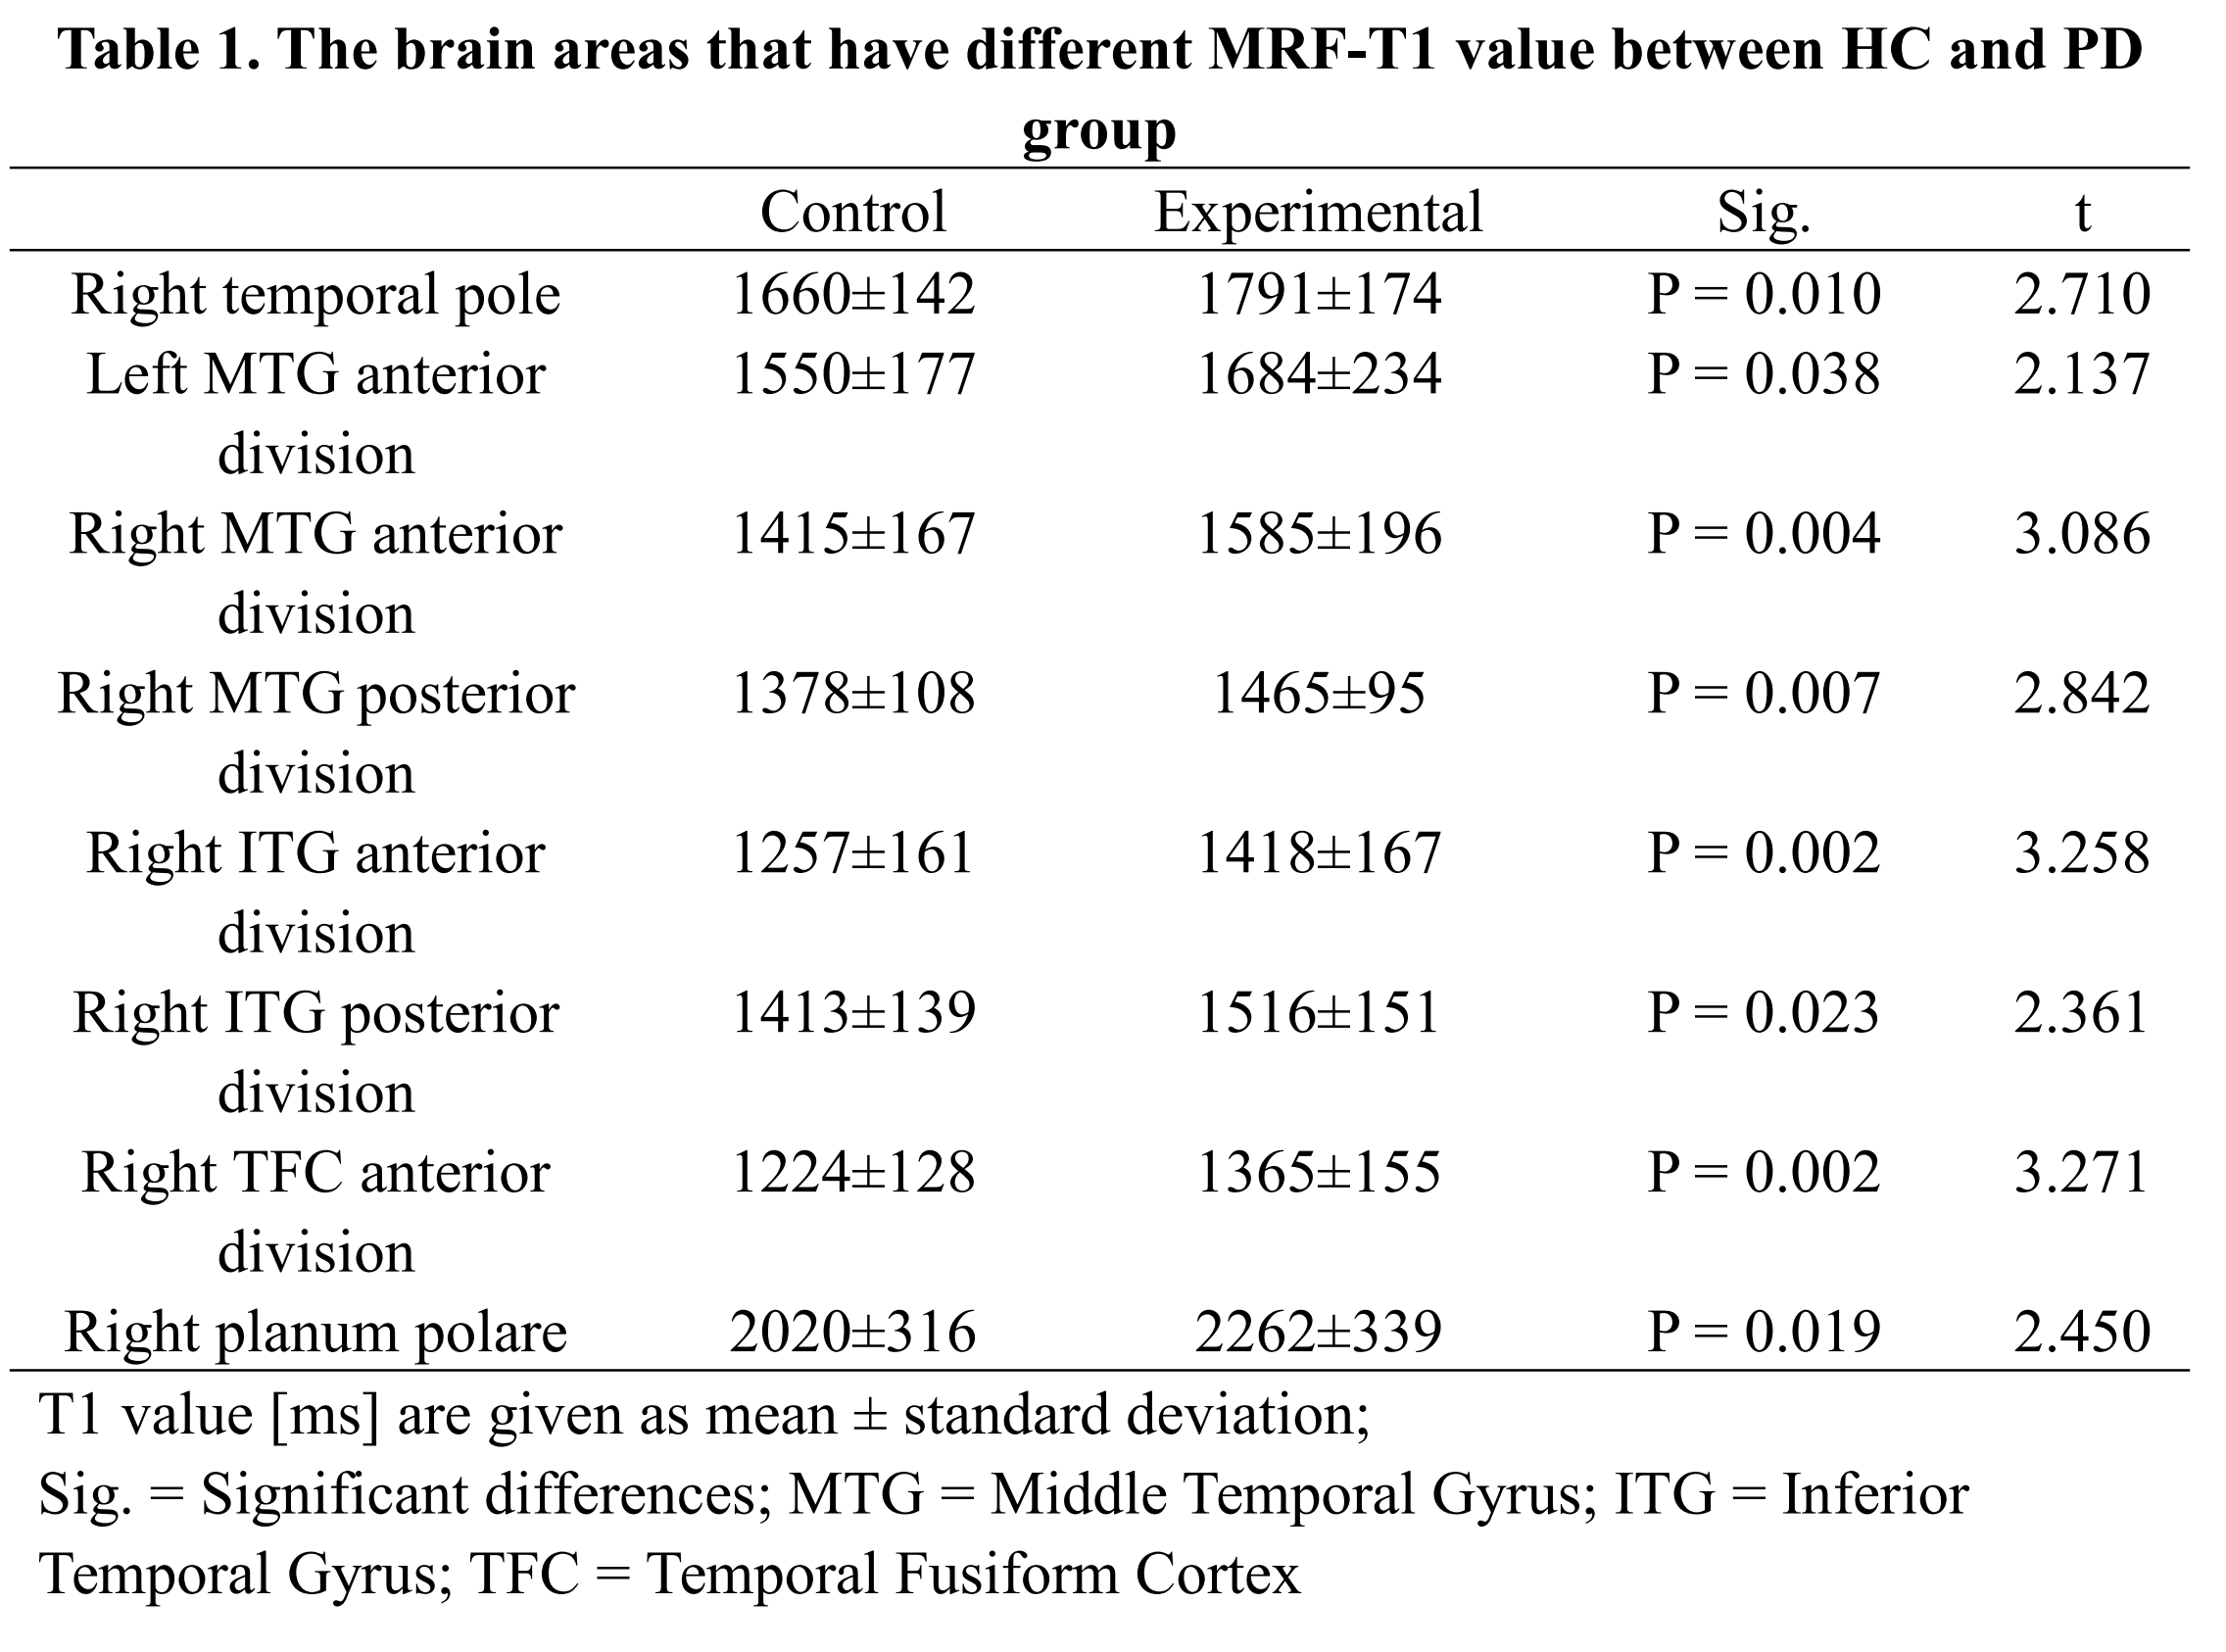
Table 1. The brain areas that have different MRF-T1 value between HC and PD
group
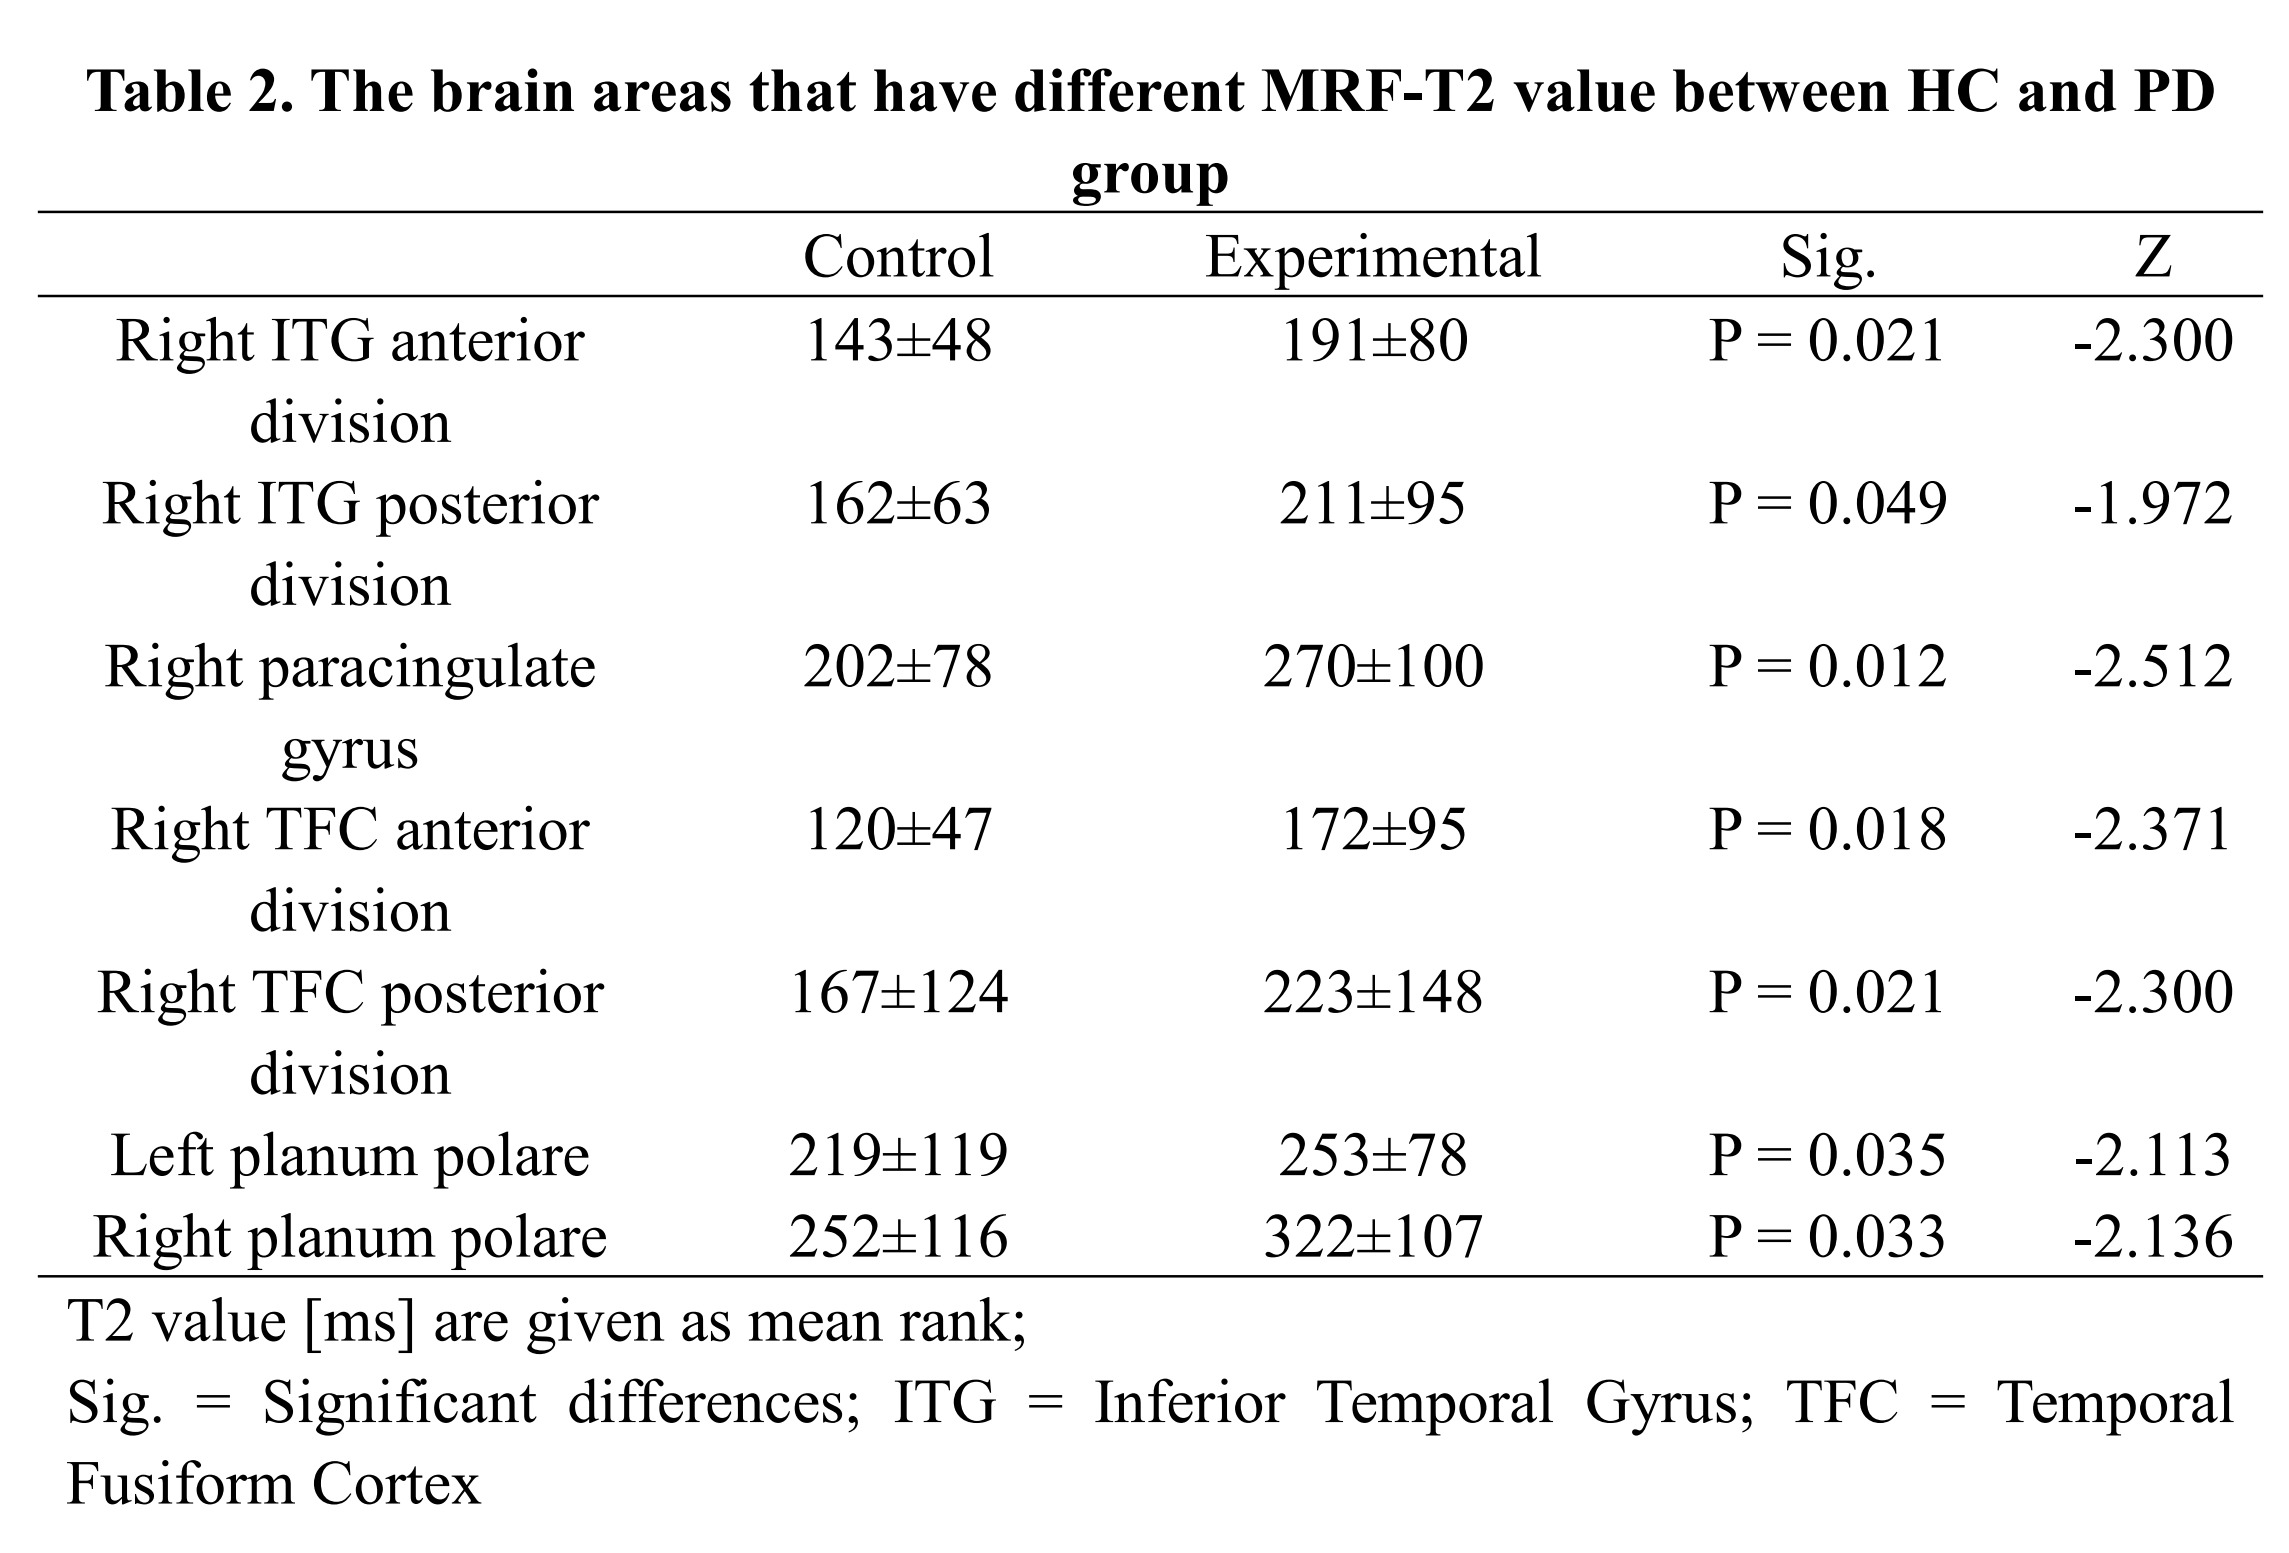
Table 2. The brain areas that have different MRF-T2 value between HC and PD
group
DOI: https://doi.org/10.58530/2023/2354