2352
Pre and Post contrast Simultaneous Parametric Mapping of Glioblastomas from routine T1 weighted images for Quantitative Enhancement Assessment1University of Valladolid, Valladolid, Spain, 2Erasmus MC, Rotterdam, Netherlands
Synopsis
Keywords: MR Fingerprinting/Synthetic MR, Machine Learning/Artificial Intelligence
Gadolinium based contrast agents (GBCAs) have the ability to uncover blood brain barrier damage, which appears in the images as contrast enhancement caused by the leakage into the perivascular tissues. However, in clinical practice, this assessment is performed by visual comparison between the weighted images obtained before and after the GBCA injection; enhancement quantification is still an unmet need. In this work we propose a deep learning approach for the computation of pre- and post-contrast parametric maps from conventional T1 weighted images. Results show how those maps can enable an automatic quantification of the tumor enhancement.Purpose
High-grade gliomas such as glioblastomas usually present damaged blood brain barrier (BBB), which is associated with aggressive features of this type of brain tumor1. The usage of gadolinium based contrast agents (GBCAs) is customary for tumor diagnosis and treatment response assessment due to their ability to reveal the aforementioned condition2. Thus, in clinical practice, a T1-weighted (T1w) image is usually acquired, followed by GBCA injection and a re-acquisition of the image, obtaining the so-called post-contrast T1w (postT1w). Hereinafter the former is referred to as pre-contrast. Both images — T1w and postT1w — are then visually compared seeking for the potential contrast enhancement in the latter caused by the leakage of GBCA into the perivascular tissues1. The qualitative nature and arbitrary scale of weighted image intensities indeed hinder the usage of quantitative diagnostic methods, which could be relevant for distinguishing different post-treatment conditions, understanding biological changes within the tumor and minimizing interpretation errors of treatment effects. Parametric maps are known to have a quantitative absolute scale, to be more robust against scanner imperfections and to be able to highlight subtle changes quantitatively, which are relevant ingredients to be qualified as biomarkers of impaired BBB3,4.Recently, we have proposed a synthetic MRI approach for the computation of T1, T2, and PD parametric maps from only routine acquired weighted images5. Self-supervised learning allowed us to compute reliable maps without the need of the corresponding reference maps for network training. In this work we propose the extension of that method for the computation of pre- and post-contrast parametric maps. As we show, those maps can enable an automatic quantification of tumor enhancement.
Methods
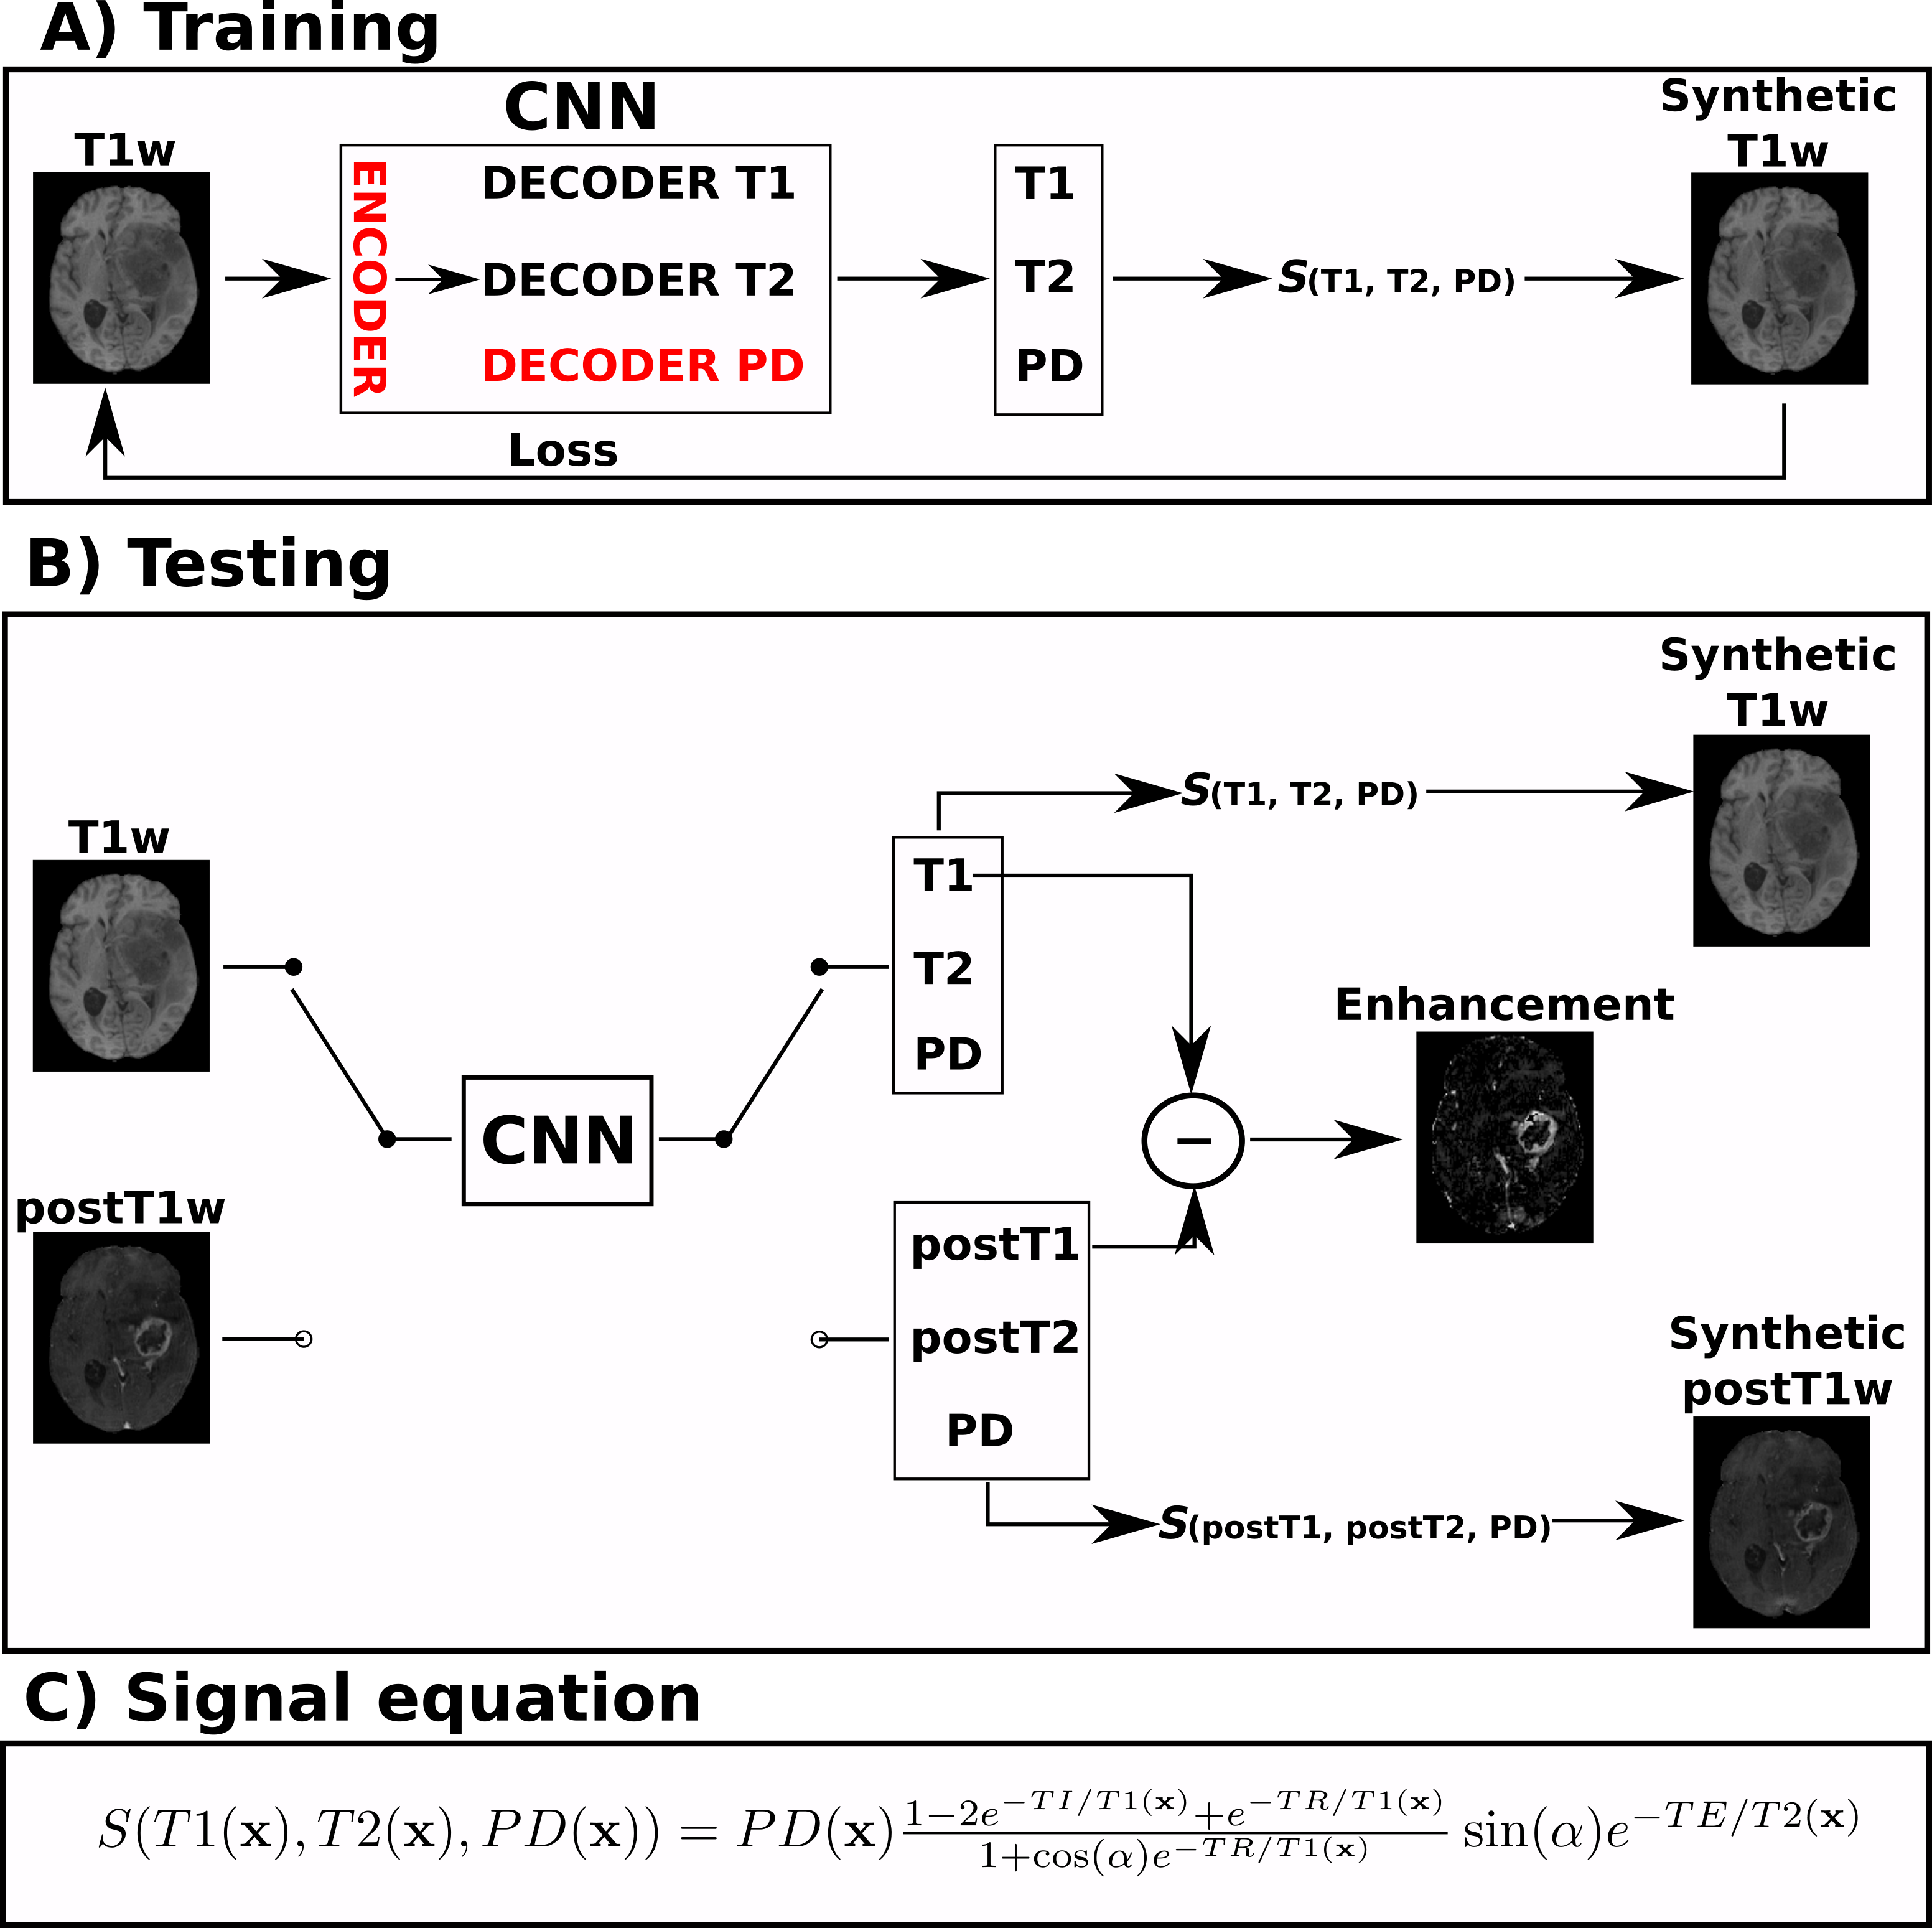
Dataset and preprocessing: UPENN-GBM public dataset6 was employed in this work. It is composed of more than 600 acquisitions of glioblastoma patients including T1w, postT1w, T2-weighted (T2w), and FLAIR. Data were preprocessed following the BraTS preprocessing pipeline in CaPTk7. Also the segmentations into three different tumor regions — necrosis, enhancement, and edema — were available. From all the image modalities, only the T1w and postT1w were used in this work. We selected a total of 220 patients with stable acquisition parameters (3T scanner, TE/TR/TI=3.1/1760/950ms and α=15º). These 220 patients were randomly divided between training, validation, and testing with an approximate ratio of 60/20/20%.Training and testing: An overview of the training and testing approaches is shown in Figure 1. The convolutional neural network (CNN) described in Ref.5 was modified in order to compute the T1, T2, and PD parametric maps from only the T1w. Thus, the resulting CNN is composed of one encoder and three decoders, one per parametric map. Transfer learning was applied by initializing the network’s weights with a pre-trained network with synthetic data5. Self-supervised learning was employed to train the network only from the T1w images without the need of reference parametric maps. The training was performed with a batchsize of 32 and Adam optimizer (learning rate of 1e-4). Early stopping validation was employed to avoid overfitting.
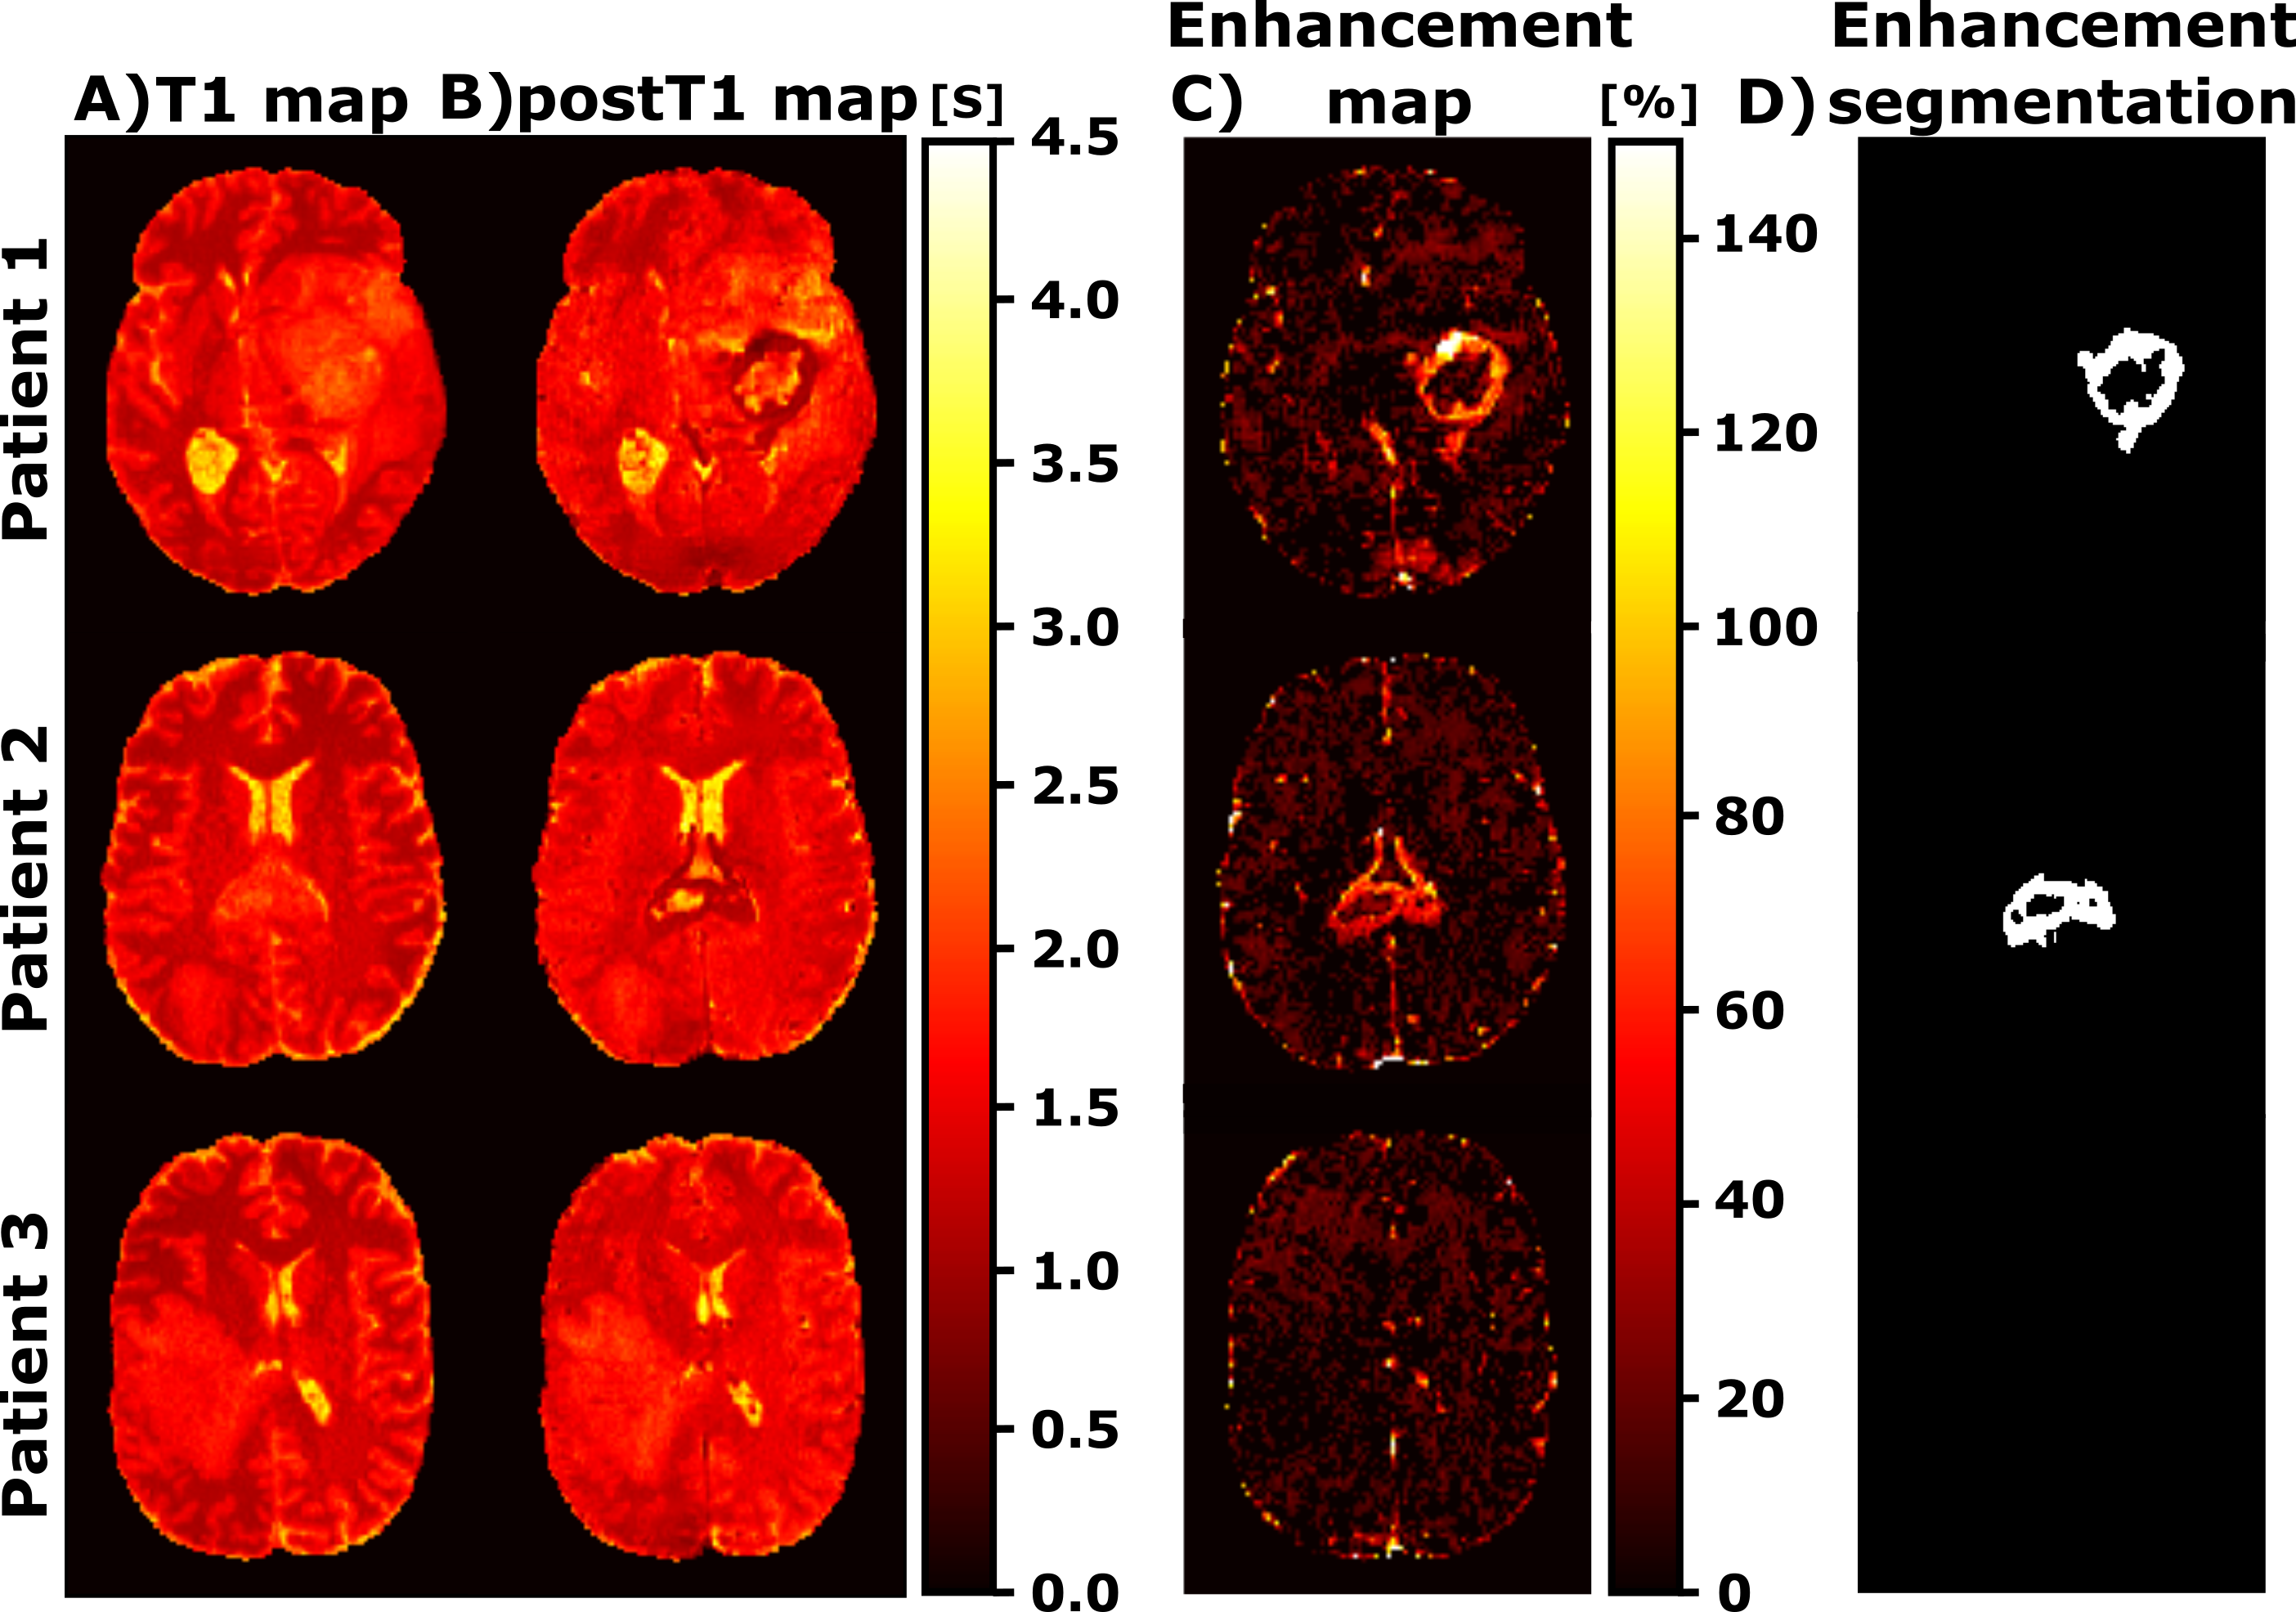
For testing, the T1w and postT1w were separately input to the trained network. Under the assumption that the only difference between both images is the GBCA intake (i.e., both are acquired in the same scanner and with same parameters), the resulting maps should correspond to the pre- and post-contrast parametric maps, respectively. Thus, we can quantify the enhancement by means of the normalized difference between the pre-contrast T1 map and the post-contrast T1 (postT1) map. Specifically, the enhancement map could be computed as $$$100*\frac{|\text{T1}-\text{postT1}|}{\text{postT1}}[\%]$$$.
Results
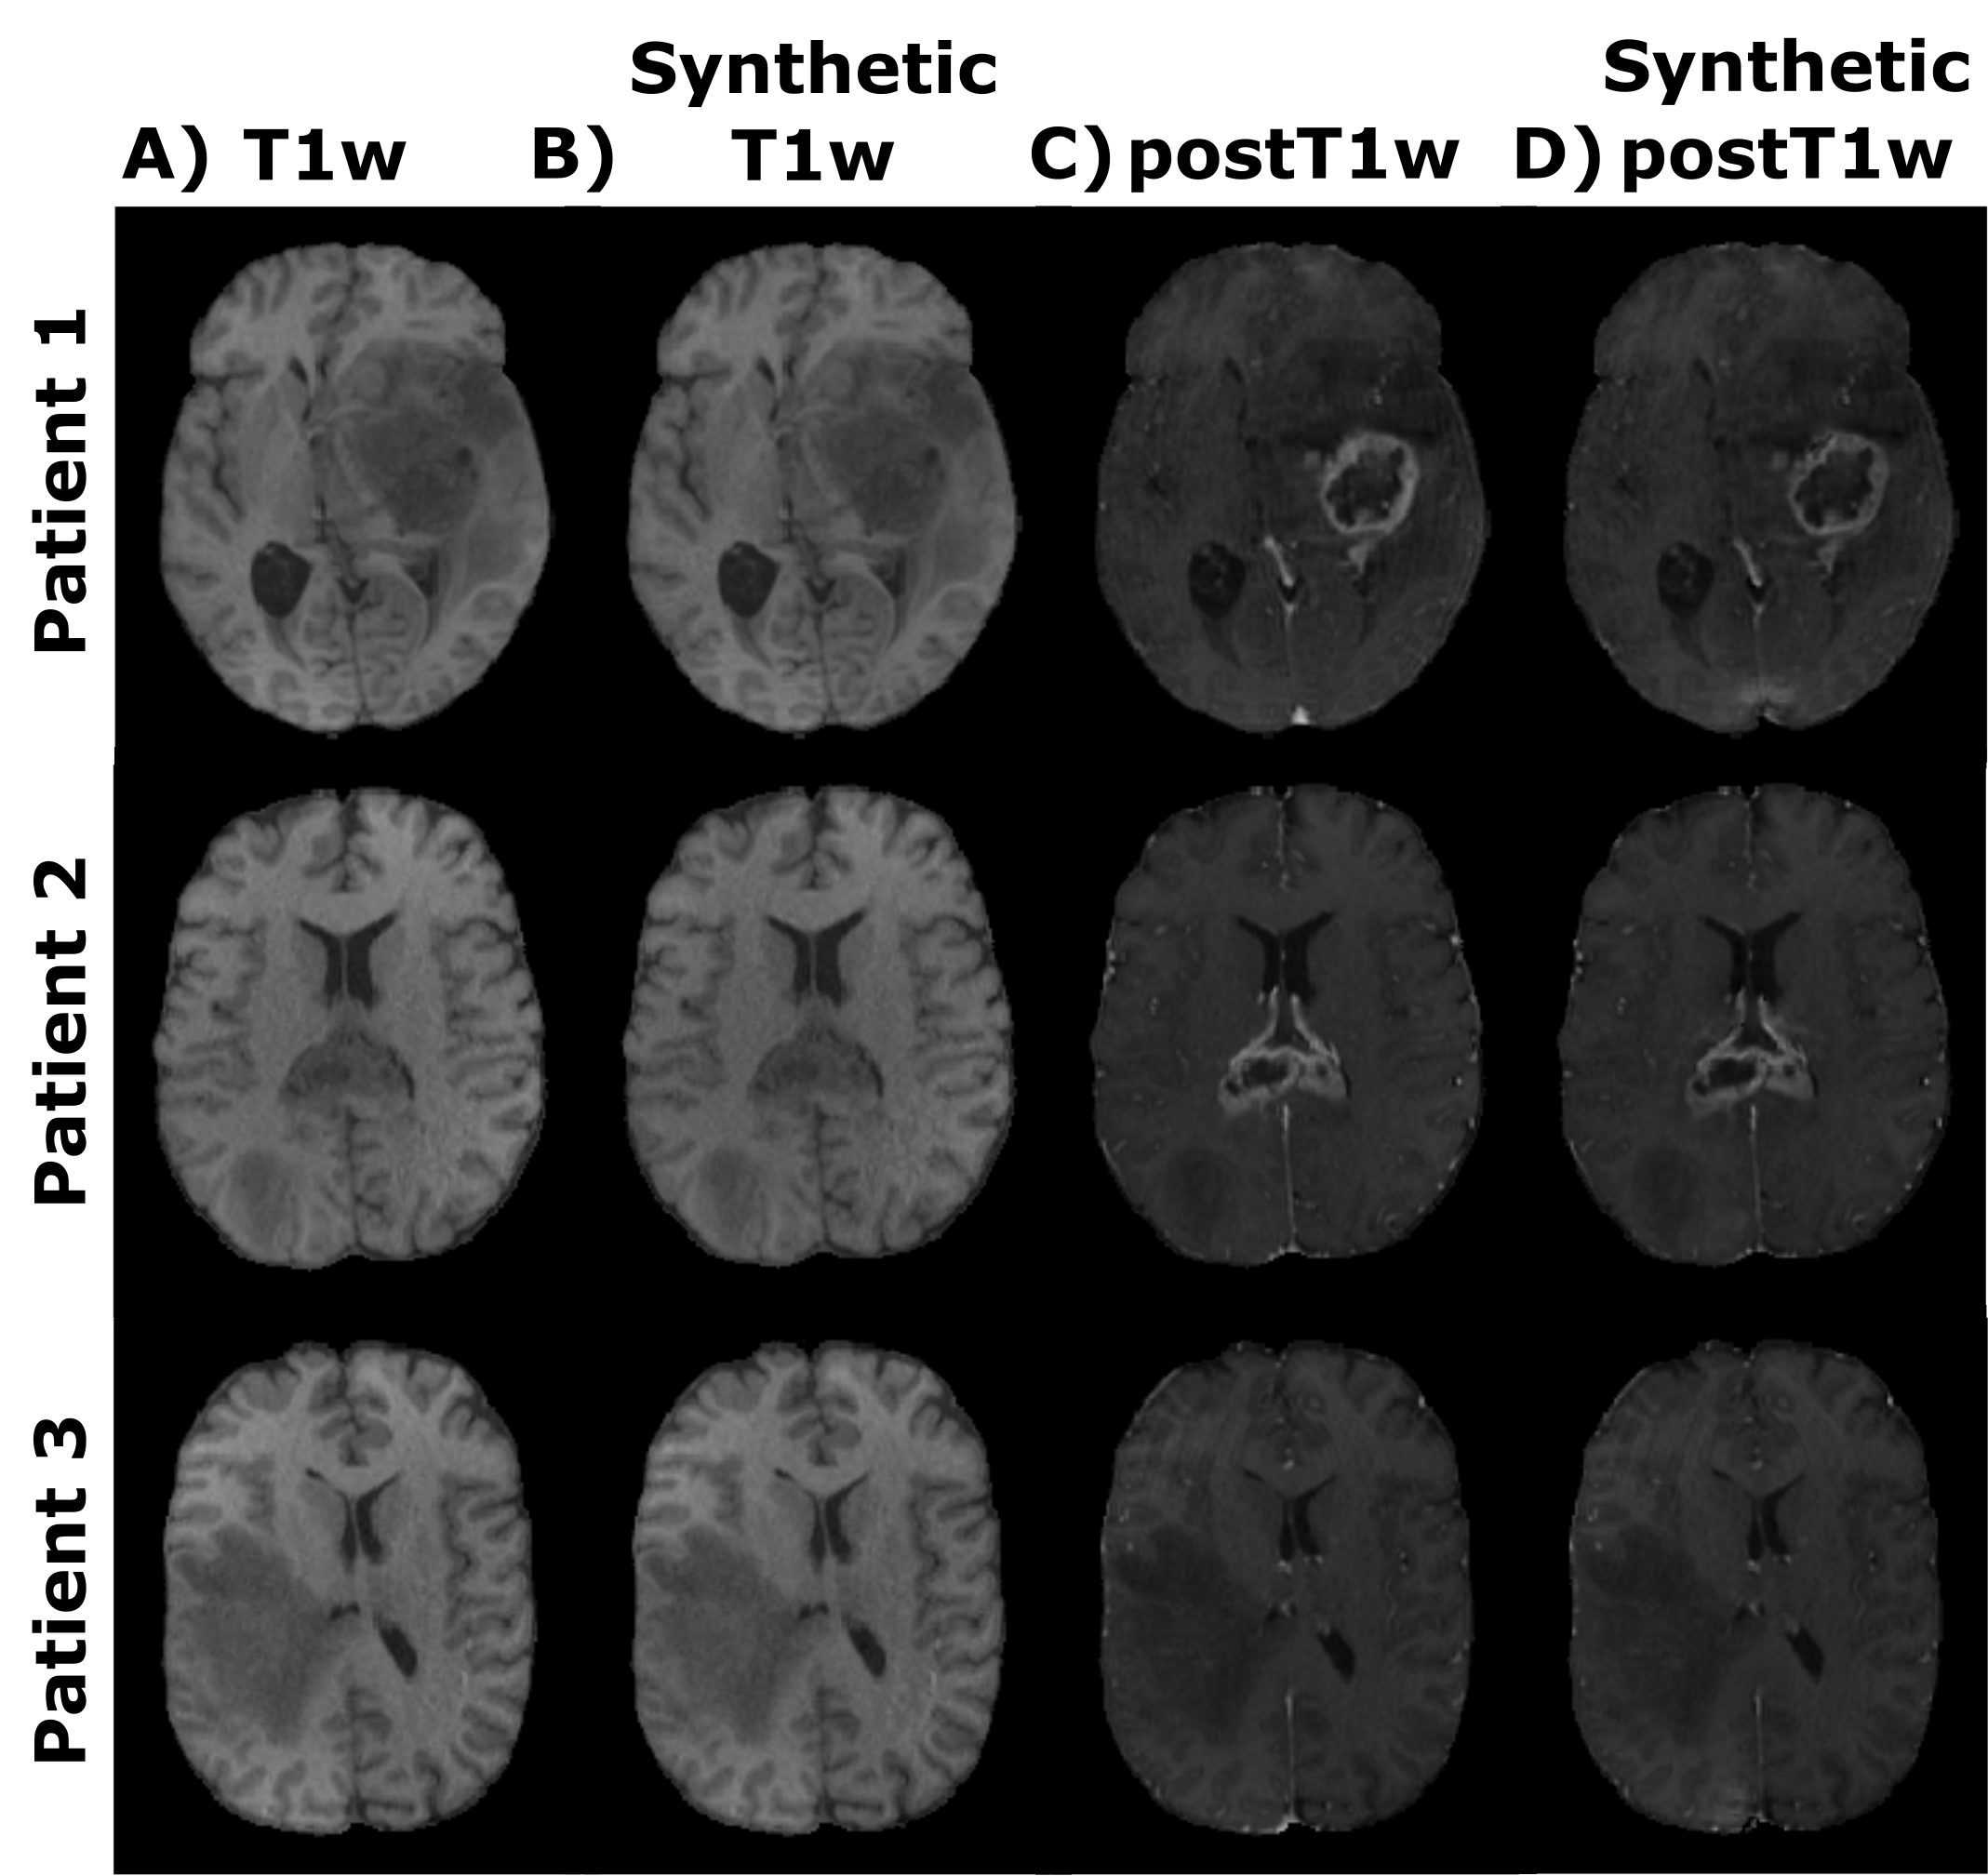
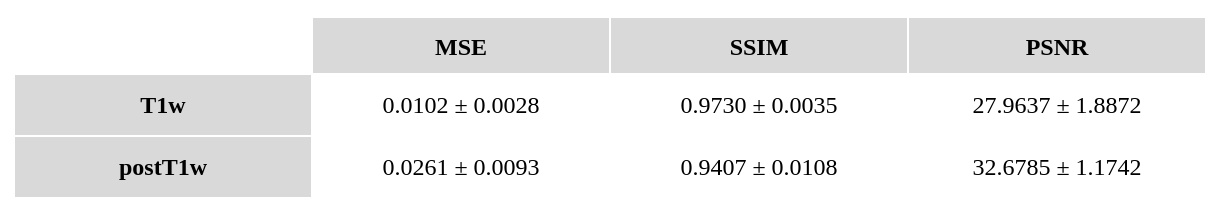
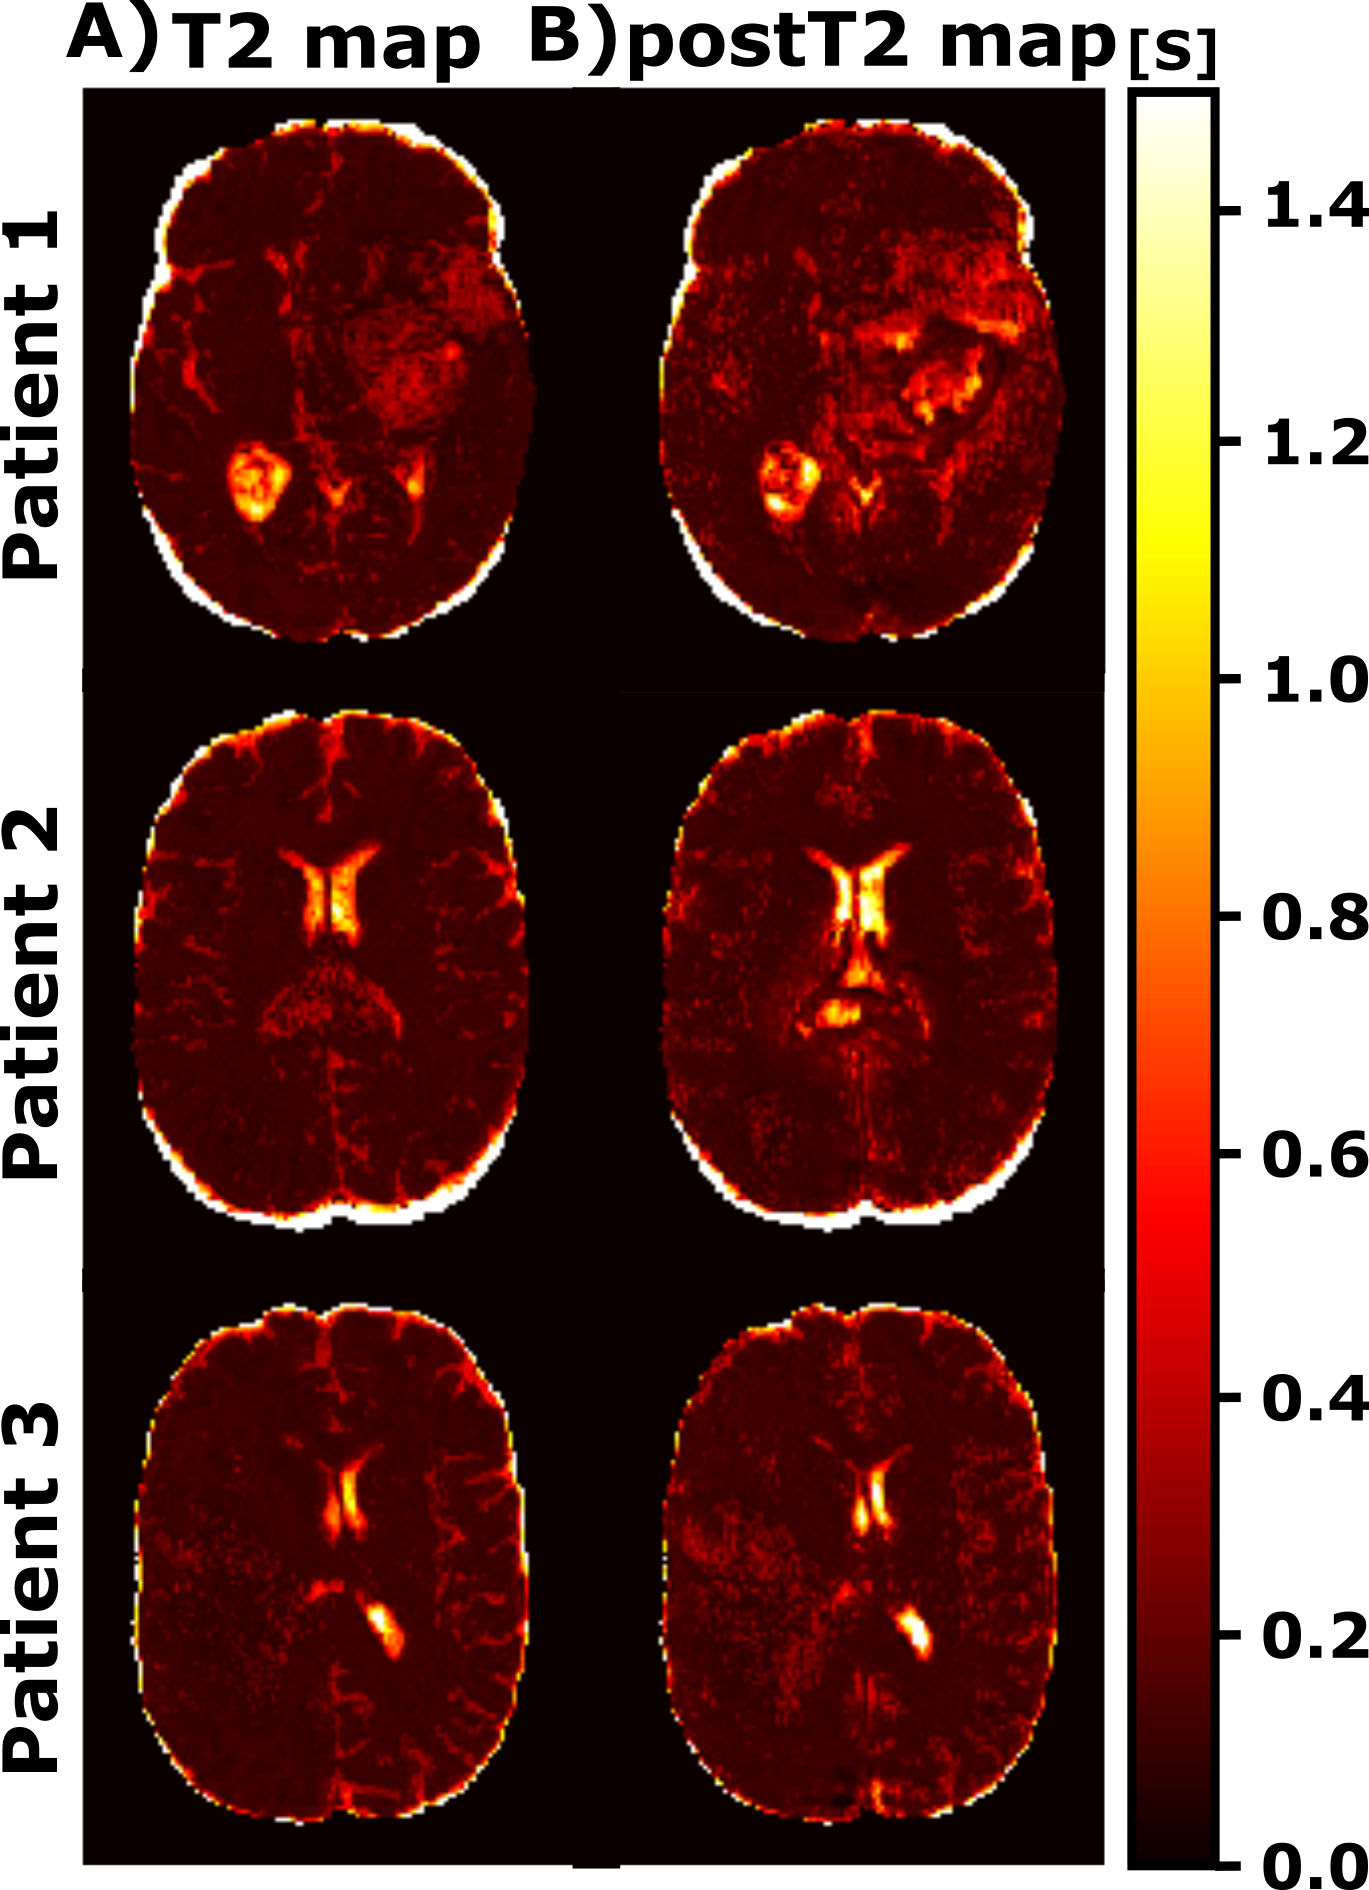
Figure 2 shows representative slices of the synthesized and their corresponding acquired weighted images (both T1w and postT1w) for different test patients. Table 1 shows the mean values along test patients of the quality metrics (i.e., MSE, SSIM, and PSNR) computed between the synthesized and the acquired weighted images for both image modalities. Figures 3 and 4 show for different test patients both the pre-contrast and post-contrast T1 and T2 maps, respectively. The corresponding enhancement maps are also shown in Figure 3. For the sake of visibility the intensity of the enhancement maps is cropped between 10% and 150%.Discussion
These results show the utility of parametric maps computed only from a routine sequence for the quantification of clinical relevant data. The synthesized weighted images can be visually compared with their actually acquired counterparts and visual resemblance is noticeable. The quality metrics also prove the agreement between both. Interestingly, within the enhanced region we can perceive the reduction of the T1 values in the post-contrast parametric maps compared to the respective pre-contrast maps. The enhanced region in the enhancement map considerably matches such a region in the segmentations computed from the weighted images.The approach has some limitations; further validation of the computed parametric maps should be performed by comparing these maps with those obtained with other well-accepted yet lengthy relaxometry techniques. In addition, the value of the enhancement maps in clinical-decisions automatic pipelines should be studied.
Conclusion
We proposed an approach for the enhancement quantification in glioblastoma by means of parametric maps computed from only routine, fast sequences. Results suggest the potential of this approach for automatic quantitative assessment replacing the standard visual inspection of weighted images.Acknowledgements
The authors acknowledge the Asociación Española Contra el Cáncer (AECC), Junta Provincial de Valladolid, and the Fundación Científica AECC for the predoctoral fellowship of the first author. In addition, the authors also acknowledge grants PID2020-115339RB-I00 and TED2021-130090B-I00 and PID2021-124407NB-I00 from the Ministerio de Ciencia e Innovación of Spain. The General Electric Healthcare Grant: “B-GEHC-5. MR Physiological Signature” is also acknowledged, as well as the support from ESAOTE.References
1. Warntjes M., et al. Synthesizing a contrast-enhancement map in patients with high-grade gliomas based on a postcontrast MR imaging quantification only. Am. J. Neuroradiol, 2018;39(12),2194-2199.
2. Hattingen E., et al. Value of quantitative magnetic resonance imaging T1-relaxometry in predicting contrast-enhancement in glioblastoma patients. Oncotarget, 2017;8(32),53542.
3. Blystad I., et al. Quantitative MRI for analysis of peritumoral edema in malignant gliomas. PLoS One, 2017;12(5),e0177135.
4. Pirkl C. M., et al. Accelerated 3D whole-brain T1, T2, and proton density mapping: feasibility for clinical glioma MR imaging. Neuroradiology, 2021;63(11),1831-1851.
5. Moya‐Sáez E., et al. Synthetic MRI improves Radiomics‐based glioblastoma survival prediction. NMR Biomed. 2022;e4754.
6. Bakas S., et al. The University of Pennsylvania glioblastoma (UPenn-GBM) cohort: advanced MRI, clinical, genomics, & radiomics. Sci. Data, 2022;9(1),1-12.
7. Rathore S., et al. Brain cancer imaging phenomics toolkit (brain-CaPTk): an interactive platform for quantitative analysis of glioblastoma. Int MICCAI Brainlesion Workshop. Quebec, Canada. 2017;133-145.
Figures