2351
Developmental pattern of individual morphometric similarity network in the human fetal brain1College of Biomedical Engineering & Instrument Science, Zhejiang University, Hangzhou, China, 2Department of Radiology, Beijing Hospital, National Center of Gerontology, Institute of Geriatric Medicine, Chinese Academy of Medical Sciences, Beijing, China, 3Department of Radiology, Shandong Provincial Hospital Affiliated to Shandong First Medical University, Jinan, China
Synopsis
Keywords: Fetal, Brain Connectivity
The fetal brain morphological network is important for us to understand early brain organization but has not characterized previously. In the study, we constructed fetal individual morphometric similarity networks using multiple cortical features based on in utero MRI data. The results demonstrated the decline of morphological symmetry between hemispheres during development. The morphological similarity between the limbic regions and other regions significantly increased while the similarity between the parieto-occipital regions and other regions significantly decreased. Small world organizations appeared as early as 22 weeks, and the network topology developed towards more integrated and less segregated during fetal period.Introduction
The development of cerebral cortex during fetal period is complex yet well-coordinated. The brain morphological network is an important approach to investigate the morphological covariant pattern of cerebral cortex and brain network topology. Particularly, individual morphometric similarity network (MSN) can comprehensively depict the regional similarity and preserve the individual difference[1-3]. However, morphological network of the fetal brain with in utero MRI has not been established, to the best of our knowledge, possibly due to the challenges in data acquisition. In the study, we constructed individual MSN using in utero fetal brain MRI to characterized the morphological development pattern.Methods
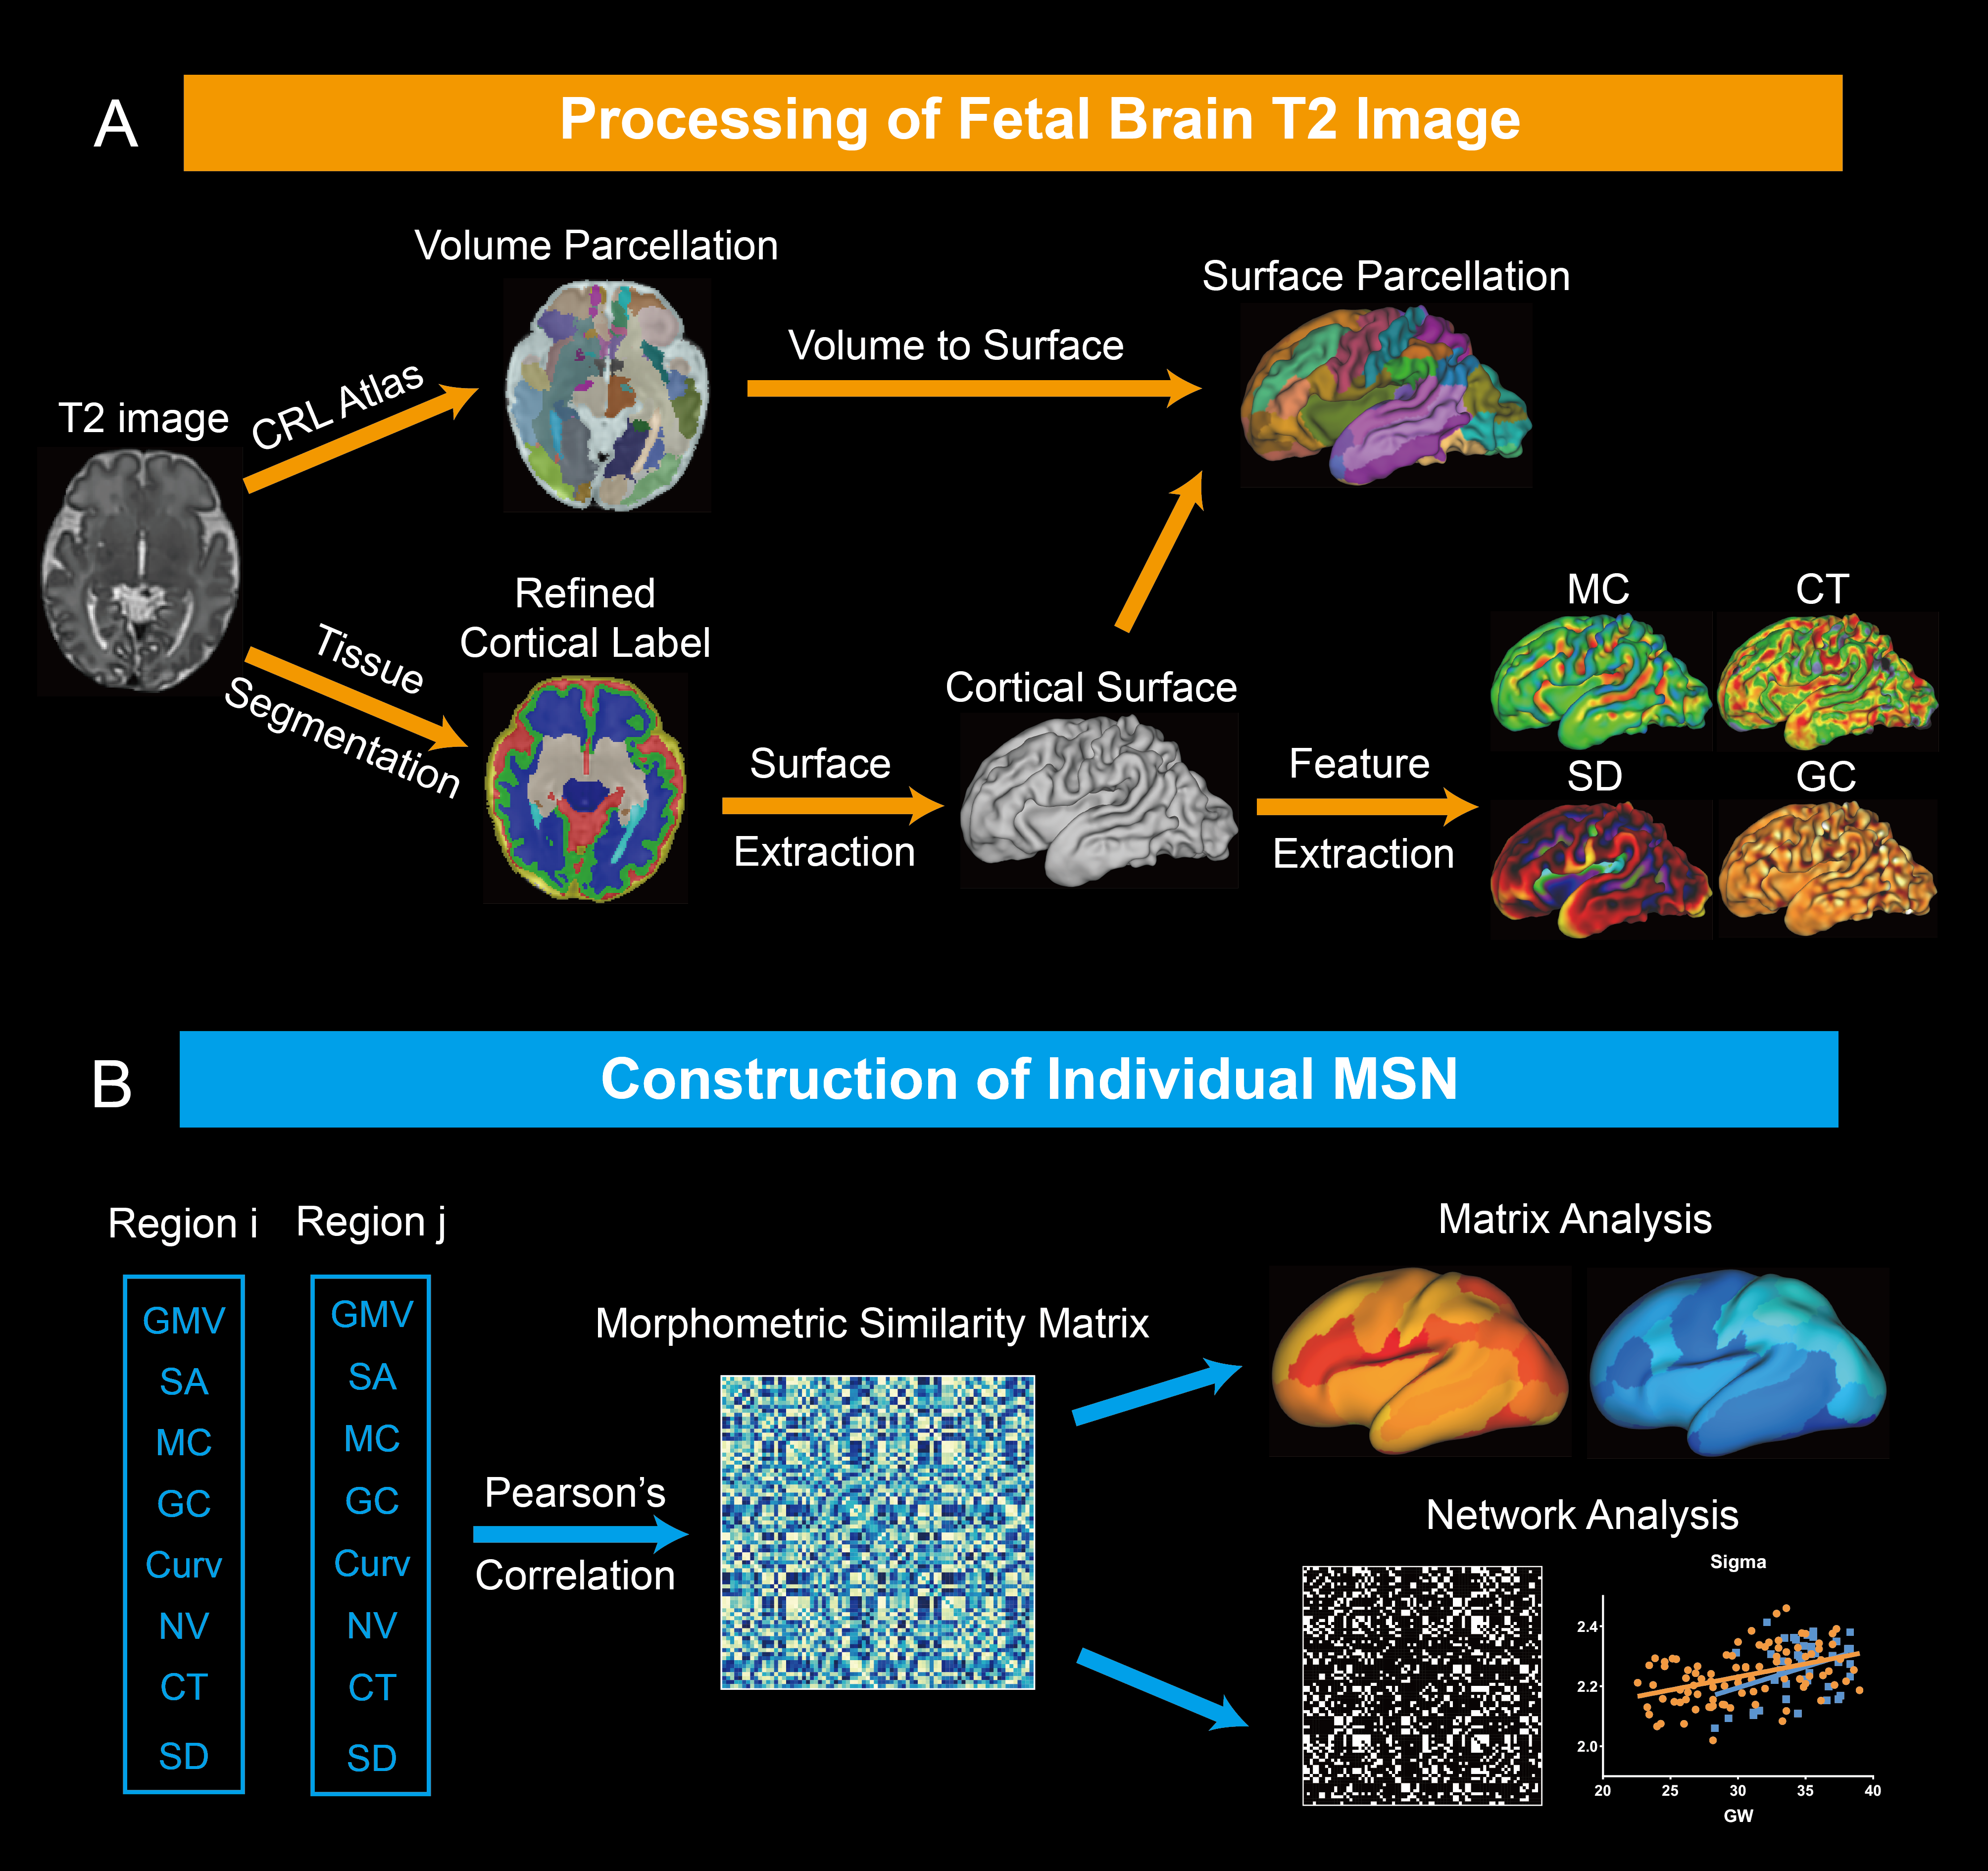
Data acquisition: We included 91 healthy fetuses with GA between 22.57-39 weeks in this study. T2-weighted images were acquired on 3.0 T Siemens MAGNEOM Skyra scanner with an 18-channel body coil using HASTE sequence. 3D brain volume at 0.8mm isotropic resolution was reconstructed from 2D multislice stacks using the slice-to-volume registration and super-resolution reconstruction pipeline in NiftiMIC [4, 5].The preprocessing was preformed using the modified dHCP-structural-pipeline[6] (Fig.1a). First, 3D brain volume was segmented into different tissues and cortical gray matter (cGM) label was manually refined. Then, the fetal cortex was parcellated into 78 regions utilizing the CRL atlas[7] via rigid, affine and SyN[8] registration in ANTs (Fig.1a). Cortical morphological features were extracted from each parcel, including gray matter volume, number of vertices on the cortical surface, mean curvature, gauss curvature, curvedness, sulcal depth and cortical thickness (Fig.1b).
We constructed individual morphometric similarity matrix (MSM) by calculating Pearson’s correlation coefficients between the vectors of normalized features between cortical regions. The effects of GA on MSM was analyzed at the edge, node and lobe levels, respectively. To construct MSN, MSM was binarized based on the 26%-35% sparsity, and 26% was the minimum sparsity to ensure no isolated node in the network. The network properties were computed based on GRETNA toolkit[9], including clustering coefficient (Cp); characteristic path length (Lp); small-worldness (sigma); global efficiency; local efficiency.
For validation, we also used 42 neonates from the dHCP dataset with PMA at scan between 28.29-38.29 weeks and compared the results with the fetal data.
Results
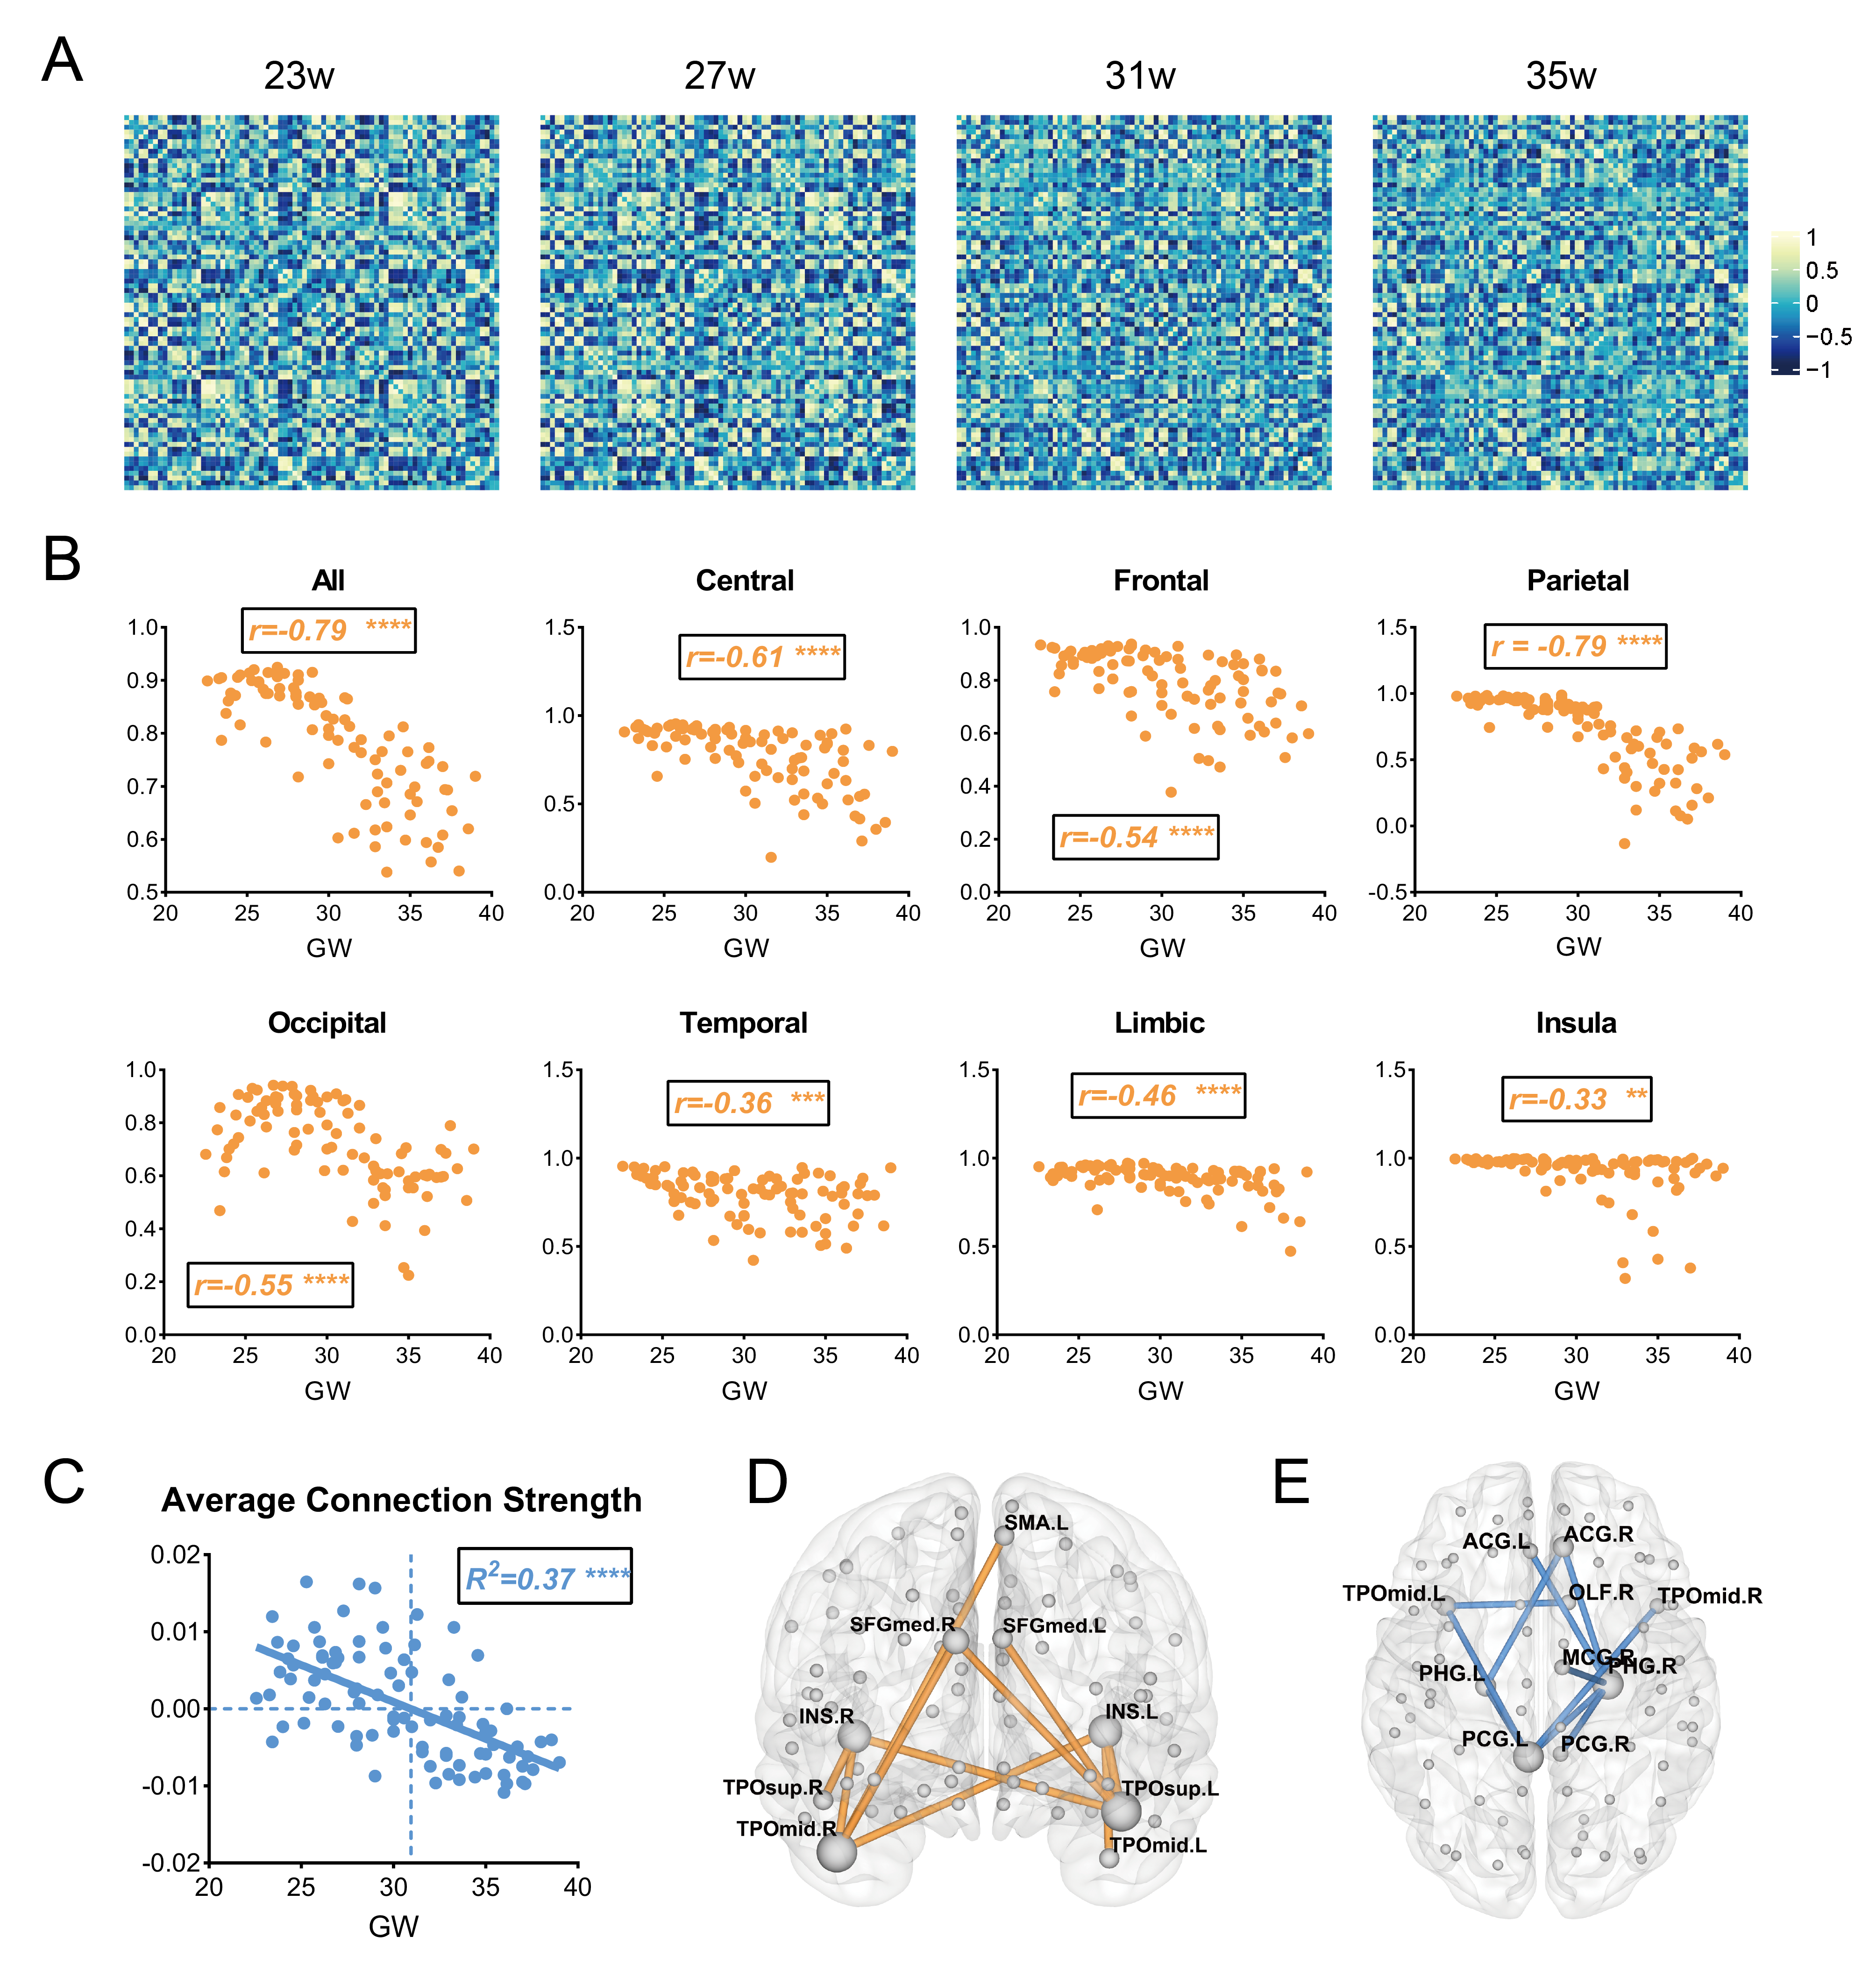
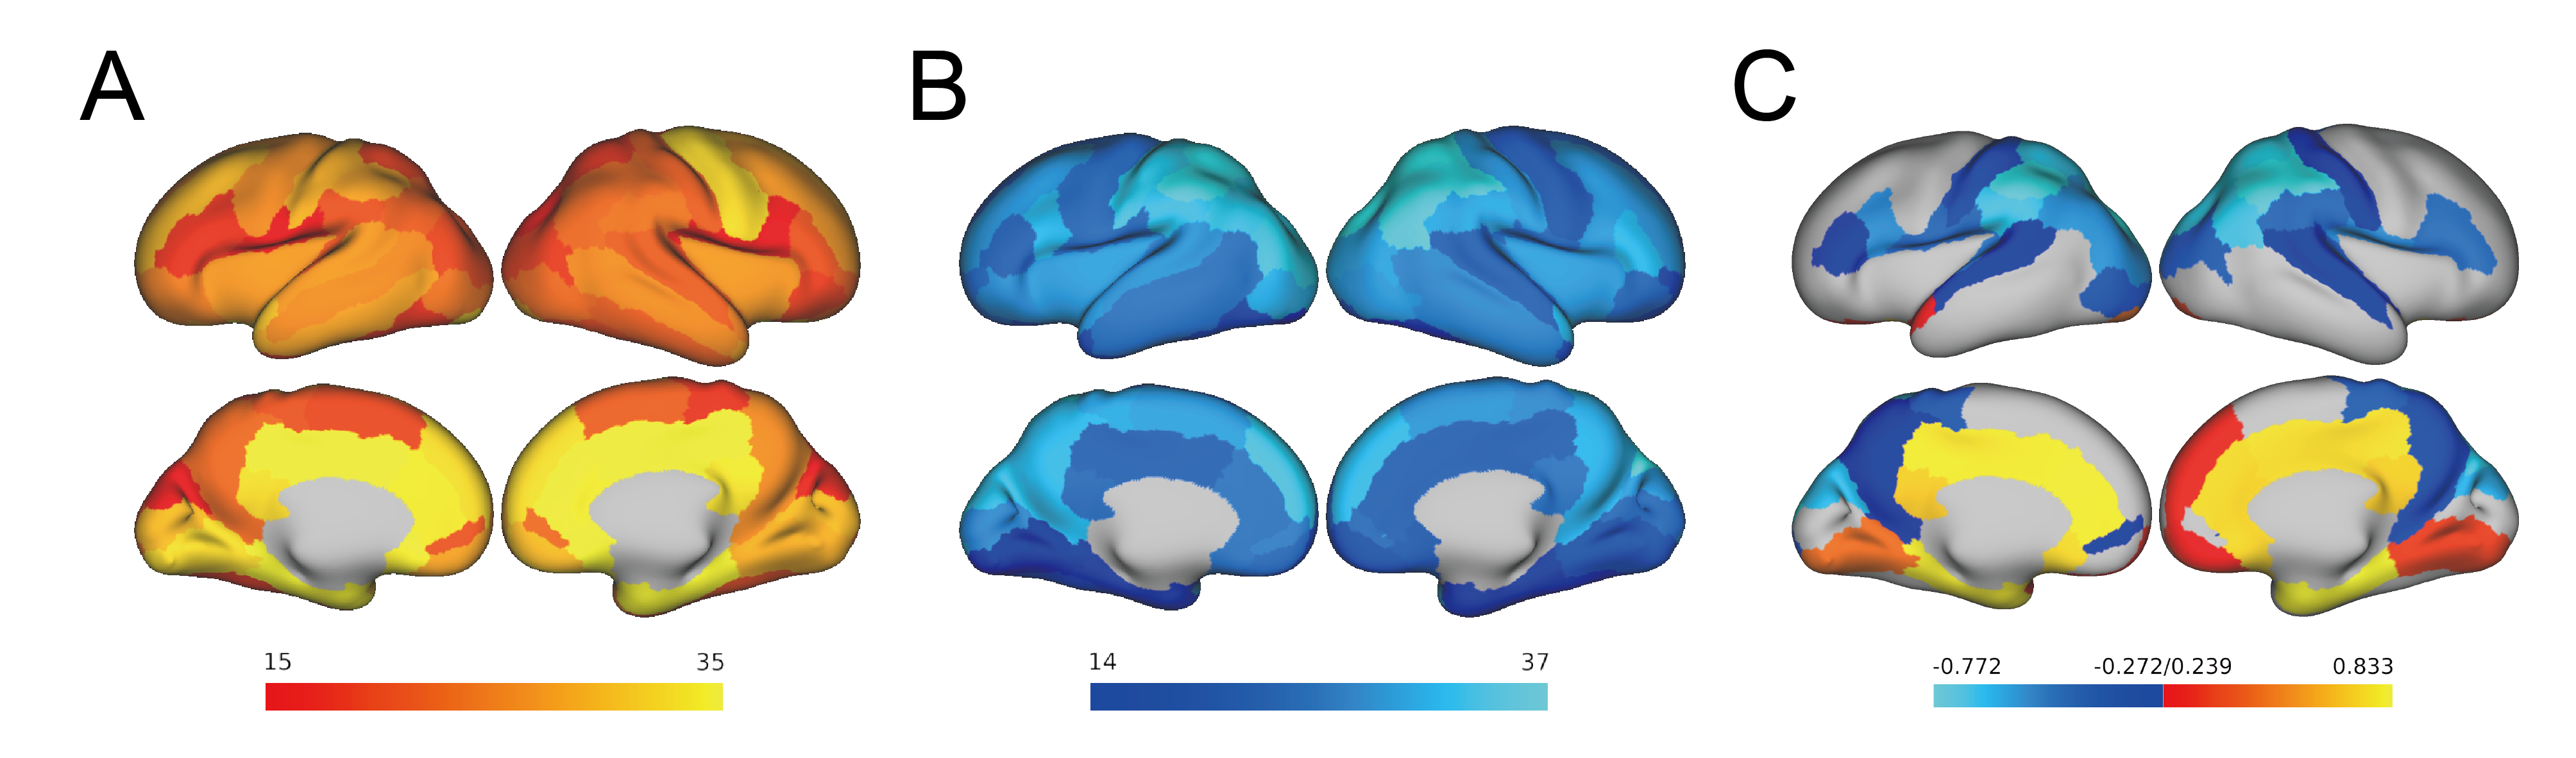
First, we observed a decline of whole-brain average connection strength and homologous connection strengths between hemispheres, especially for the parietal lobe (Fig. 2a-c), demonstrating that the morphology of contralateral homologous regions became more dissimilar with development. Linear regression analysis confirmed significant negative correlation between whole-brain average connection strength and GA (Fig.2c), suggesting the morphological differentiation in the whole brain. Further, we examined the effects of GA on all edges and found that edges with strongest positive correlations with GA mainly laid between the temporal poles and the insula or medial frontal regions (Fig.2d), while edges with strongest negative correlation mainly located between the limbic regions (Fig.2e). The number of edges with significant positive and negative correlations with GA (FDR<0.05) was higher in the limbic regions (Fig.3a) and the parieto-occipital regions (Fig.3b), respectively.At the node level, nodal strength (average of all edge strengths of the node) demonstrated both positive and negative correlations throughout the brain. 17 regions in the limbic and the prefrontal cortex were significantly positively correlated with GA (FDR<0.05), while 32 regions in the parieto-occipital and the frontal opercular cortex were negatively correlated with GA(Fig.3c).
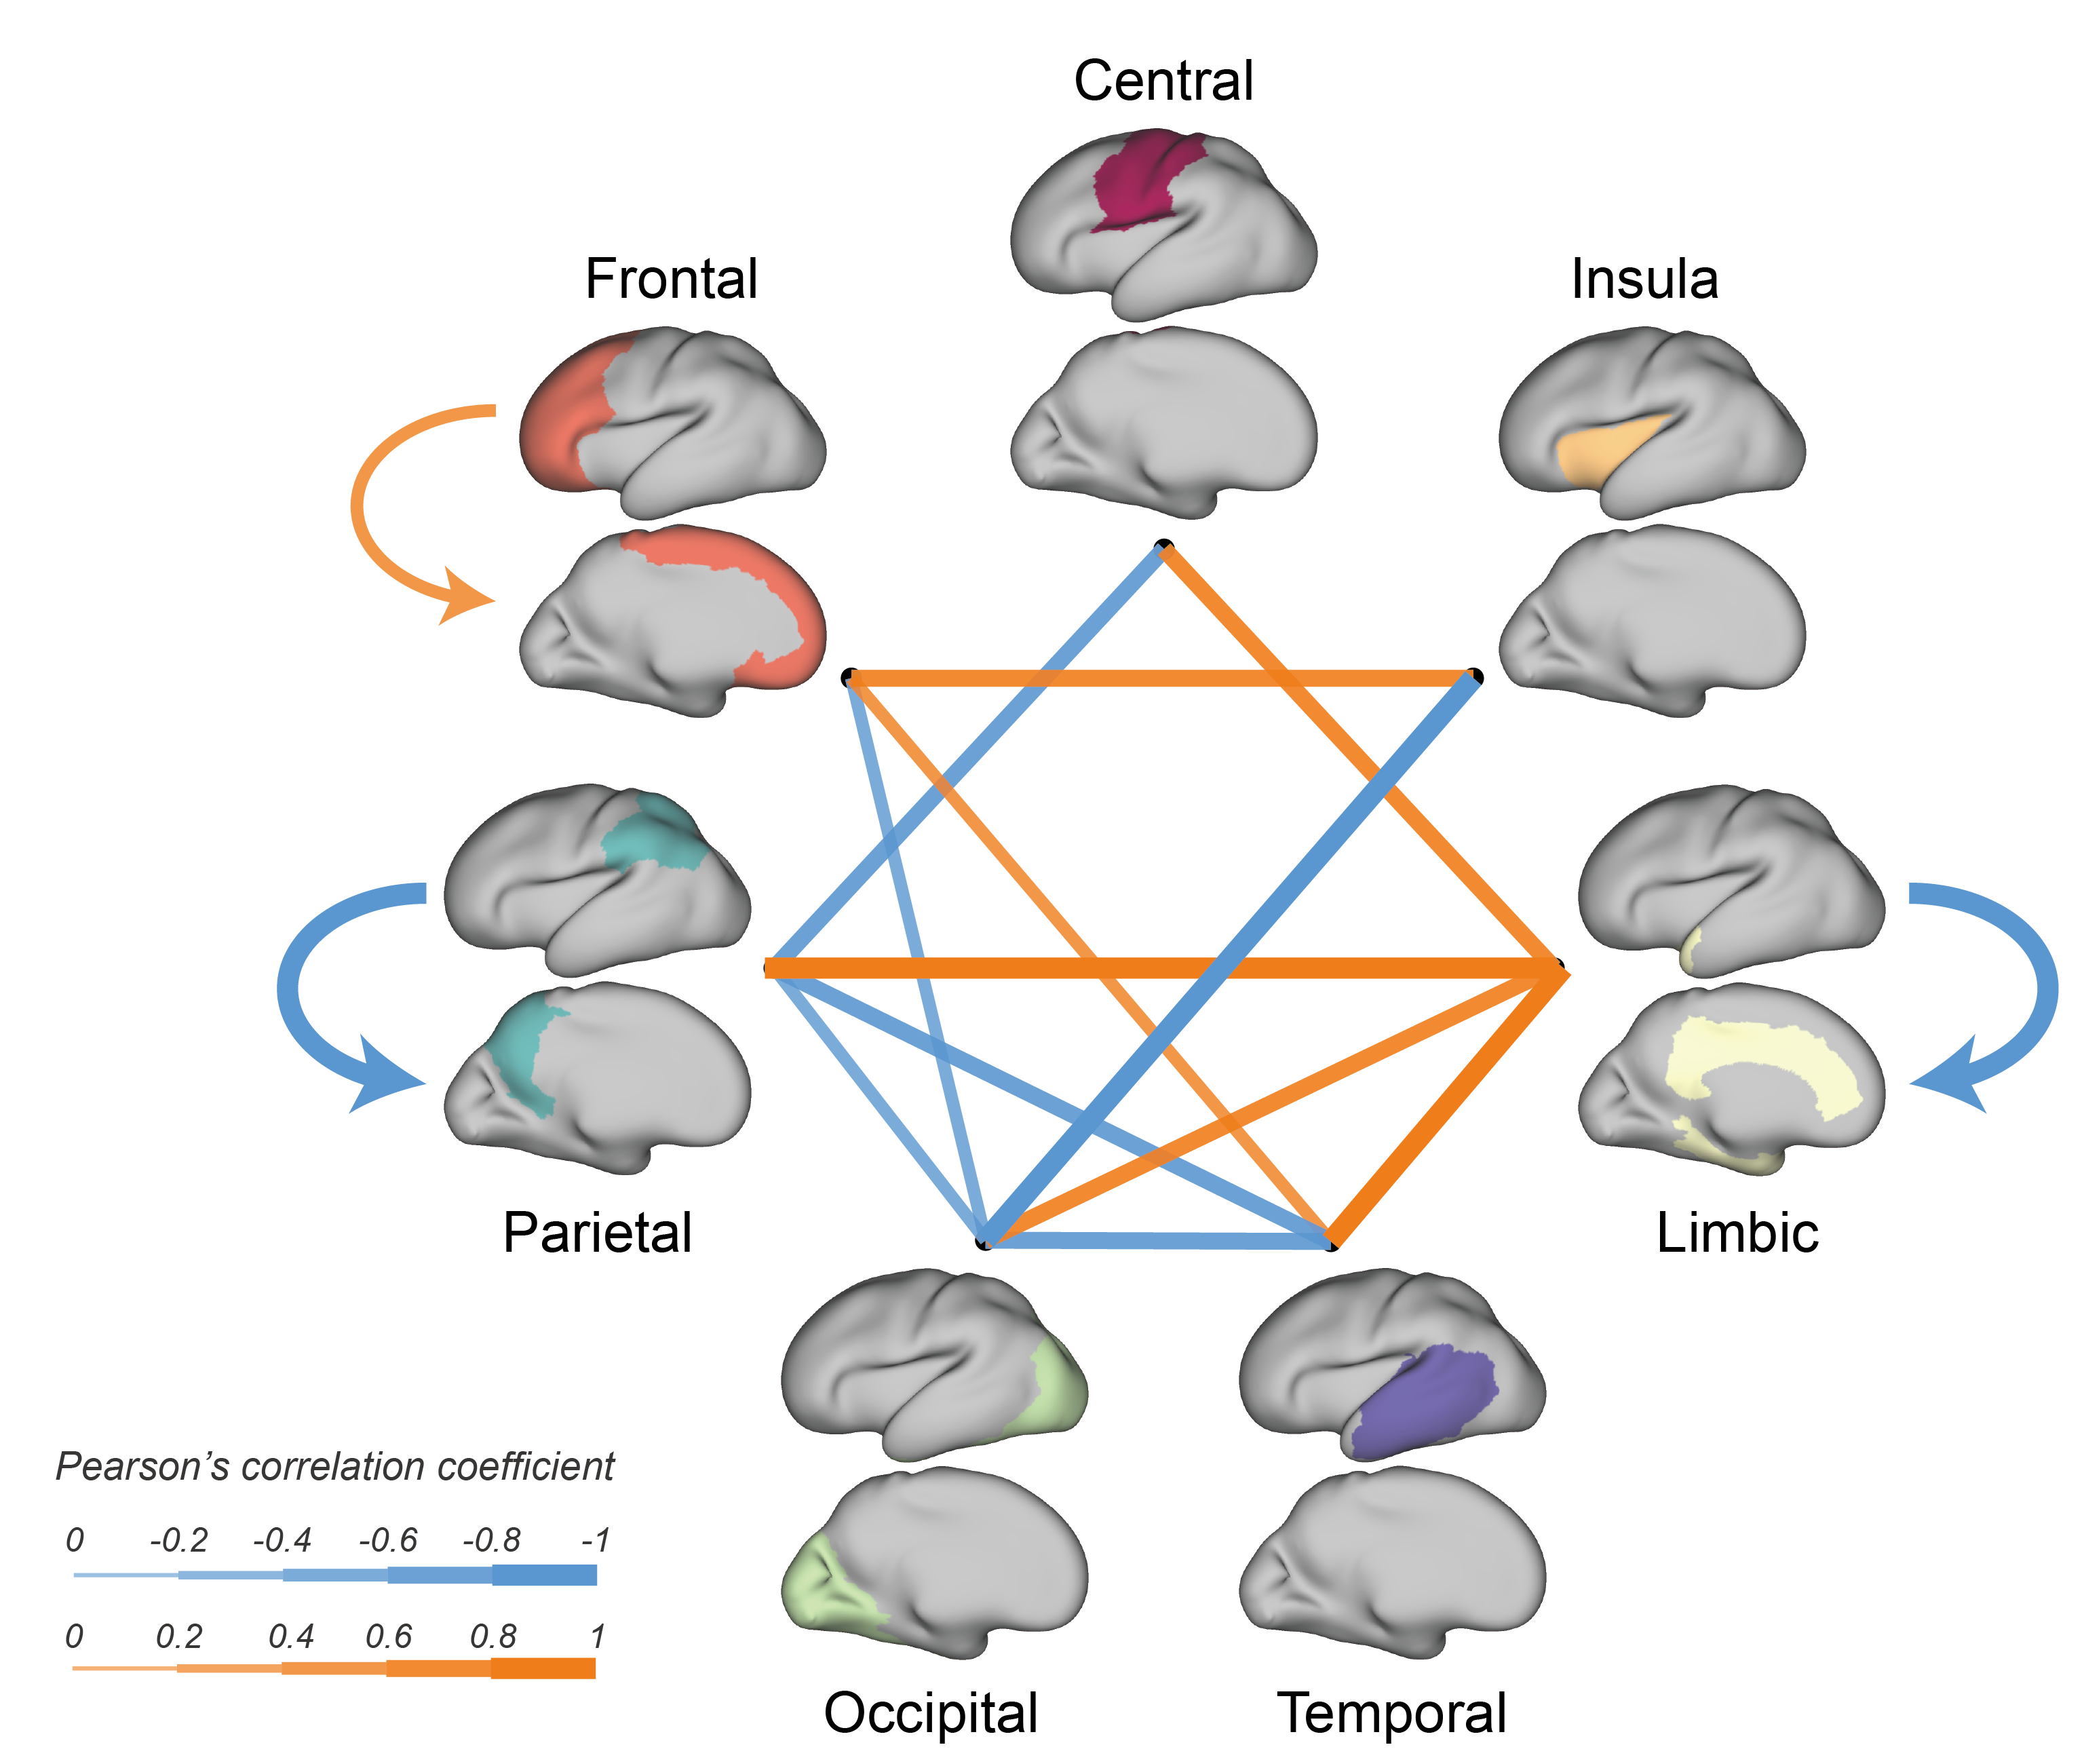
We further evaluated the effects of GA on intra- and inter-lobe connection strengths. The connections between the limbic lobe and other lobes significantly increased, while the connections between the parietal or occipital lobe and several other lobes significantly decreased (Fig.4).
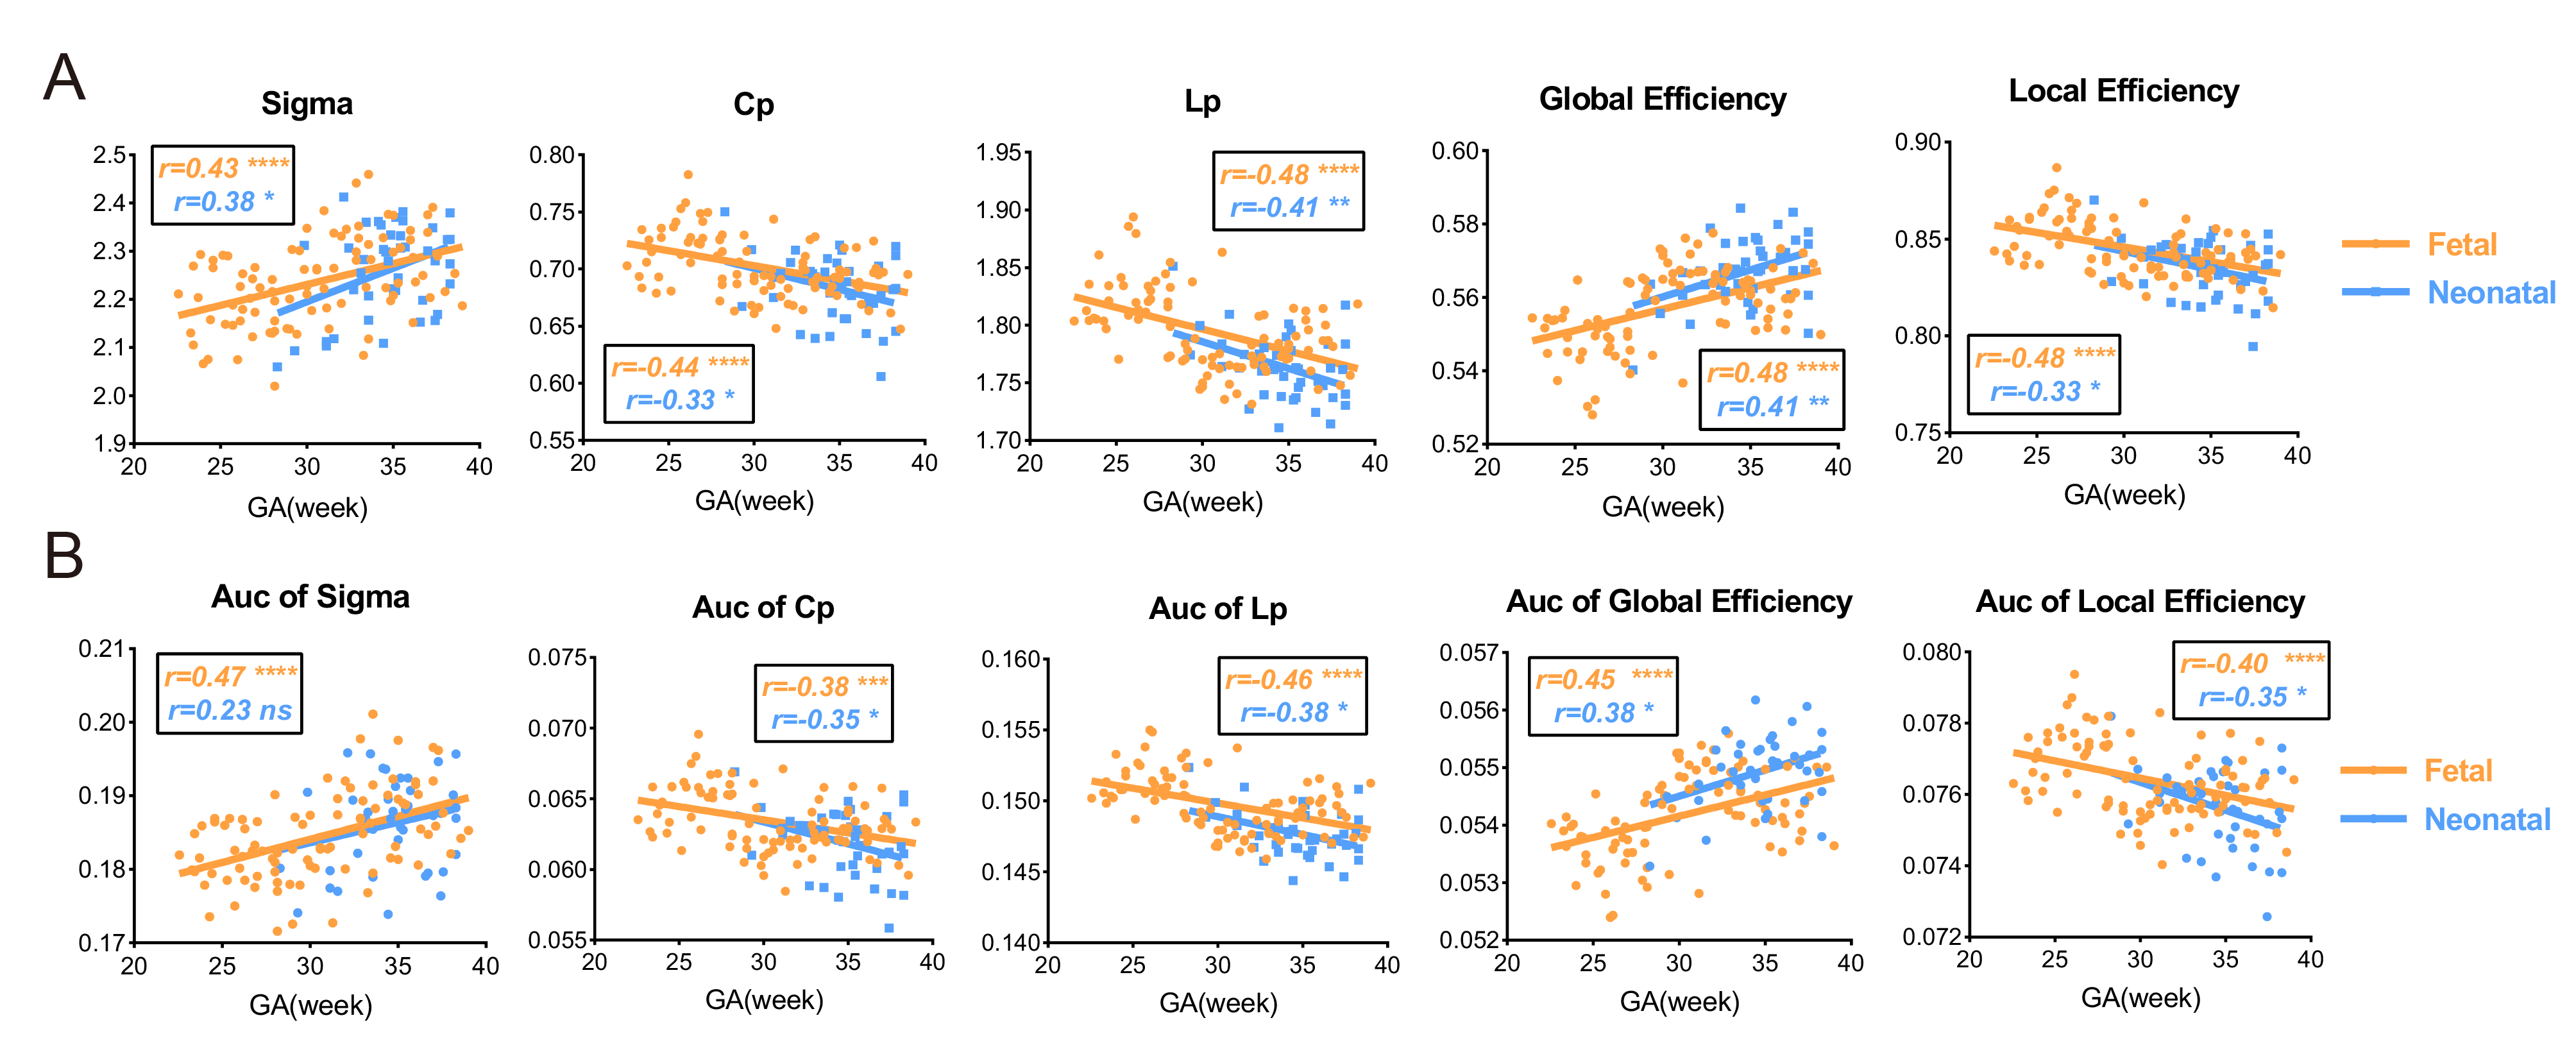
The development of network properties was demonstrated in Fig.5. All MSNs showed sigma>1, indicating small-world organization appeared before 22 weeks (earliest GA in our study) and further enhanced with the prenatal development (Fig.5a). We found that Cp, Lp and local efficiency significantly decreased with GA and global efficiency significantly increased (Fig.5a), suggesting enhanced integration and weakened segregation of the network. The AUC of each network property also showed the same pattern, indicating the results were not subject to the choice of sparsity (Fig.5b). Network properties obtained from the dHCP neonates were agreed well the fetal brain results.
Discussion and Conclusion
Based on in utero MRI data of fetal brain from 22.57 to 39 weeks, we constructed individual morphometric similarity network using multiple features. The decline of morphological symmetry between hemispheres indicated that cortical asymmetry portrayed in adult and infant studies[10-12] was already present and rapidly developed during the second-to-third trimester. The drastic changes of morphological connections in the limbic and parieto-occipital regions were also demonstrated in previous a neonatal study[3]. The existence of small-world property in morphological network suggested an efficient organization for information transformation in the fetal brain as early as 22 weeks[13]. The integration of fetal brain may related to the emergence of long-range cortico-cortical connections [14], and reduction of network segregation may be associated with the weakening of intra-modular connections[15]. These findings provided important evidence for us to understand the spatiotemporal development and reorganization of cortical morphological network during early development.Acknowledgements
This work was supported by the Ministry of Science and Technology of the People’s Republic of China (2018YFE0114600), the National Natural Science Foundation of China (61801424, 81971606, 82122032, 2021ZD0200202), and the Science and Technology Department of Zhejiang Province (202006140, 2022C03057).References
1. Li W, Yang C, Shi F, et al. Construction of individual morphological brain networks with multiple morphometric features. Front Neuroanat. 2017; 11
2. Seidlitz J, Váša F, Shinn M, et al. Morphometric similarity networks detect microscale cortical organization and predict inter-individual cognitive variation. Neuron. 2018; 97: 231-247.e237
3. Fenchel D, Dimitrova R, Seidlitz J, et al. Development of microstructural and morphological cortical profiles in the neonatal brain. Cereb Cortex. 2020; 30: 5767-5779
4. Ebner M, Wang G, Li W, et al. An automated framework for localization, segmentation and super-resolution reconstruction of fetal brain MRI. Neuroimage. 2020; 206: 116324
5. Tustison N J, Avants B B, Cook P A, et al. N4itk: Improved n3 bias correction. IEEE Trans Med Imaging. 2010; 29: 1310-1320
6. Makropoulos A, Robinson E C, Schuh A, et al. The developing human connectome project: A minimal processing pipeline for neonatal cortical surface reconstruction. Neuroimage. 2018; 173: 88-112
7. Gholipour A, Rollins C K, Velasco-Annis C, et al. A normative spatiotemporal MRI atlas of the fetal brain for automatic segmentation and analysis of early brain growth. Sci Rep. 2017; 7: 476
8. Avants B B, Epstein C L, Grossman M, et al. Symmetric diffeomorphic image registration with cross-correlation: Evaluating automated labeling of elderly and neurodegenerative brain. Med Image Anal. 2008; 12: 26-41
9. Wang J, Wang X, Xia M, et al. Gretna: A graph theoretical network analysis toolbox for imaging connectomics. Front Hum Neurosci. 2015; 9
10. Li G, Lin W, Gilmore J H, et al. Spatial patterns, longitudinal development, and hemispheric asymmetries of cortical thickness in infants from birth to 2 years of age. J Neurosci. 2015; 35: 9150-9162
11. Maingault S, Tzourio-Mazoyer N, Mazoyer B, et al. Regional correlations between cortical thickness and surface area asymmetries: A surface-based morphometry study of 250 adults. Neuropsychologia. 2016; 93: 350-364
12. Hill J, Dierker D, Neil J, et al. A surface-based analysis of hemispheric asymmetries and folding of cerebral cortex in term-born human infants. J Neurosci. 2010; 30: 2268-2276
13. Cao M, He Y, Dai Z, et al. Early development of functional network segregation revealed by connectomic analysis of the preterm human brain. Cereb Cortex. 2016; 27: 1949-1963
14. Rubinov M, Sporns O. Complex network measures of brain connectivity: Uses and interpretations. Neuroimage. 2010; 52: 1059-1069
15. Xu F, Liu M, Kim S Y, et al. Morphological development trajectory and structural covariance network of the human fetal cortical plate during the early second trimester. Cereb Cortex. 2021; 31: 4794-4807
Figures