2346
Ultra-high-field 7T Neonatal Proton MRS and Metabolite Relaxation Times1MR Physics group, Radiology Department, Great Ormond Street Hospital, London, United Kingdom, 2Centre for the Developing Brain, School of Biomedical Engineering and Imaging Sciences, King’s College London, London, United Kingdom, 3London Collaborative Ultra high field System (LoCUS), King’s College London, London, United Kingdom, 4MR Physics Group, Department of Medical Physics and Clinical Engineering, Swansea Bay University Health Board, Swansea, United Kingdom, 5MR Physics, Guys and St Thomas’ NHS Foundation Trust, London, United Kingdom, 6Guys and St Thomas’ NHS Foundation Trust, London, United Kingdom, 7Biomedical Engineering Department, School of Biomedical Engineering and Imaging Sciences, King’s College London, London, United Kingdom, 8MR Research Collaborations, Siemens Healthcare Limited, Frimley, United Kingdom, 9MRC Centre for Neurodevelopmental Disorders, King’s College London, London, United Kingdom
Synopsis
Keywords: Neonatal, Spectroscopy, 7T, ultra-high field
We present 1H-MRS results from a pilot cohort of newborn infants, acquired on a 7T system. Whilst a customised approach is required for patient preparation and sequence calibrations, our preliminary data points to highly improved sensitivity and data quality at ultra-high field compared to typical spectra from adults at the same field or newborn infants at lower field strengths. We also report initial estimates of T1 and T2 for the main metabolites in the neonatal brain at 7T.Introduction
Advantages in sensitivity and spectral resolution of ultra-high-field for 1H-MRS are well documented1-2. Whilst the first human 7T 1H-MRS dates back to 20013, only 2 accounts exist of MRI/MRS of newborn infants at ultra-high-field4-6.We present 7T newborn MRS data and discuss preparation/calibration and signal quality optimisation. We also measured 7T neonatal T1 and T2 metabolite relaxation times as these are unknown and required for appropriate sequence-parameter optimisation.
Methods
Subjects and MR parameters. Four newborn infants [Table_1] were scanned at 7T (MAGNETOM Terra, Siemens Healthcare, Erlangen, Germany; 1TX-32RX head coil, Nova Medical, MA, USA) with parental consent (NHS ethics approval: 19/LO/1384). Following a neonate-specific risk assessment7, a locally modified safety model was implemented to enforce conservative operating limits of specific-absorption-rate (SAR) 2.8 times lower than for adults.Infants were positioned in the head coil head during natural sleep. Dental putty and cushioning provided hearing protection8. Temperature, heart rate and oxygen saturation were monitored throughout the scan (Philips-Invivo Expression MR400)9. MRS was performed towards the end of 1-hr long scanning session, with the product STEAM10 single-voxel sequence (svs_st) with TM=10ms, BW=4000Hz, 2048 points and CHESS water suppression (4 repeats were acquired without this). TE/TR were initially set to TE=20ms and TR=3000ms, with additional acquisitions to estimate metabolite T1 and T2 in baby-4 following the methodology in Kreis et al. 199311 [Table_2]. Voxels-of-interest (VOI, 4.1ml=(16mm)3) were placed in the left thalamus/basal-ganglia [Figure_2].
B0-shimming. The product 3D-GRE-Brain B0-shimming routine was employed in babies 1-3. In baby-4, manual shimming was additionally performed.
Tx/B1-calibration. Given high in-vivo B1 inhomogeneity at ultra-high-field, Tx/B1-calibration on the chosen VOI is essential. The product calibration routine sets the voltage from which all other pulses are scaled (RFcal) based on B1-measurements on 3 trans-axial slices (30mm spacing). This method cannot provide appropriate flip angles in arbitrary-positioned VOIs. Moreover, to control SAR, the svs_st sequence automatically adjusts RF-pulses duration depending on the calibration voltage.
Hence the following Tx/B1-calibration method was devised:
(1)-A custom12 STEAM sequence13 was used to calibrate the RFcal providing maximum signal for a 2ms-duration 7-lobe-sinc RF-pulse (matching svs_st RF-pulses) for each VOI.
(2)-Using the Siemens sequence simulator a look-up table was prepared indicating the best voltage (adjRFcal) to input for any calibrated RFcal value. NB: as pulse durations ‘jump’ by 0.2 ms at certain boundary voltages an error of <= 5% with respect to ‘ideal’ calibration values can occur.
(3)- Such adjRFcal was manually used as RF-calibration value in svs_st.
Metabolite concentration estimation. Pre-processing of ‘raw’ MRS data used Suspect-MRS14 including optimal channel-combination15, eddy current correction, spectral registration and outlier rejection16. LCModel17 was used for fitting with basis sets generated by Tarquin (brain+Gly+Glth)18.
Results
The SAR for the TR=3000ms acquisition was 11-13% of the allowed neonatal limit. Figure_1 shows spectra from all four babies.Linewidths were 11.6Hz, 11.6Hz, 13.7Hz, 4.8Hz respectively for the 4 infants, and corresponding SNR were 18, 28, 23, 31 (half acquisition time). In all cases, LCModel estimated %SD (Cramer-Rao-lower-bounds) were <=13% for all main metabolites including total Choline (tCho), Creatine (tCr), NAA+NAAG (tNAA), Myo-inositol (Ins), Glutamate, Glutamine, GABA, Glutathione (Glth) and Taurine. For the optimised acquisition (baby-4), taking an ever increasing number of averages, shows a plateau of concentrations and %SD for >=32 averages [Figure_2 and Figure_3].
Metabolites 7T T1 values in baby-4 were estimated to be 1290ms, 1000ms, 1280ms, 2550ms for tCr, tCho, tNAA and myo-Inositol respectively (water T1 estimated at ~2400ms); corresponding T2 estimates were 100ms, 131ms, 122ms, 123ms.
Discussion
Our initial experience in performing MRS on newborn babies on a 7T system demonstrates extremely-high spectral quality in 5-minute acquisitions even without custom calibrations providing reliable quantification of tCho, tCr, tNAA, Myo-inositol, Glutamate, Glutamine, GABA, Glutathione and Taurine.The product STEAM sequence was used as widely-employed custom MRS sequences allowing user-defined RF-pulse durations and easy-to-use RF-calibration routines12 could not be used due to SAR constraints.
Using the product sequence requires designing a customised RF-pulse calibration process. Our fully-calibrated dataset provided significant additional gains in spectral quality and resolution achieving SNR of 19 in 8 averages (24”), and very stable quantification above 32 averages (96seconds). This is also enabled by the narrower-than adults linewidth in neonatal parenchyma (also observed at lower-fields), allowing a linewidth of ~5Hz compared to a minimum of 12Hz typical in adults at 7T3. The potential of measuring GABA, Glutamate, Glutamine levels in the neonatal brain in ~1.5minutes for a 4.1ml voxel (compared to 10.7 minutes for a 16ml voxels at 3T19) will be extremely valuable for future studies, such as those looking at excitatory/inhibitory imbalance in neurodevelopmental disorders20-21.
We also present the first 7T neonatal metabolite T1 and T2 estimates at 7T, as only measurement at fields <=3T were published11,22-25. Whilst these need verification in larger cohorts, they suggest potential further SNR gains are possible by optimising TE/TR/flip-angle combinations.
Conclusions
With specific customisation and calibrations neonatal ultra-high-field 7T MRS provides unprecedented spectral quality and signal to noise ratios unachievable at lower field strengths suggesting robust metabolite estimations of neuroscience-relevant metabolites can be performed within 1-2 minutes.Acknowledgements
This work was supported by a project grant awarded by Action Medical Research [GN2728], a Wellcome Trust Collaboration in science award [WT201526/Z/16/Z], by core funding from the Wellcome/EPSRC Centre for Medical Engineering [WT203148/Z/16/Z] and by the National Institute for Health Research (NIHR) Biomedical Research Centre based at Guy’s and St Thomas’ NHS Foundation Trust and King’s College London and/or the NIHR Clinical Research Facility. The views expressed are those of the author(s) and not necessarily those of the NHS, the NIHR or the Department of Health fand Social Care. TA was supported by funding from a Medical Research Council (MRC) Translation Support Award [MR/V036874/1]. ADE and TA received funding support from the MRC Centre for Neurodevelopmental Disorders, King’s College London [MR/N026063/1]. Pre-study safety testing of the Invivo Expression MR400 monitor was done in collaboration with Philips Healthcare.
The STEAM sequence used for B1-calibration was developed by Edward J. Auerbach and Małgorzata Marjańska and provided by the University of Minnesota under a C2P agreement.
References
1. Gruetter R, Weisdorf SA, Rajanayagan V, Terpstra M, Merkle H, Truwit CL, Garwood M, Nyberg SL, Ugurbil K. Resolution improvements in in vivo 1H NMR spectra with increased magnetic field strength. J Magn Reson 1998; 135: 260–264.
2. Tkác I, Oz G, Adriany G, Uğurbil K, Gruetter R. In vivo 1H NMR spectroscopy of the human brain at high magnetic fields: metabolite quantification at 4T vs. 7T. Magn Reson Med. 2009 Oct;62(4):868-79. doi: 10.1002/mrm.22086. PMID: 19591201; PMCID: PMC2843548.
3. Tkac I, Andersen P, Adriany G, Merkle H, Ugurbil K, Gruetter R. In vivo 1H NMR spectroscopy of the human brain at 7 T. Magn Reson Med 2001; 46: 451–456
4. E. De Vita, A. Bainbridge, J.L.Y Cheong, P. Kinchesh, A. Huertas-Ceballos, R.J. Ordidge, N.J. Robertson, E.B. Cady, Localised 4.7 Tesla proton magnetic resonance spectroscopy in neonatal encephalopathy: implementation, safety, and preliminary interpretation of results. Imaging Decisions 9(4):31-41 (2005).
5. De Vita E, Bainbridge A, Cheong JLY, Hagmann C, Lombard R, Chong WK, Wyatt JS, Cady EB, Ordidge RJ, Robertson NJ. Magnetic resonance imaging of neonatal encephalopathy at 4.7 Tesla: initial experiences. Pediatrics 2006;118(6):e1812-21
6. Annink K V., Van Der Aa NE, Dudink J, Alderliesten T, Groenendaal F, Lequin M, et al. Introduction of Ultra-High-Field MR Imaging in Infants: Preparations and Feasibility. Am J Neuroradiol. 2020;41(8):1532–7.
7. Malik, S. J., Hand, J. W., Satnarine, R., Price, A. N. & Hajnal, J. V. Specific absorption rate and temperature in neonate models resulting from exposure to a 7T head coil. Magn. Reson. Med. 86, 1299–1313 (2021).
8. Hughes, E. J. et al. A dedicated neonatal brain imaging system. Magn. Reson. Med. 78, 794–804 (2017).
9. Philips. Expression MR400 [Internet]. [cited 2022 Oct 8]. Available from: https://www.philips.co.uk/healthcare/product/HC866185/expression-mr400#specifications
10. Frahm J, Merboldt K-D, Hänicke W. Localized proton spectroscopy using stimulated echoes. J Magn Reson 1987; 72:502-508.
11. Kreis R, Ernst T, Ross BD. Development of the human brain: in vivo quantification of metabolite and water content with proton magnetic resonance spectroscopy. Magn Reson Med. 1993 Oct;30(4):424-37. doi: 10.1002/mrm.1910300405. PMID: 8255190.
12. M Marjanska, EJ Auerback, D Deelchand, https://www.cmrr.umn.edu/spectro/
13. Tkáč I, Starcuk Z, Choi IY, Gruetter R. In vivo 1H NMR spectroscopy of rat brain at 1 ms echo time. Magn Reson Med. 1999;41:649-56.
14. Rowland B et al., https://github.com/openmrslab/suspect and https://suspect.readthedocs.io/en/latest/
15. Rodgers CT, Robson MD. Coil combination for receive array spectroscopy: Are data-driven methods superior to methods using computed field maps? Magn Reson Med. 2016 Feb;75(2):473-87. doi: 10.1002/mrm.25618. Epub 2015 Mar 28.
16. Near, J., Harris, A. D., Juchem, C., Kreis, R., Marjańska, M., Öz, G., et al. (2020). Preprocessing, analysis and quantification in single‐voxel magnetic resonance spectroscopy: experts’ consensus recommendations. NMR in Biomedicine, 29, 323–23.
17. Provencher SW. Estimation of metabolite concentrations from localized in vivo proton NMR spectra. Magn Reson Med. 1993 Dec;30(6):672-9. doi: 10.1002/mrm.1910300604. PMID: 8139448
18. Wilson M, Reynolds G, Kauppinen RA, Arvanitis TN, Peet AC. A constrained least-squares approach to the automated quantitation of in vivo ¹H magnetic resonance spectroscopy data. Magn Reson Med. 2011 Jan;65(1):1-12. doi: 10.1002/mrm.22579.
19. Yanez-Lopez M, Price AN, Puts NAJ, Hughes EJ, Edden RAE, McAlonan GM, Arichi T, De Vita E. Simultaneous quantification of GABA, Glx and GSH in the neonatal human brain using magnetic resonance spectroscopy. Neuroimage. 2021 Jun;233:117930. doi: 10.1016/j.neuroimage.2021.117930. Epub 2021 Mar 9. PMID: 33711485; PMCID: PMC8204265.
20. Ajram LA, Pereira AC, Durieux AMS, Velthius HE, Petrinovic MM, McAlonan GM. The contribution of [1H] magnetic resonance spectroscopy to the study of excitation-inhibition in autism. Prog Neuropsychopharmacol Biol Psychiatry. 2019 Mar 8;89:236-244. doi: 10.1016/j.pnpbp.2018.09.010. Epub 2018 Sep 21. PMID: 30248378.
21. Gaetz W, Bloy L, Wang DJ, Port RG, Blaskey L, Levy SE, Roberts TP. GABA estimation in the brains of children on the autism spectrum: measurement precision and regional cortical variation. Neuroimage. 2014 Feb 1;86:1-9. doi: 10.1016/j.neuroimage.2013.05.068. Epub 2013 May 24. PMID: 23707581.
22. Lally PJ (2018) Magnetic resonance spectroscopy in hypoxic ischaemic encephalopathy. Published, Imperial College London
23. Cady EB (1996) Metabolite concentrations and relaxation in perinatal cerebral hypoxic-ischemic injury. Neurochem Res 21:1043–1052
24. Cheong JL et al (2006) Proton MR spectroscopy in neonates with perinatal cerebral hypoxic-ischemic injury: metabolite peak-area ratios, relaxation times, and absolute concentrations. AJNR Am J Neuroradiol 27:1546–1554
25. Cady EB et al (1996) Lactate, N-acetylaspartate, choline and creatine concentrations, and spin-spin relaxation in thalamic and occipito-parietal regions of developing human brain. Magn Reson Med 36:878–886
Figures
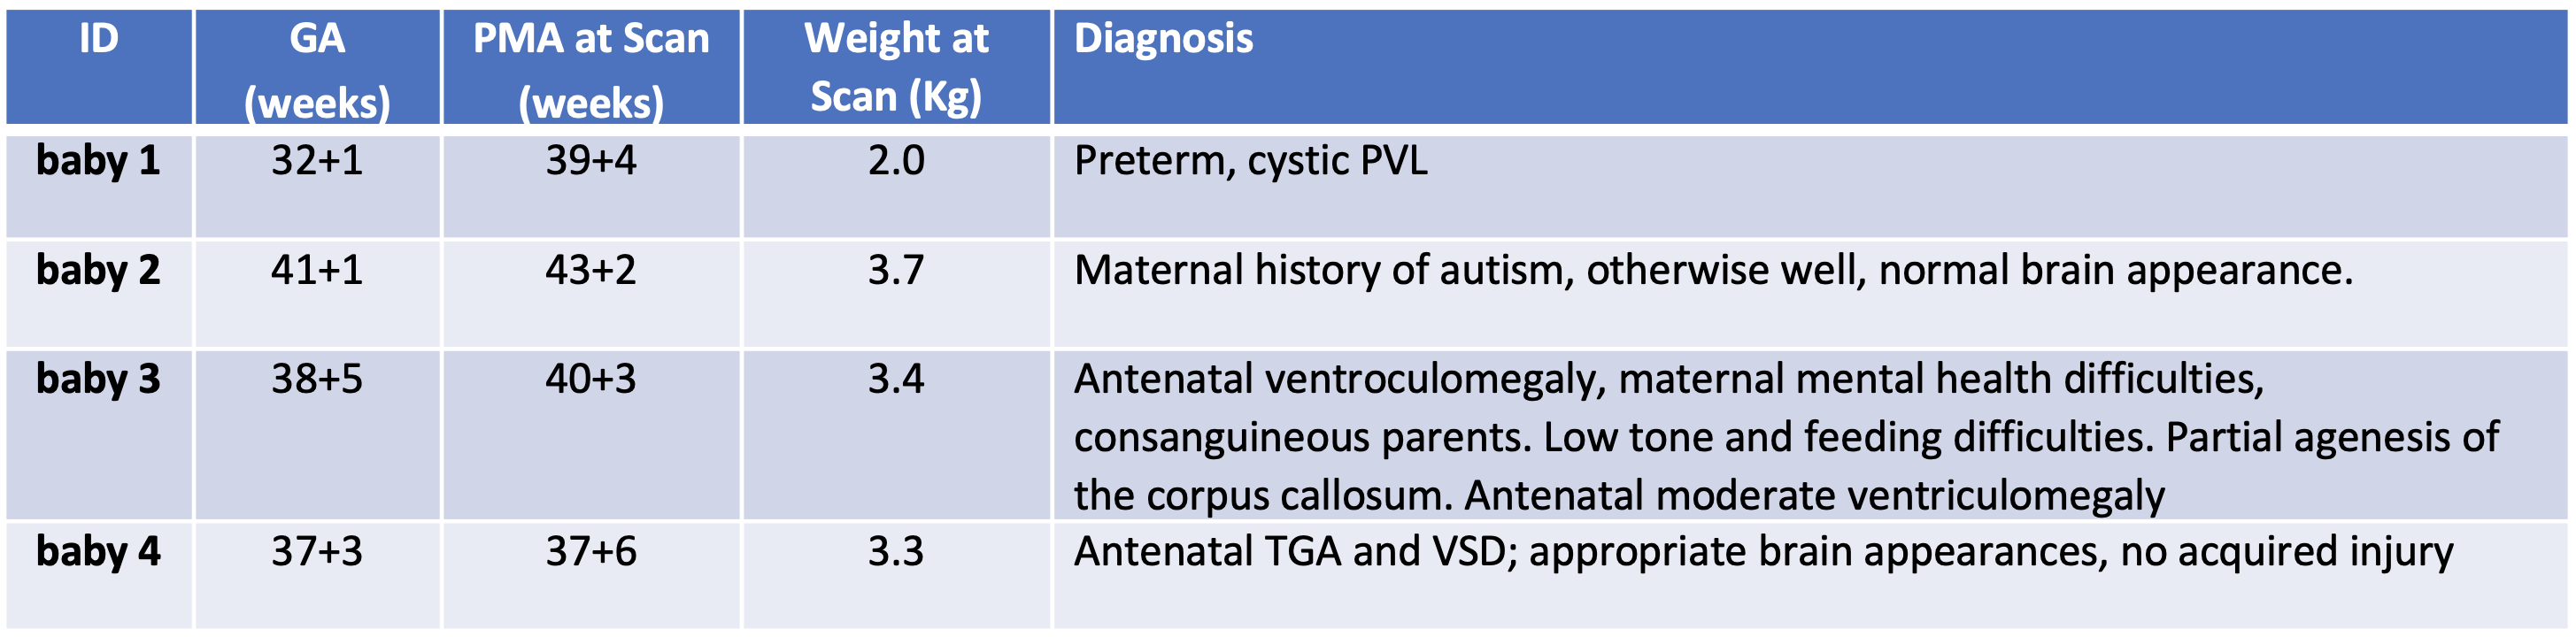
Table 1. Gestational Age at birth (GA), post-menstrual age at scan (PMA), weight at scan and diagnosis for the 4 babies scanned. The median GA/PMA were 38.1/40 weeks.
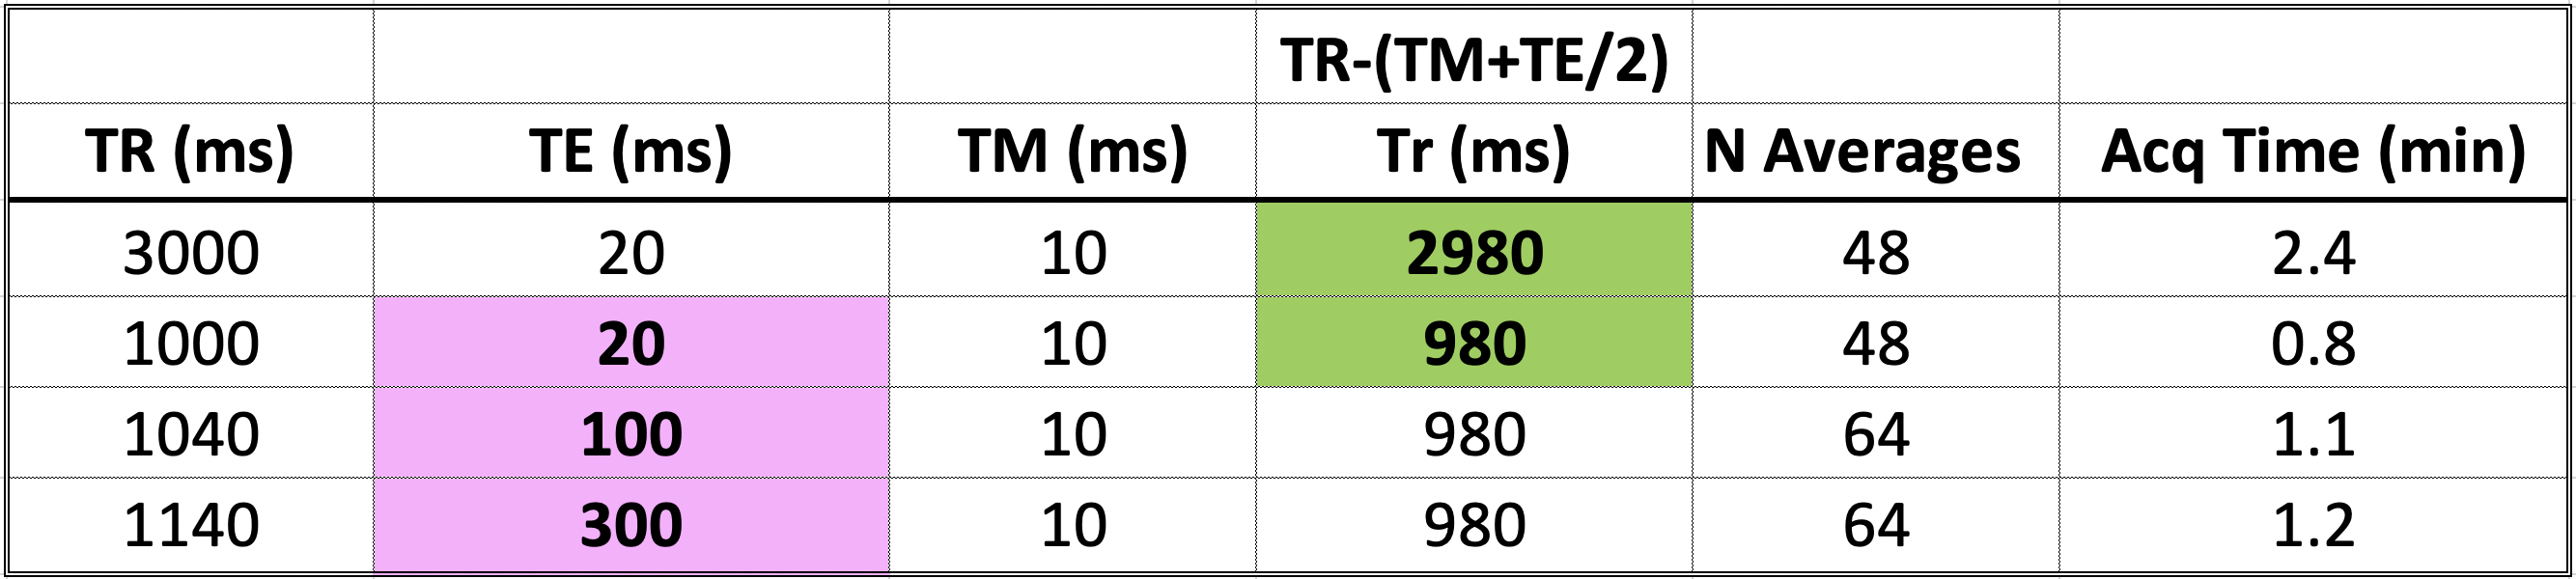
Table 2. Acquisition parameters for single-voxel STEAM for baby-4 with TR and TE varied to measure metabolite T1 (green) and T2 (pink) according to Kreis_199311. To estimate T2 as an exponential decay time-constant from varying-TE measurements, the corresponding TR was set to ensure constant ‘recovery time Tr’ between acquisitions, as in STEAM: Tr=TR-(TE/2 +TM). T1 estimates were obtained from measurements with fixed TE and different TR/Tr using the ‘saturation recovery’ equation11. NB: for the product STEAM min/Max TE were 20/300ms and min/Max TR=1060/10000ms for TE=300ms.
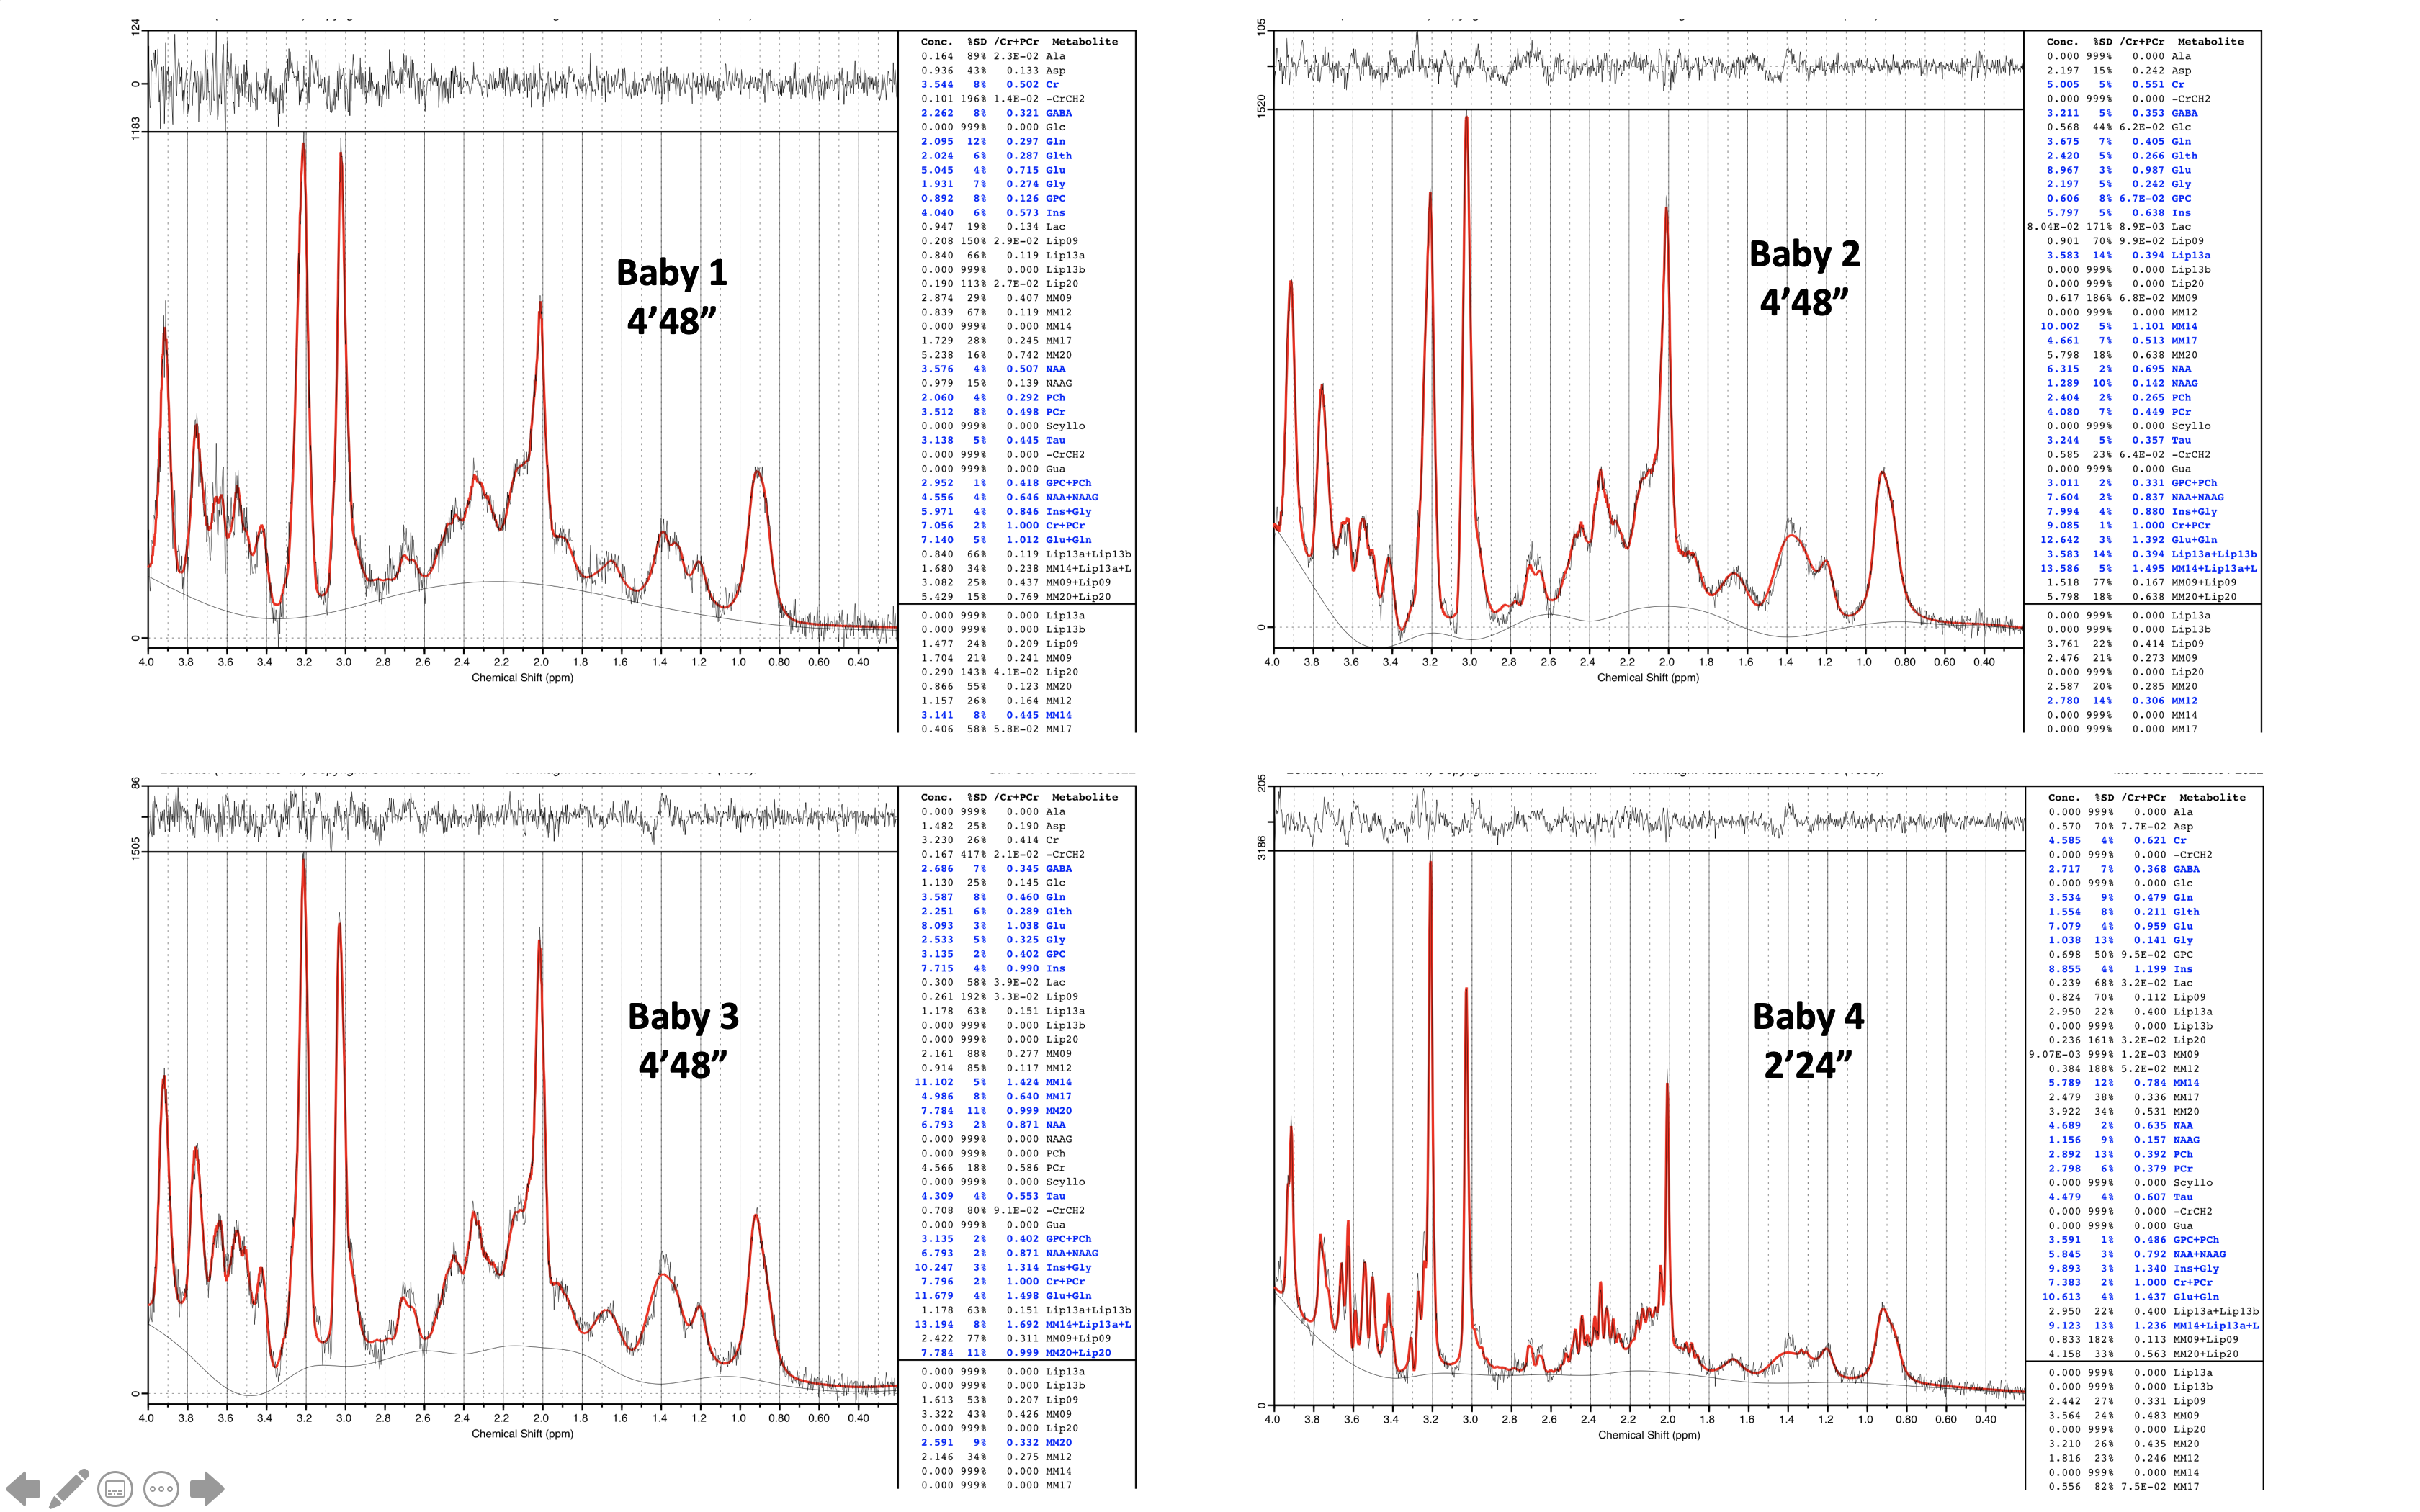
Figure 1. STEAM (TE=20ms, TR=3s) spectra from all 4 babies scanned. Datasets for babies 1-3 were acquired with 96 averages. The dataset for baby 4 (optimised Tx calibration, manual shimming) only had 48 averages. Outlier rejection removed 14, 3, 0, 0 averages, respectively for the 4 datasets, hence spectra/fits with a total of 82, 93, 96, 48 averages are displayed. Metabolites with Cramer-Rao-Lower-COunds %SD <=15% are displayed in bold blue.
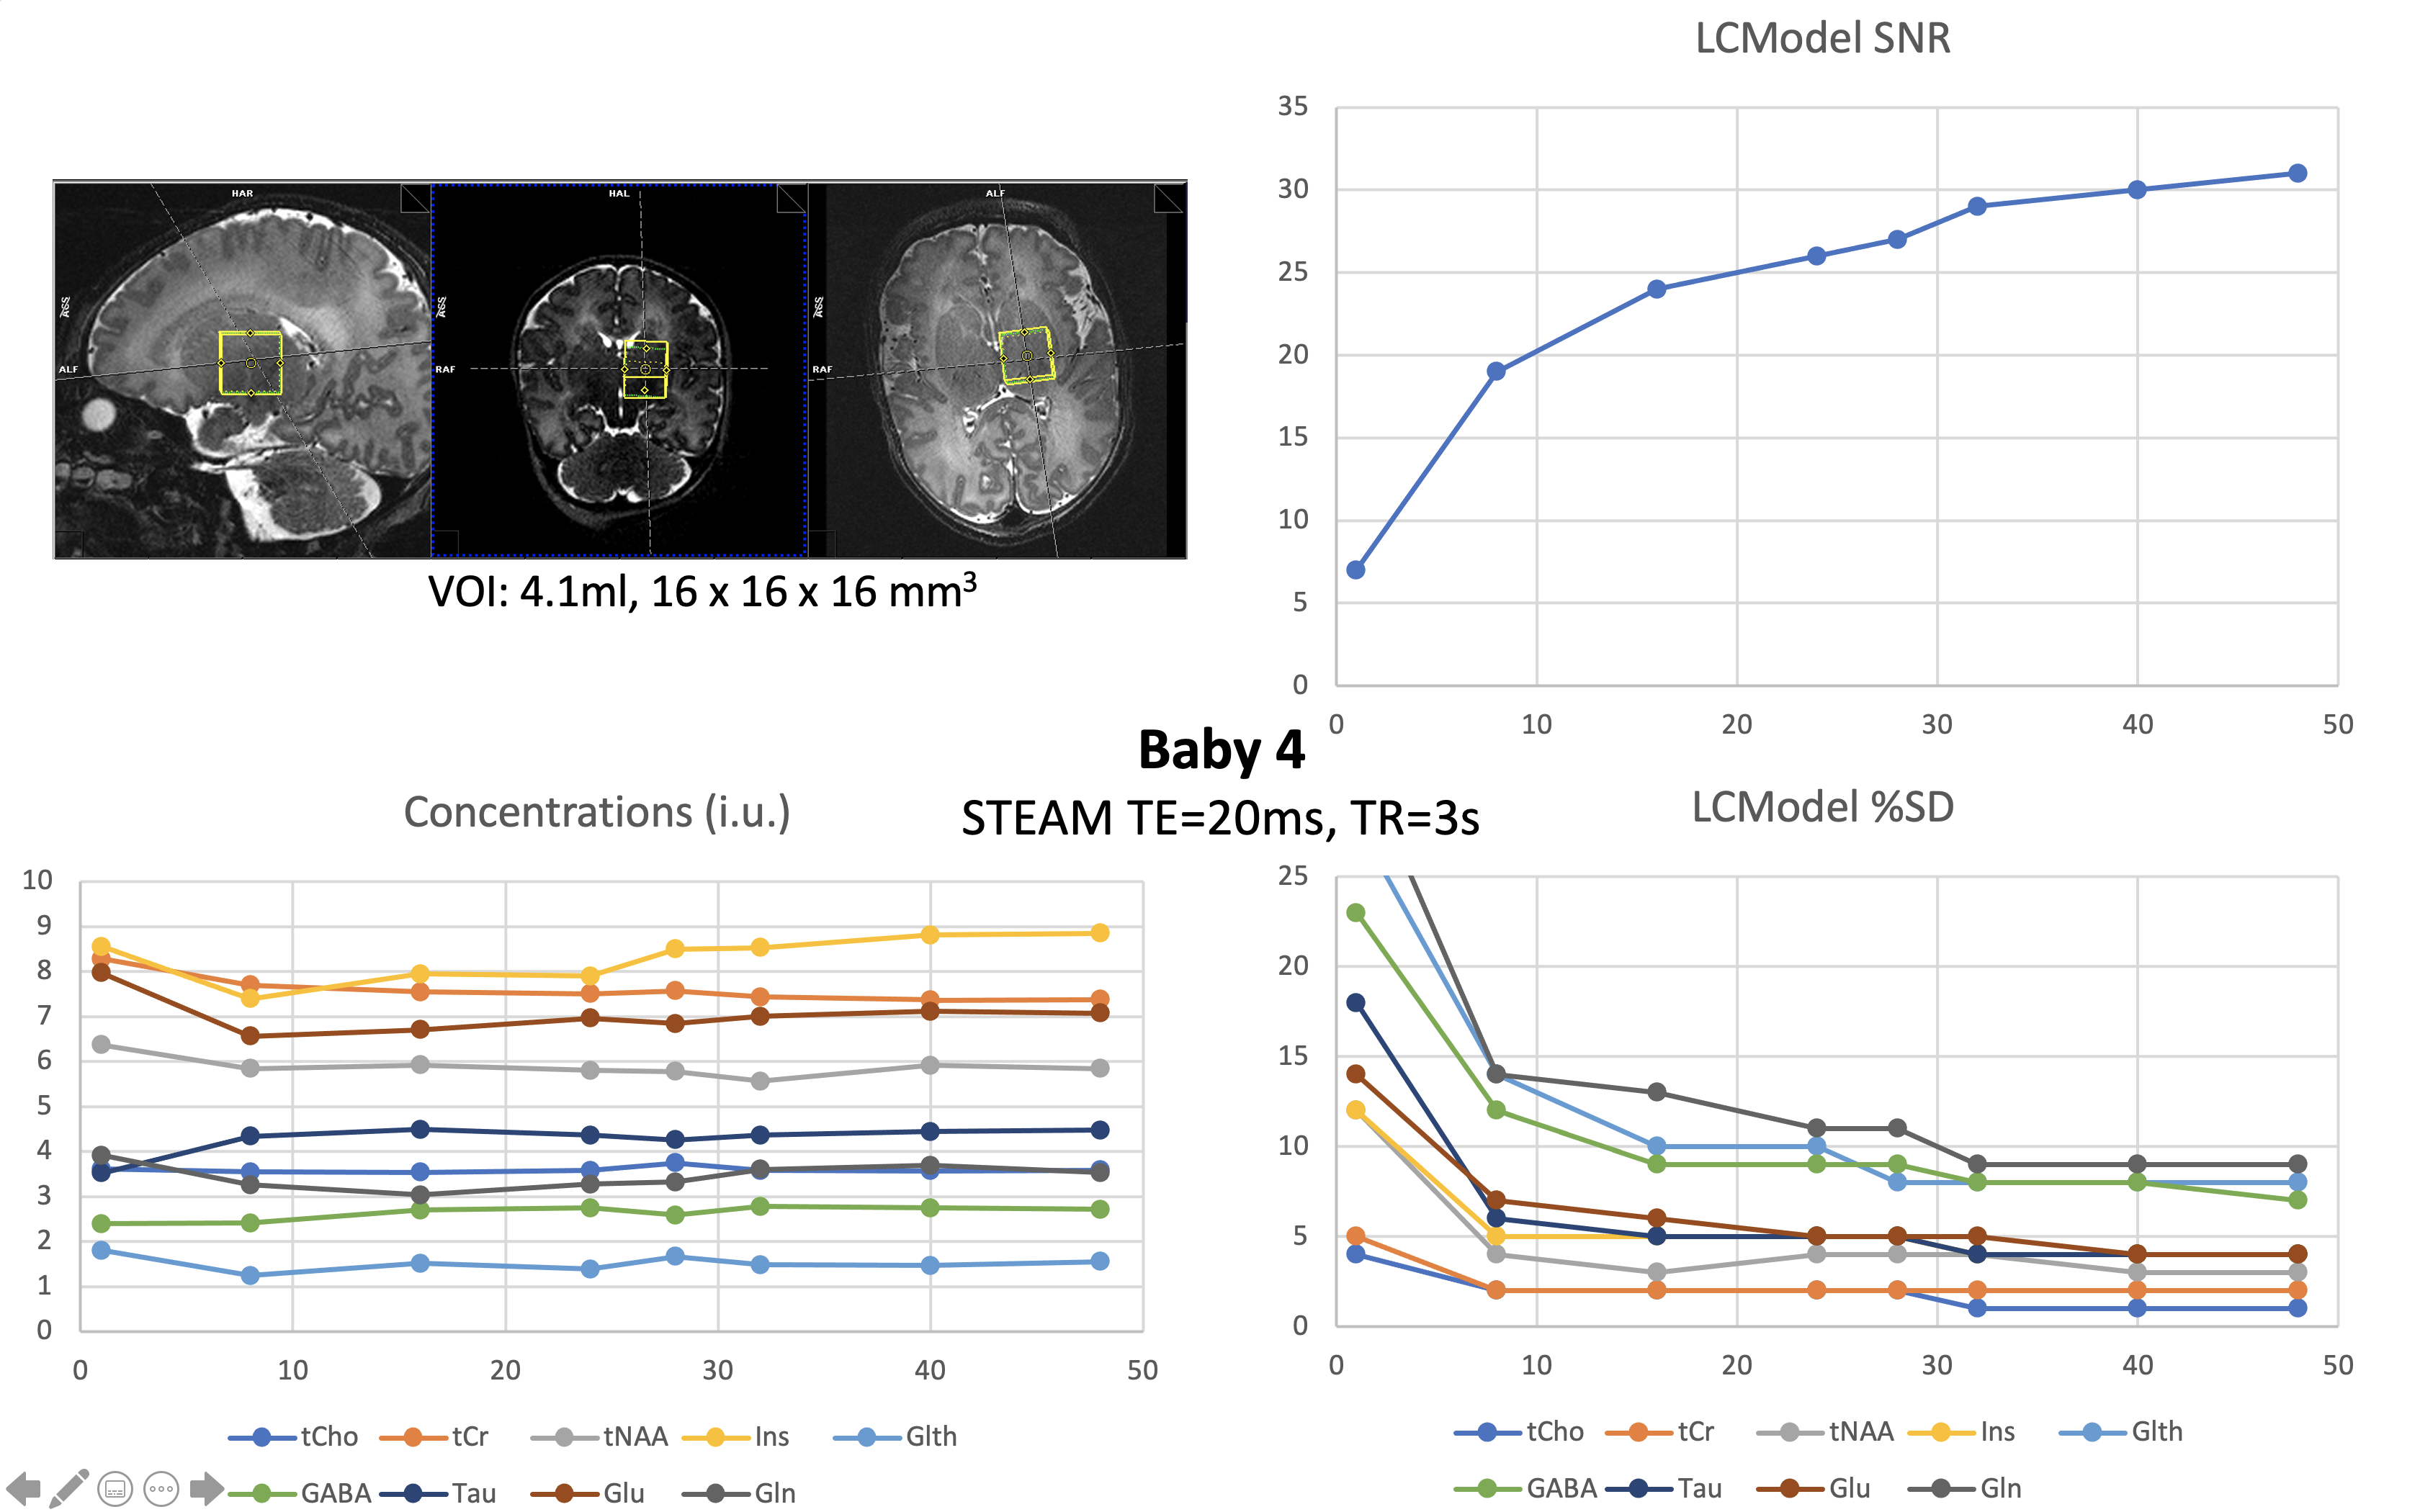
Figure 2. STEAM (TE=20ms, TR=3s) metabolite concentrations (institutional units), Cramer Rao Lower Bounds (%SD) and SNR from LCModel fits for the optimised acquisition (baby-4; GA/PMA 37.4/37.9 weeks), as function of the number of averages used. A clear plateau is observed for concentrations and %SD at 32 averages and above. The bottom right quadrant shows the location of the 4.1ml 16x16x16mm3 voxel of interest in the left thalamus/basal-ganglia region.
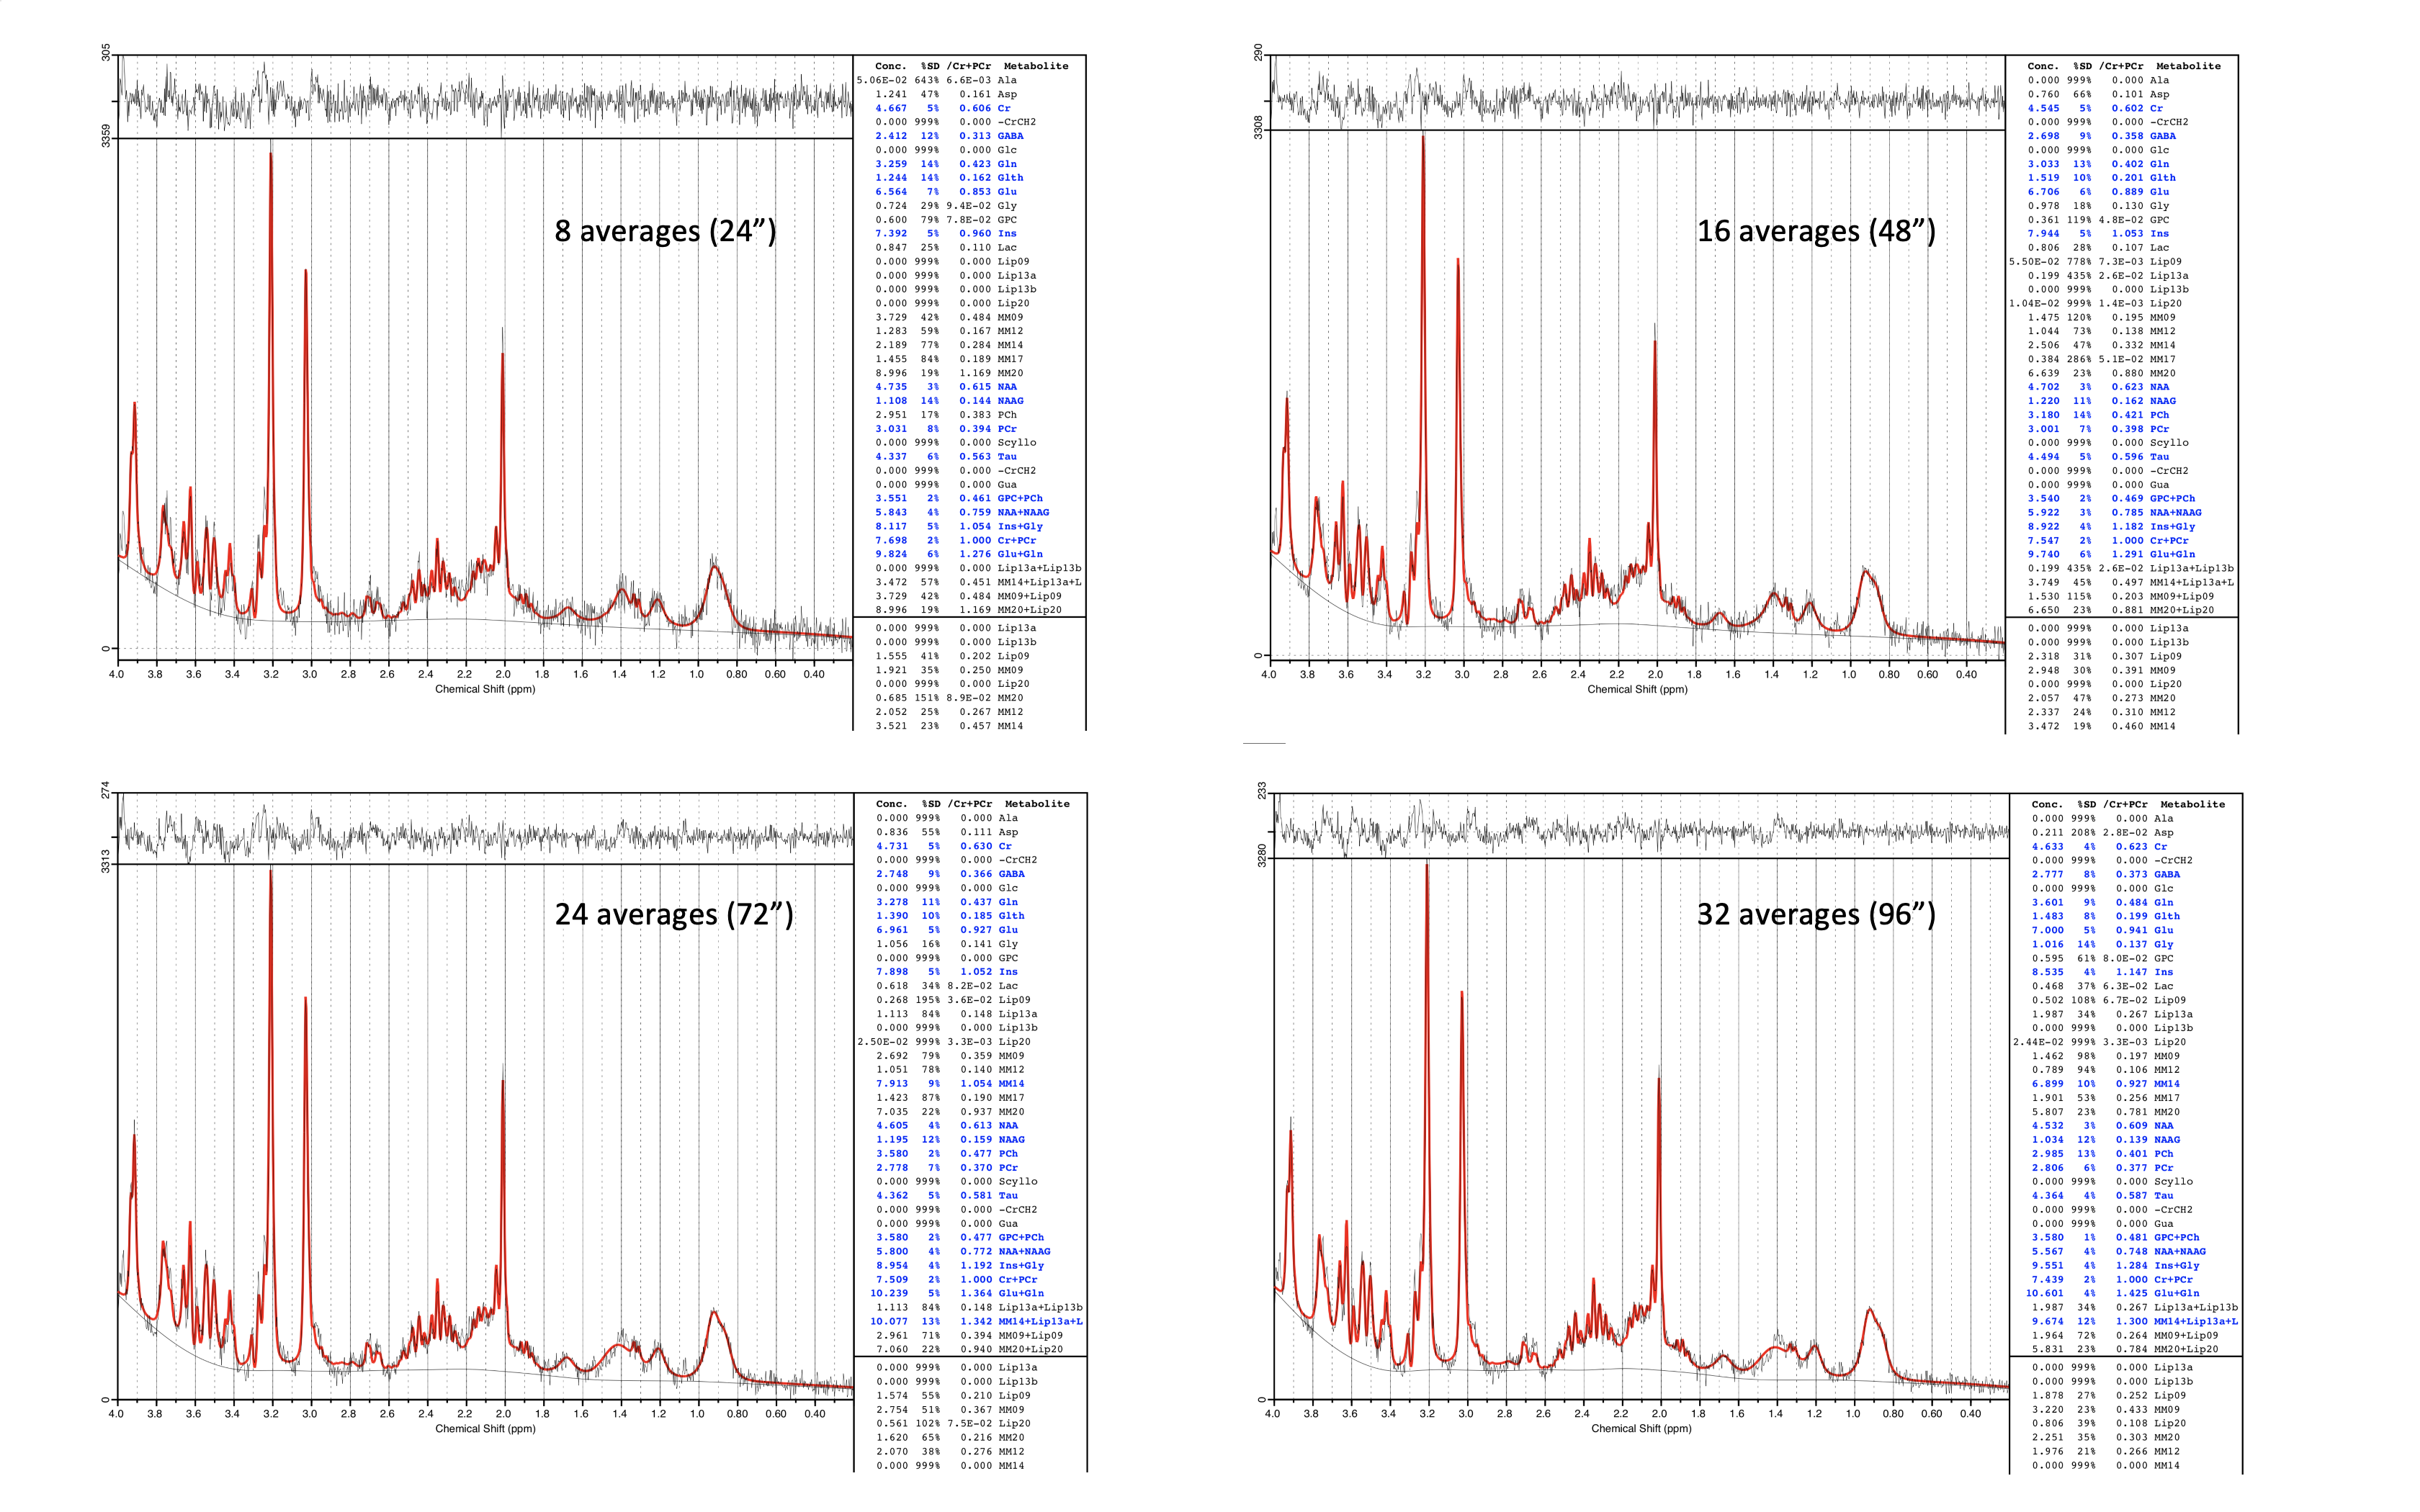
Figure 3. STEAM (TE=20ms, TR=3s) spectra for baby-4 (GA/PMA 37.4/37.9 weeks). LCModel fits for 8, 16, 24, 32 averages (Acquisition times of 24, 48, 72, 96 seconds respectively) are here displayed (compare to the full 48 averages shown the bottom right of in Figure 1, corresponding to an acquisition time of 2 minutes 24 seconds). LCModel estimated SNR were 19, 24, 26, 29, 31 for 8, 16, 24, 32, 48 averages respectively (as in Figure 2 bottom left).