2340
T1 and T2 measurements from Neonates at 7 Tesla1Biomedical Engineering Department, School of Biomedical Engineering and Imaging Sciences, King's College London, London, United Kingdom, 2London Collaborative Ultrahigh field System (LoCUS), King's College London, London, United Kingdom, 3Centre for the Developing Brain, School of Biomedical Engineering and Imaging Sciences, King's College London, London, United Kingdom, 4MR Research Collaborations, Siemens Healthcare Limited, Frimley, United Kingdom, 5Guy's and St. Thomas' NHS Foundation Trust, London, United Kingdom, 6Centre for Neurodevelopmental Disorders, King's College London, London, United Kingdom
Synopsis
Keywords: Neonatal, Relaxometry
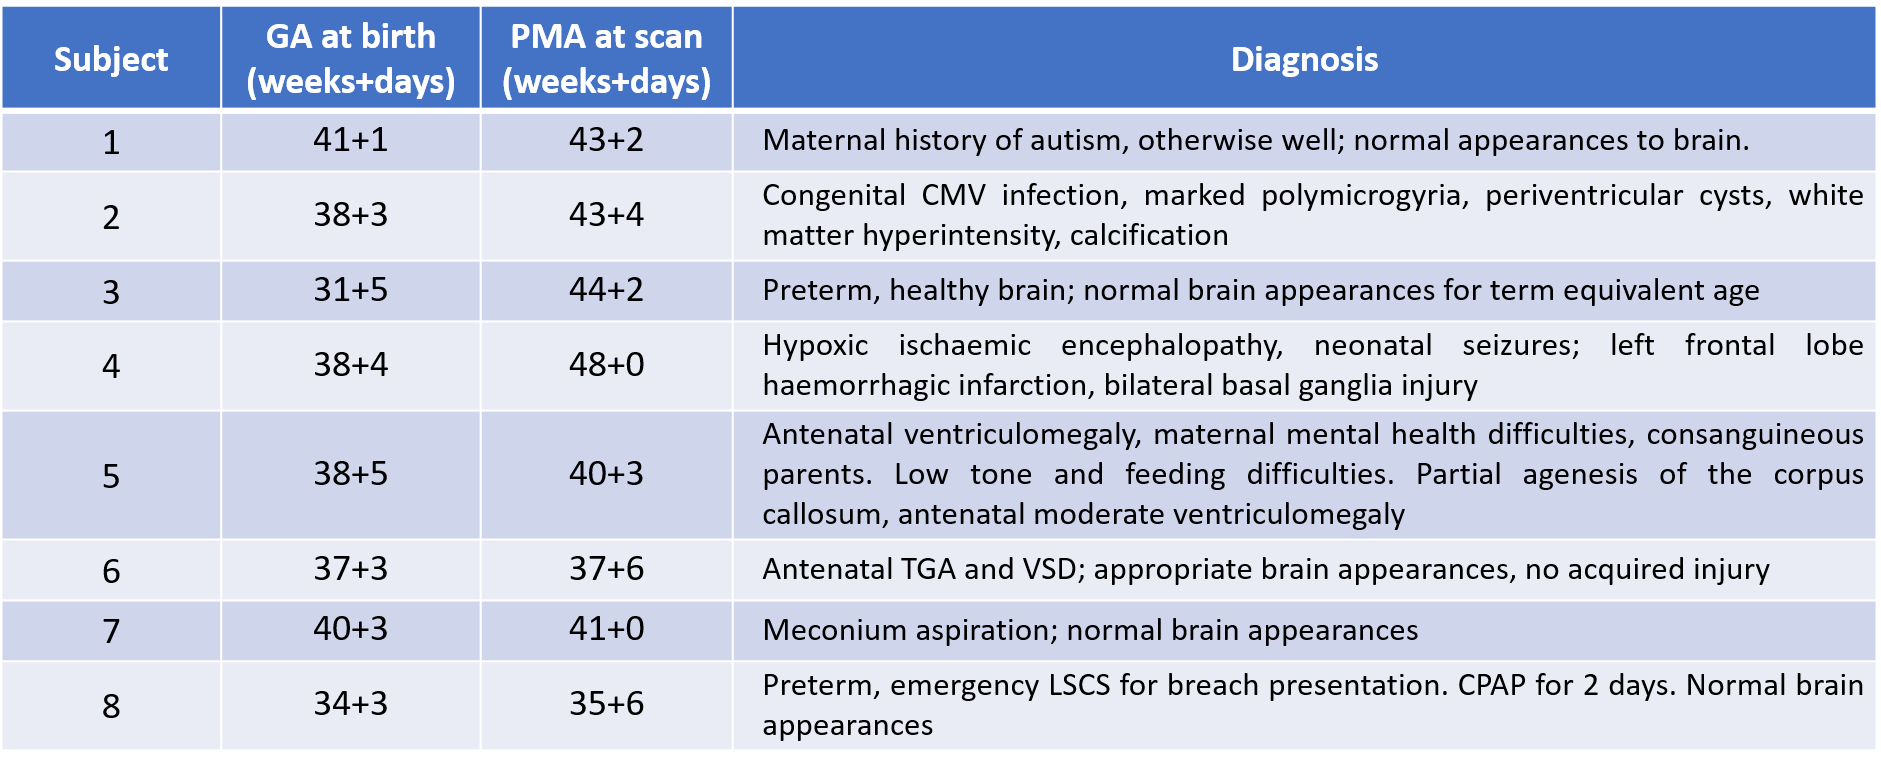
T1 and T2 measurements were made in 8 neonates (median age 42+1 weeks) scanned on a 7 Tesla MRI system, using inversion recovery and spin echo methods respectively. The aim of this study is to help to establish expected ranges, to prepare for systematic relaxometry studies, and to identify optimal operating points for imaging neonates at ultra-high field. Region of interest measurements show strong age dependence of T1, and some variation in T2 (particularly in frontal white matter). The measured T1 times are longer than in adults at 7T, and also longer than in neonates imaged on lower field systems.Introduction
Ultrahigh field (UHF) MRI is now well established as a means for high-resolution imaging, and can provide improved/alternative contrasts. It is expected that the higher signal to noise ratio (SNR) that is intrinsically available from UHF would be particularly beneficial for imaging small subjects such as neonates1. Aside from safety and other practical challenges, no data on relaxation properties for human neonates at 7T have so far been published, making it difficult to optimize imaging protocols for this cohort. This study aims to establish expected ranges for these parameters as part of an exploration of UHF neonatal MRI, so far in a cohort of eight neonates.Methods
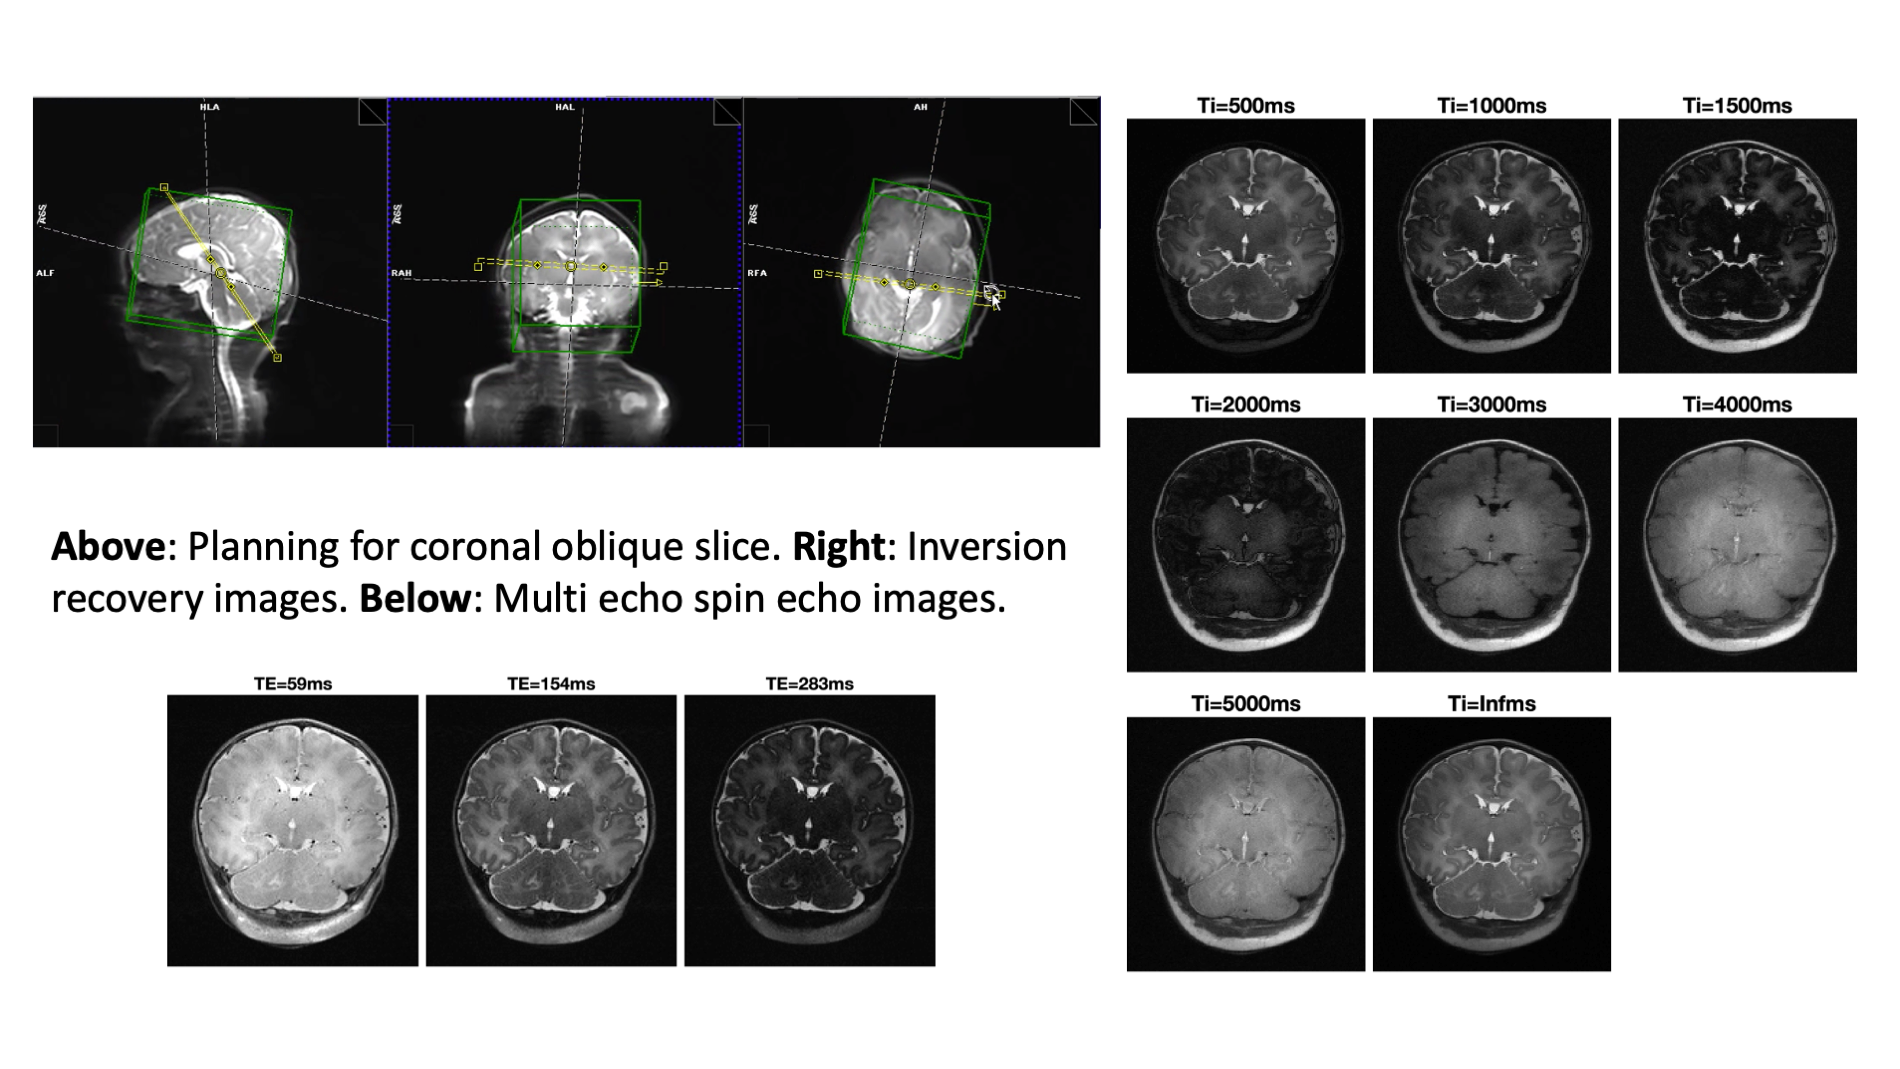
Eight neonates (details in Table 1) were scanned on a 7T scanner (MAGNETOM Terra, Siemens Healthcare, Erlangen, Germany) at the LoCUS MRI Unit, St Thomas’ Hospital London. A 1TX-32RX head coil (Nova Medical, Wilmington, MA, USA) was used with a locally modified safety model enforcing more conservative operating limits, defined following a neonate-specific risk assessment2. Ethical approval (NHS REC 19/LO/1384) was obtained. Infants were positioned headfirst-supine and imaged during natural sleep following feeding. Hearing protection was provided using dental putty and cushioning3. Vital signs (temperature, heart rate, oxygen saturation) were monitored using a Philips-Invivo Expression MR400 monitor and reviewed by clinical staff throughout the scan. Single slice T1 and T2 mapping was performed in an oblique coronal slice, as shown on Figure 1. This was chosen to give reasonable coverage of a range of tissue types (white matter, cortex, deep grey matter, cerebellum) while still being fast and straightforward to achieve. T1 mapping used single-shot Turbo Spin Echo (ssTSE) with adiabatic inversion recovery preparation and variable delay times (Ti = 0.5- 5.0 seconds plus no inversion) with a long delay between images (~20sec) to ensure full magnetization recovery between images. Acquired resolution 0.8x0.8mm in plane and 1.6mm slice thickness, GRAPPA factor 2, TE 77ms. T2 mapping used multi-shot TSE with the same resolution, field-of-view and GRAPPA factor; refocusing FA=180°, TR=5s, total duration 1m10s; echo train length 24 (spacing 11.2ms) was divided into three k-spaces with nominal TEs 59, 154 and 283 ms. Example images from both sequences are shown in Figure 1. T1 was estimated by voxel-wise fitting of magnitude image data to Equation 1:$$S(T_i)=|S_0 \lbrace1-2(1-\epsilon)exp\left(-\frac{T_i}{T_1}\right)\rbrace|$$
The parameter $$$\epsilon$$$ is often used to account for incomplete inversion but can also account for the fast component in a bi-exponential recovery curve4. T2 estimation was performed by voxel-wise fitting to Equation 2 (slice profile and B1+ effects not included):
$$S(TE)=|S_0 exp\left(-\frac{TE}{T_2}\right)|$$
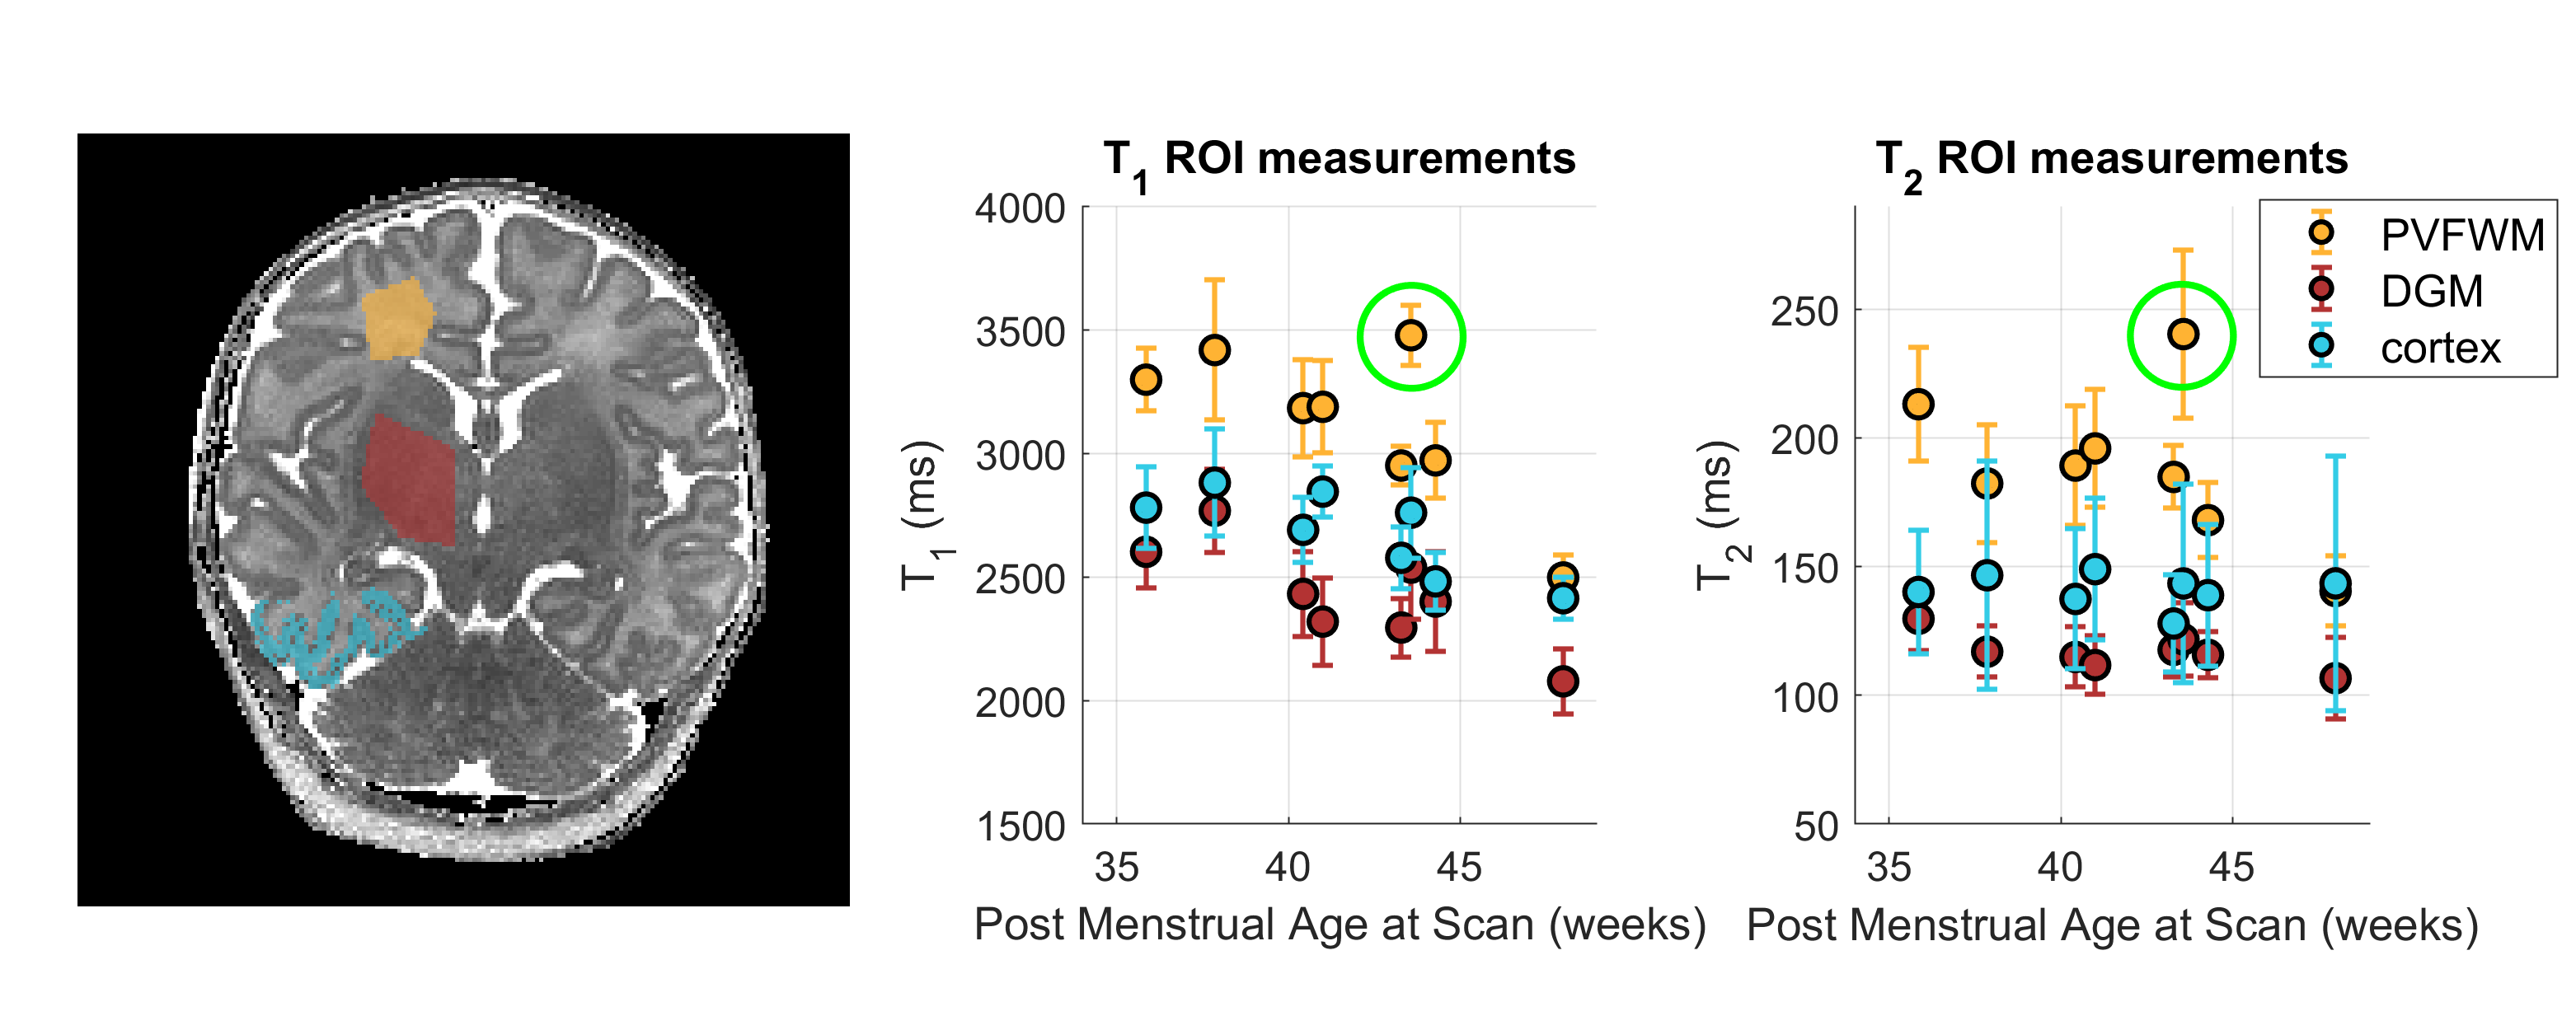
In both cases non-linear unconstrained fitting was performed using MATLAB (The Mathworks) function fmincon. Region of interest (ROI) analysis was performed by manually drawing ROIs in periventricular frontal white matter (PVFWM) and deep grey matter (DGM). A semi-automated method was used to segment cortex in the right temporal lobe; a manual ROI was drawn encompassing the temporal lobe, and k-means clustering based on T1 and T2 values was used to extract the cortex.
Results
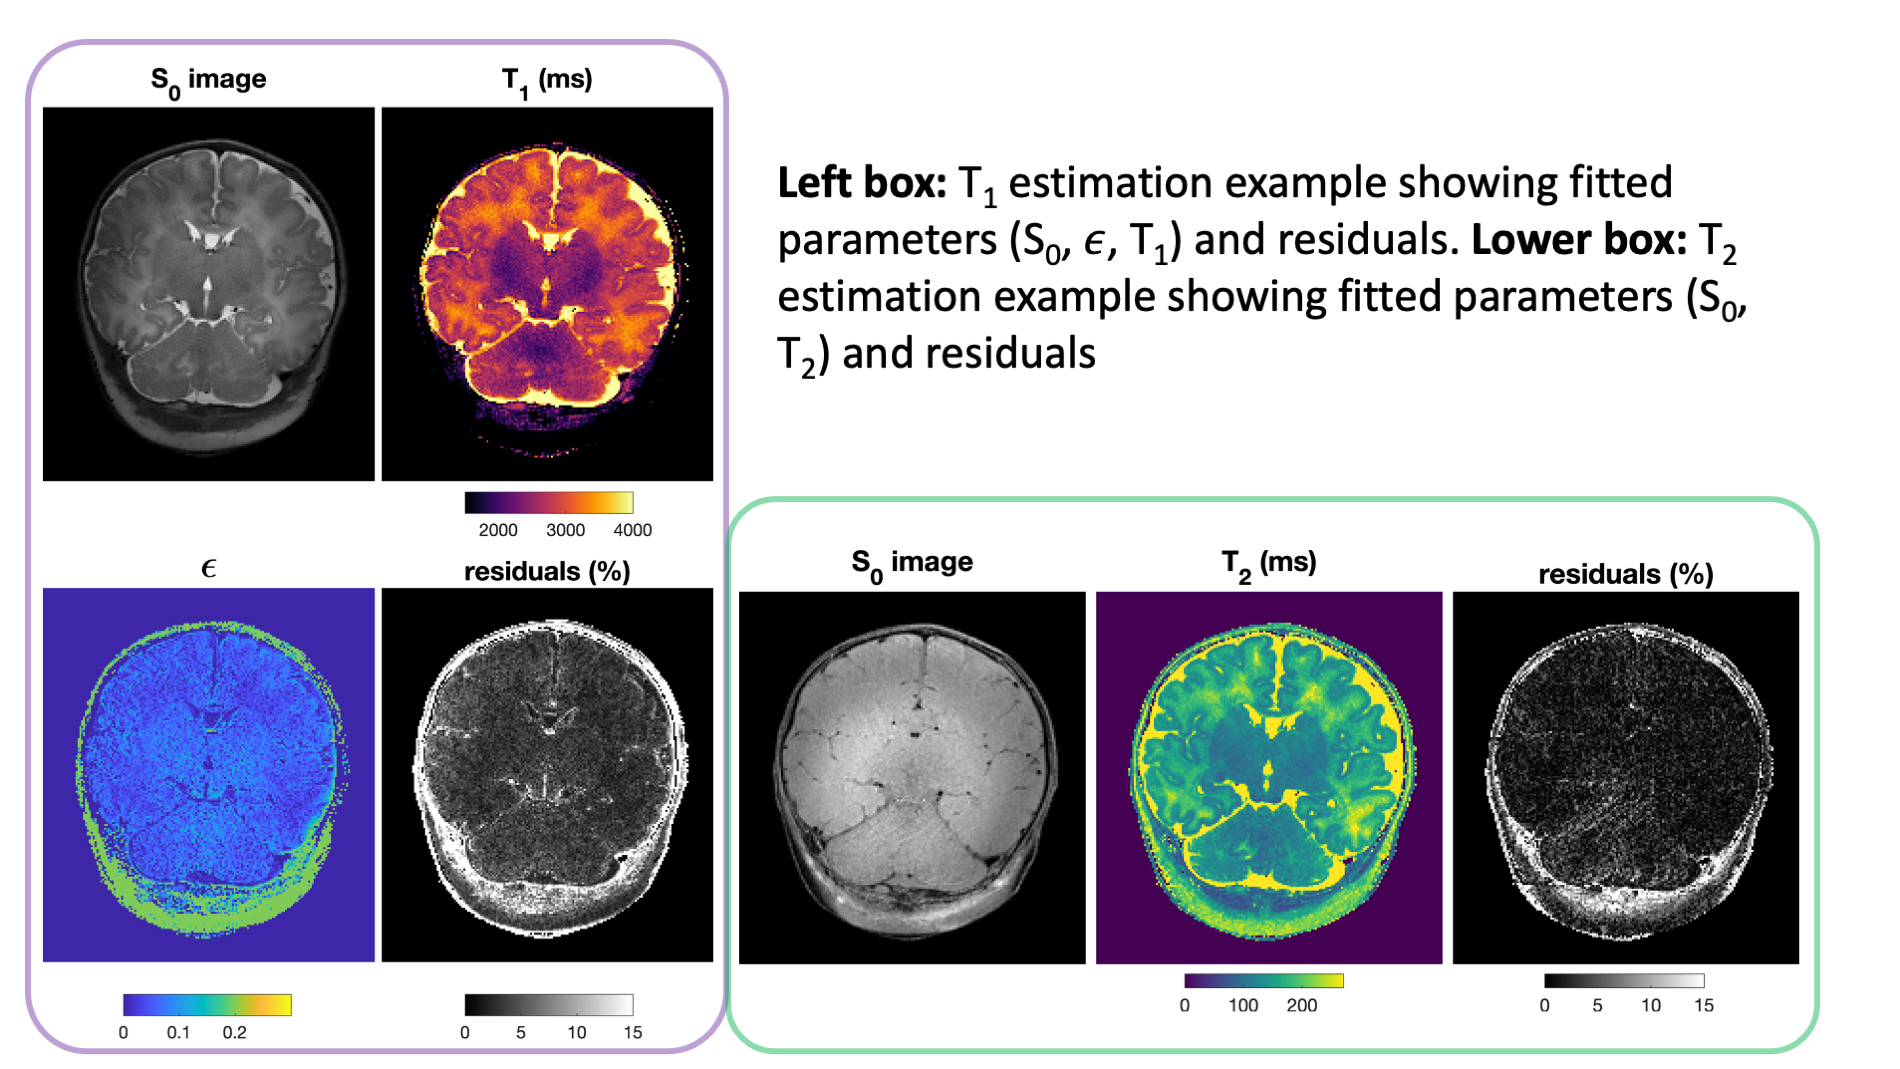
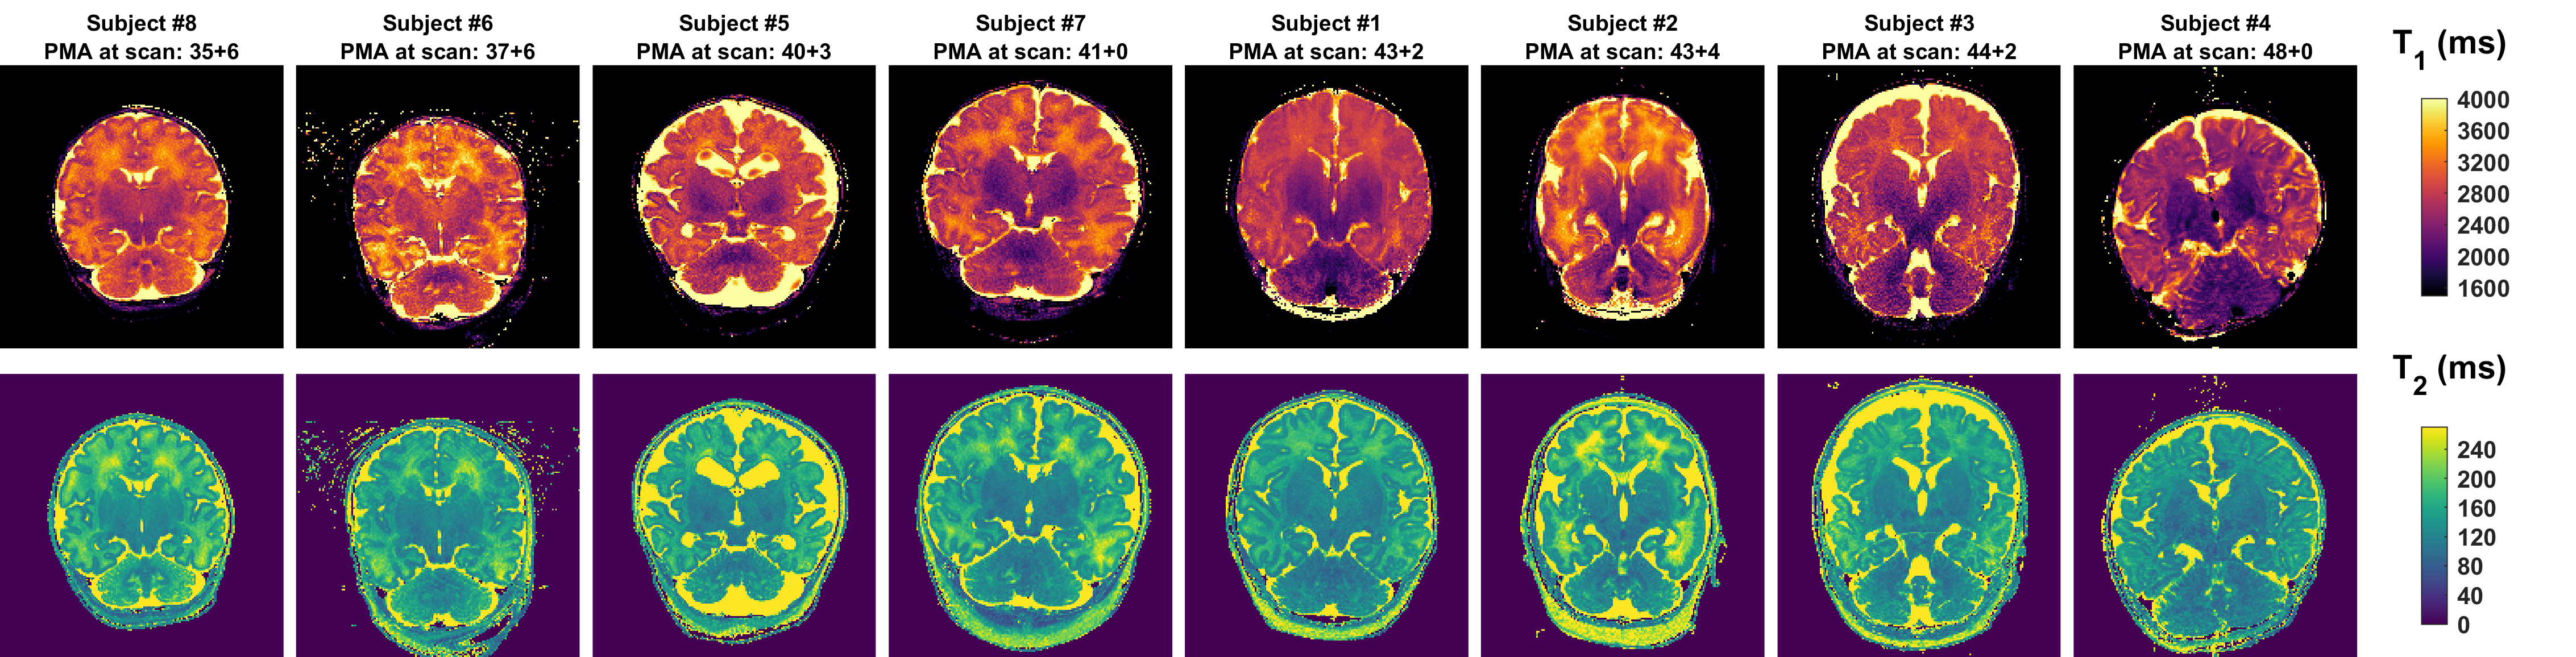
Figure 2 shows example fitting results from subject number 7 including residuals, which are low in brain tissue for both measurements. Maps from all subjects are presented in Figure 3. Figure 4 shows the region of interest measurements from all subjects as well as example ROIs drawn for one subject. Median T1 times are 3180, 2420, and 2720 ms in PVFWM, DGM and cortex respectively; median T2 times are 186, 116 and 141 ms. There is however a large spread between patients; we observed a clear age dependence of T1 in all tissues and also PVFWM for T2. One subject (number 2) is an outlier (green circle) particularly for PVFWM; this extreme variation might relate to pathologic changes due to CMV infection.Discussion and Conclusions
We present T1 and T2 relaxation measurements in human neonatal brain at 7T. As expected, T1s are longer than those seen in adults at the same field strength (e.g. adult data in Wright et al5), and also longer than in neonates at lower fields6. We observed an age dependence in T1 in all tissue types – this is likely related to changes in microstructure and water content due to tissue maturation, and is well known. Schneider et al6 found that frontal white matter T1 reduces after around 35 weeks. We observe a similar trend however the absolute changes in relaxation time are larger than reported by Schneider et al; caution is needed since our study involves a small sample size with a mix of clinically normal and abnormal patients. We hope to improve on this aspect as the work continues.T1 estimation included parameter $$$\epsilon$$$ which is observed to be low within CSF but larger within adjacent brain parenchyma, supporting the conclusion that in the latter this parameter relates to MT effects4 (not present in CSF), known to be more significant at UHF7. A limitation is the use of only a single slice measurement, which prioritizes speed and simplicity. A whole brain protocol could be used in future, but imaging time and sensitivity to motion would need to be addressed.
Acknowledgements
This work was supported by a Wellcome Trust collaboration in science award [WT201526/Z/16/Z], by core funding from the Wellcome/EPSRC Centre for Medical Engineering [WT203148/Z/16/Z], by a project grant awarded by Action Medical Research [GN2728] and by the National Institute for Health Research (NIHR) Biomedical Research Centre based at Guy’s and St Thomas’ NHS Foundation Trust and King’s College London and/or the NIHR Clinical Research Facility. The views expressed are those of the author(s) and not necessarily those of the NHS, the NIHR or the Department of Health and Social Care. DC was supported by funding from the [MRC MR/V002465/1]. TA was supported by funding from a Medical Research Council (MRC) Translation Support Award [MR/V036874/1]. ADE and TA received funding support from the MRC Centre for Neurodevelopmental Disorders, King’s College London [MR/N026063/1].References
1. Annink, K. V. et al. Introduction of Ultra-High-Field MR Imaging in Infants: Preparations and Feasibility. Am. J. Neuroradiol. 1–6 (2020). doi:10.3174/ajnr.a6702
2. Malik, S. J., Hand, J. W., Satnarine, R., Price, A. N. & Hajnal, J. V. Specific absorption rate and temperature in neonate models resulting from exposure to a 7T head coil. Magn. Reson. Med. 86, 1299–1313 (2021).
3. Hughes, E. J. et al. A dedicated neonatal brain imaging system. Magn. Reson. Med. 78, 794–804 (2017).
4. van Gelderen, P., Jiang, X. & Duyn, J. H. Effects of magnetization transfer on T1 contrast in human brain white matter. Neuroimage 128, 85–95 (2016).
5. Wright, P. J. et al. Water proton T1 measurements in brain tissue at 7, 3, and 1.5T using IR-EPI, IR-TSE, and MPRAGE: Results and optimization. Magn. Reson. Mater. Physics, Biol. Med. 21, 121–130 (2008).
6. Schneider, J. et al. Evolution of T1 relaxation, ADC, and fractional anisotropy during early brain maturation: A serial imaging study on preterm infants. Am. J. Neuroradiol. 37, 155–162 (2016).
7. Wang, Y., van Gelderen, P., de Zwart, J. A. & Duyn, J. H. B0-field dependence of MRI T1 relaxation in human brain. Neuroimage 213, 116700 (2020).
Figures