2339
Fetal brain Super-Resolution Reconstruction reliability from clinical MRI data
Tommaso Ciceri1,2, Letizia Squarcina3, Adele Ferro4, Florian Montano5, Alessandra Bertoldo2,6, Nicola Persico7, Simona Boito7, Fabio Maria Triulzi3,8, Giorgio Conte8, Paolo Brambilla3,4, and Denis Peruzzo5
1NeuroImaging, IRCCS Eugenio Medea, Bosisio Parini (LC), Italy, 2Department of Information Engineering, University of Padua, Padova, Italy, 3Pathophysiology and Transplantation, University of Milan, Milano, Italy, 4Neurosciences and Mental Health, Fondazione IRCCS Ca’ Granda Ospedale Maggiore Policlinico, Milano, Italy, 5NeuroImaging Lab, IRCCS Eugenio Medea, Bosisio Parini (LC), Italy, 6Neuroscience Center, University of Padua, Padova, Italy, 7Department of Woman, Child and Newborn, Fondazione IRCCS Ca’ Granda Ospedale Maggiore Policlinico, Milano, Italy, 8Services and Preventive Medicine, Fondazione IRCCS Ca’ Granda Ospedale Maggiore Policlinico, Milano, Italy
1NeuroImaging, IRCCS Eugenio Medea, Bosisio Parini (LC), Italy, 2Department of Information Engineering, University of Padua, Padova, Italy, 3Pathophysiology and Transplantation, University of Milan, Milano, Italy, 4Neurosciences and Mental Health, Fondazione IRCCS Ca’ Granda Ospedale Maggiore Policlinico, Milano, Italy, 5NeuroImaging Lab, IRCCS Eugenio Medea, Bosisio Parini (LC), Italy, 6Neuroscience Center, University of Padua, Padova, Italy, 7Department of Woman, Child and Newborn, Fondazione IRCCS Ca’ Granda Ospedale Maggiore Policlinico, Milano, Italy, 8Services and Preventive Medicine, Fondazione IRCCS Ca’ Granda Ospedale Maggiore Policlinico, Milano, Italy
Synopsis
Keywords: Fetal, Brain, Neurodevelopment, Biometry, Image Reconstruction
In this study, we characterized the geometric reliability of the Super-Resolution (SR) images reconstructed via NiftyMIC and MIALSRTK toolkits over a common clinical fetal MR dataset (20-21 weeks of gestation). We compare 15 biometric measures derived from the acquired 2D images with those derived from the SR brain volumes. Furthermore, we examined two different acquisition sequences (TSE Vs. b-FFE) to evaluate which of them lead to more reliable measures and high-resolution reconstructions. Our findings strengthen the adoption of SR toolkits for fetal brain reconstructions to perform biometry evaluations, suggesting to use TSE sequences.INTRODUCTION
Fetal MRI is a noninvasive exam used for diagnostic purposes via morphologic and biometric evaluation. Novel Super-Resolution (SR) algorithms introduce the possibility of performing volumetric measures. Currently available tools for fully automatic brain reconstruction from fetal T2w-TSE MRI scans are NiftyMIC1 and MIALSRTK2.We characterized the geometric reliability of the fetal brain reconstructed via NiftyMIC and MIALSRTK. We compared the biometric measures derived from the acquired 2D and the reconstructed images. Finally, we examined TSE and b-FFE sequences to evaluate which led to more reliable reconstructions.
MATERIALS AND METHODS
Dataset17 fetal brain MRI examinations of singleton pregnancies (20.24 ± 0.44 gestational weeks) were collected via a 3T Philips scanner at the IRCCS Fondazione Ca’ Granda Ospedale Maggiore Policlinico. The protocol included T2w-TSE and/or b-FFE sequences, acquired with different set-ups due to the clinical contexts.
Super-Resolution Reconstruction
Fetal brains were reconstructed into SR volumes with an isotropic spatial resolution matching that of input sequences via NiftyMIC1 (v0.8) and MIALSRTK2 (v2.03). Acquired images were visually inspected to discard sequences with artifacts3.
Qualitative evaluation of the SR brain volumes
The quality of the SR images were evaluated by two MR pediatric experts with a rate score between 1 and 44: bad, poor, acceptable, and excellent quality (Figure 1).
Biometric measurements
The biometric measures were assessed manually via 3D Slicer5 by one expert in pediatric image analysis. In accordance with previous studies6-9 we selected the biometric measures represented in Figure 2. Each measure was taken two/three times and then averaged on the subject.
Analyses
Three analyses were performed with R software v4.0.5:
- Tools evaluation: agreement analysis between the biometric measures on each 2D acquisition and on the SR brain’s performed using Passing-Bablok regression with the Person’s correlation coefficient10, Bland-Altman plot11, intraclass correlation coefficient (ICC), and some related analyses (paired two-tailed t-test and f-test).
- Tool comparison: qualitative (Likert score) and quantitative (percentage error and Passing-Bablok regression) comparison between NiftyMIC and MIALSRTK outputs.
- Sequence evaluation: qualitative and quantitative comparison between TSE and b-FFE sequences to investigate differences in the SR images.
RESULTS
Tools evaluationForty fetal brain volumes were reconstructed via NiftyMIC and MIALSRTK. Seven reconstructed fetal brains were rated as bad and were discarded.
Measurement averages and standard deviations are reported in Table 1. The statistical comparisons identified no significant differences between measures derived from reconstructed volumes and 2D images, with the only exception for the cLLD measures (p = 0.01 and p < 0.001 for NiftyMIC and MIALSRTK, respectively).
The Passing-Bablok test and the Bland-Altman plots confirm the significant agreement between 2D and toolkits’ SRR (p < 0.003, for all Person’s correlation coefficients).
The reconstruction reliability of both tools was assessed as Moderate to Good12 (averaged ICC with 95% CI was 0.82 [0.62-0.92] for NiftyMIC, and 0.79 [0.57-0.90] for MIALSRTK).
Tool comparison
The average consensus between the two raters’ assessments, showed a higher quality score for NiftyMIC reconstructions.
Results of the estimated biometric measurements percentage error (Table 2) showed an overall average error rate of -0.1% ± 4.9% and -0.7% ± 5.1% for NiftyMIC and MIALSRTK, respectively.
The two-tailed t-test showed no significant differences between the toolkits' Passing-Bablok regression slope and intercept values.
Sequence evaluation
From the visual quality assessment of the SR images, TSE sequences were rated higher than b-FFE sequences. Moreover, b-FFE sequences were usually characterized by the presence of banding artifacts13 affecting both the acquired 2D and SRR images, independently from the toolkit adopted (Figure 3).
The estimated biometric measurements percentage error showed an average error rate of 0.3% ± 4.9% and -0.4% ± 4.8% for NiftyMIC-TSE and b-FFE reconstructions, respectively; -0.75% ± 5.37% and -0.61% ± 4.8% for MIALSRTK-TSE and b-FFE reconstructions, respectively. The percentage error of different measurements was significantly different from 0 for ccL in b-FFE and vCCD in TSE reconstructions via NiftyMIC; for cLLD in b-FFE and TSE, and vCCD in TSE reconstructions via MIALSRTK.
The Passing-Bablok regression slope coefficient of the MIALSRTK-TSE reconstructions showed significant (p = 0.02) differences with respect to a null distribution. The paired two-tailed t-test exhibited no significant differences between the two sequences' slope and intercept values. The f-test showed significant differences (p = 0.03) for the intercept values between NiftyMIC TSE and b-FFE reconstructions.
DISCUSSION AND CONCLUSION
We compared two toolkits on a set of common clinical fetal MR scans acquired around the 21st gestational week. We found that both toolkits provide reliable reconstructed volumes, which can be used for biometric measurements. The percentage error of the biometric measurements evaluated on the SRR is low and comparable with the measured population range. The SRRs obtained from b-FFE sequences were rated higher than TSE ones. However, the presence of intensity bands on both the b-FFE images and derived volumes may be an important source of errors, suggesting that TSE sequences are more reliable.Acknowledgements
This work was supported by Italian Ministry of Health, “Ricerca Corrente” funds and grant #RF-2019-12371349.References
- Ebner, M., Wang, G., Li, W., Aertsen, M., Patel, P. A., Aughwane, R., Melbourne, A., Doel, T., Dymarkowski, S., De Coppi, P., David, A. L., Deprest, J., Ourselin, S., & Vercauteren, T. (2020). An automated framework for localization, segmentation and super-resolution reconstruction of fetal brain MRI. NeuroImage, 206, 116324. https://doi.org/10.1016/j.neuroimage.2019.116324
- Tourbier, S., De Dumast, P., Kebiri, H., Hagmann, P., Bach Cuadra, M. (2020). Medical-Image-Analysis-Laboratory/mialsuperresolutiontoolkit: MIAL Super-Resolution Toolkit (Version v2.0.0). Zenodo. http://doi.org/10.5281/zenodo.4290209
- Khawam, M., de Dumast, P., Deman, P., Kebiri, H., Yu, T., Tourbier, S., Lajous, H., Hagmann, P., Maeder, P., Thiran, J. P., Meuli, R., Dunet, V., Bach Cuadra, M., & Koob, M. (2021). Fetal Brain Biometric Measurements on 3D Super-Resolution Reconstructed T2-Weighted MRI: An Intra- and Inter-observer Agreement Study. Frontiers in pediatrics, 9, 639746. https://doi.org/10.3389/fped.2021.639746
- Likert, R. (1932). A technique for the measurement of attitudes. Archives of psychology.
- Fedorov, A., Beichel, R., Kalpathy-Cramer, J., Finet, J., Fillion-Robin, J. C., Pujol, S., Bauer, C., Jennings, D., Fennessy, F., Sonka, M., Buatti, J., Aylward, S., Miller, J. V., Pieper, S., & Kikinis, R. (2012). 3D Slicer as an image computing platform for the Quantitative Imaging Network. Magnetic resonance imaging, 30(9), 1323–1341. https://doi.org/10.1016/j.mri.2012.05.001
- Garel C. (2005). Fetal cerebral biometry: normal parenchymal findings and ventricular size. European radiology, 15(4), 809–813. https://doi.org/10.1007/s00330-004-2610-z
- Parazzini, C., Righini, A., Rustico, M., Consonni, D., & Triulzi, F. (2008). Prenatal magnetic resonance imaging: brain normal linear biometric values below 24 gestational weeks. Neuroradiology, 50(10), 877–883. https://doi.org/10.1007/s00234-008-0421-7
- Woitek, R., Dvorak, A., Weber, M., Seidl, R., Bettelheim, D., Schöpf, V., Amann, G., Brugger, P. C., Furtner, J., Asenbaum, U., Prayer, D., & Kasprian, G. (2014). MR-based morphometry of the posterior fossa in fetuses with neural tube defects of the spine. PloS one, 9(11), e112585. https://doi.org/10.1371/journal.pone.0112585
- Conte, G., Milani, S., Palumbo, G., Talenti, G., Boito, S., Rustico, M., Triulzi, F., Righini, A., Izzo, G., Doneda, C., Zolin, A., & Parazzini, C. (2018). Prenatal Brain MR Imaging: Reference Linear Biometric Centiles between 20 and 24 Gestational Weeks. AJNR. American journal of neuroradiology, 39(5), 963–967. https://doi.org/10.3174/ajnr.A5574
- Passing, H., & Bablok (1983). A new biometrical procedure for testing the equality of measurements from two different analytical methods. Application of linear regression procedures for method comparison studies in clinical chemistry, Part I. Journal of clinical chemistry and clinical biochemistry. Zeitschrift fur klinische Chemie und klinische Biochemie, 21(11), 709–720. https://doi.org/10.1515/cclm.1983.21.11.709
- Bland, J. M., & Altman, D. G. (1999). Measuring agreement in method comparison studies. Statistical methods in medical research, 8(2), 135–160. https://doi.org/10.1177/096228029900800204
- Koo, T. K., & Li, M. Y. (2016). A Guideline of Selecting and Reporting Intraclass Correlation Coefficients for Reliability Research. Journal of chiropractic medicine, 15(2), 155–163. https://doi.org/10.1016/j.jcm.2016.02.012
- Gholipour, A., Estroff, J. A., Barnewolt, C. E., Robertson, R. L., Grant, P. E., Gagoski, B., Warfield, S. K., Afacan, O., Connolly, S. A., Neil, J. J., Wolfberg, A., & Mulkern, R. V. (2014). Fetal MRI: A Technical Update with Educational Aspirations. Concepts in magnetic resonance. Part A, Bridging education and research, 43(6), 237–266. https://doi.org/10.1002/cmr.a.21321
Figures
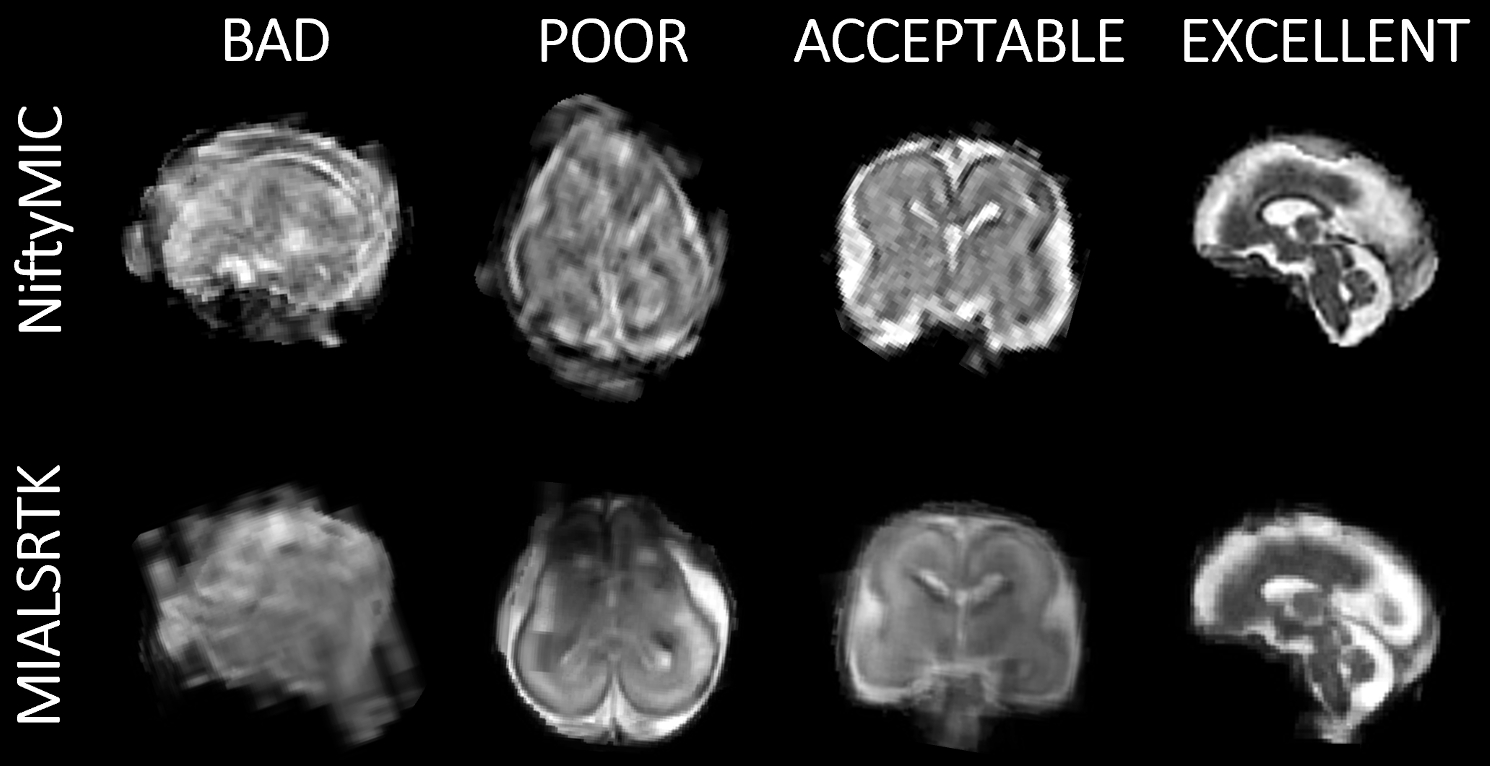
Figure 1: Example of fetal brain Super-Resolution Reconstructed (SRR) quality. The reconstructed brain quality via both toolkits (NiftyMIC and MIALSRTK) were rated from bad to excellent.
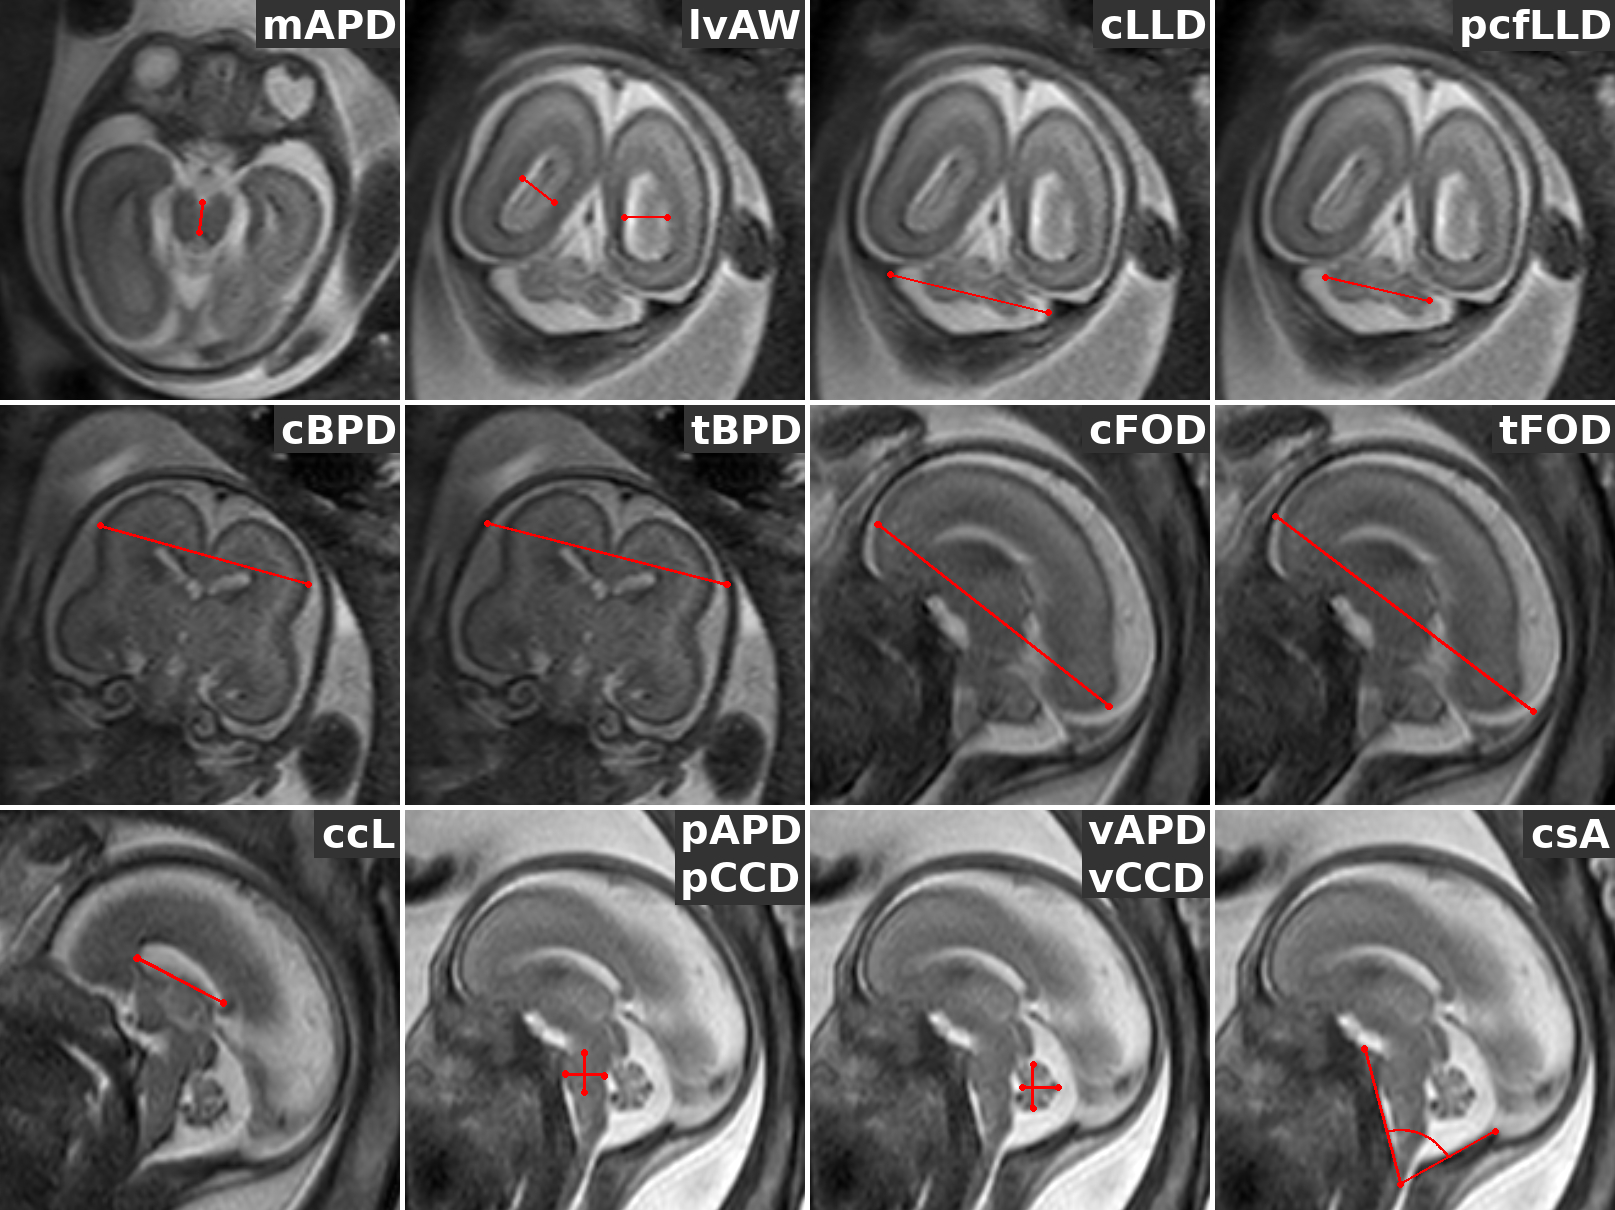
Figure 2: Biometric measurements representation in each orthogonal orientation. The biometric measurements (marked in red) were performed on the acquired 2D and SR brain images. For axial orientation, mAPD; for coronal orientation the lvAW, the cLLD, the pcfLLD, cBPD, the tBPD; for sagittal orientation the cFOD, the tFOD, the ccL, the pAPD, the pCCD, the vAPD, the vCCD, and the csA. To a more detailed description of how to perform the measurements please refer to Conte et al. (2018).
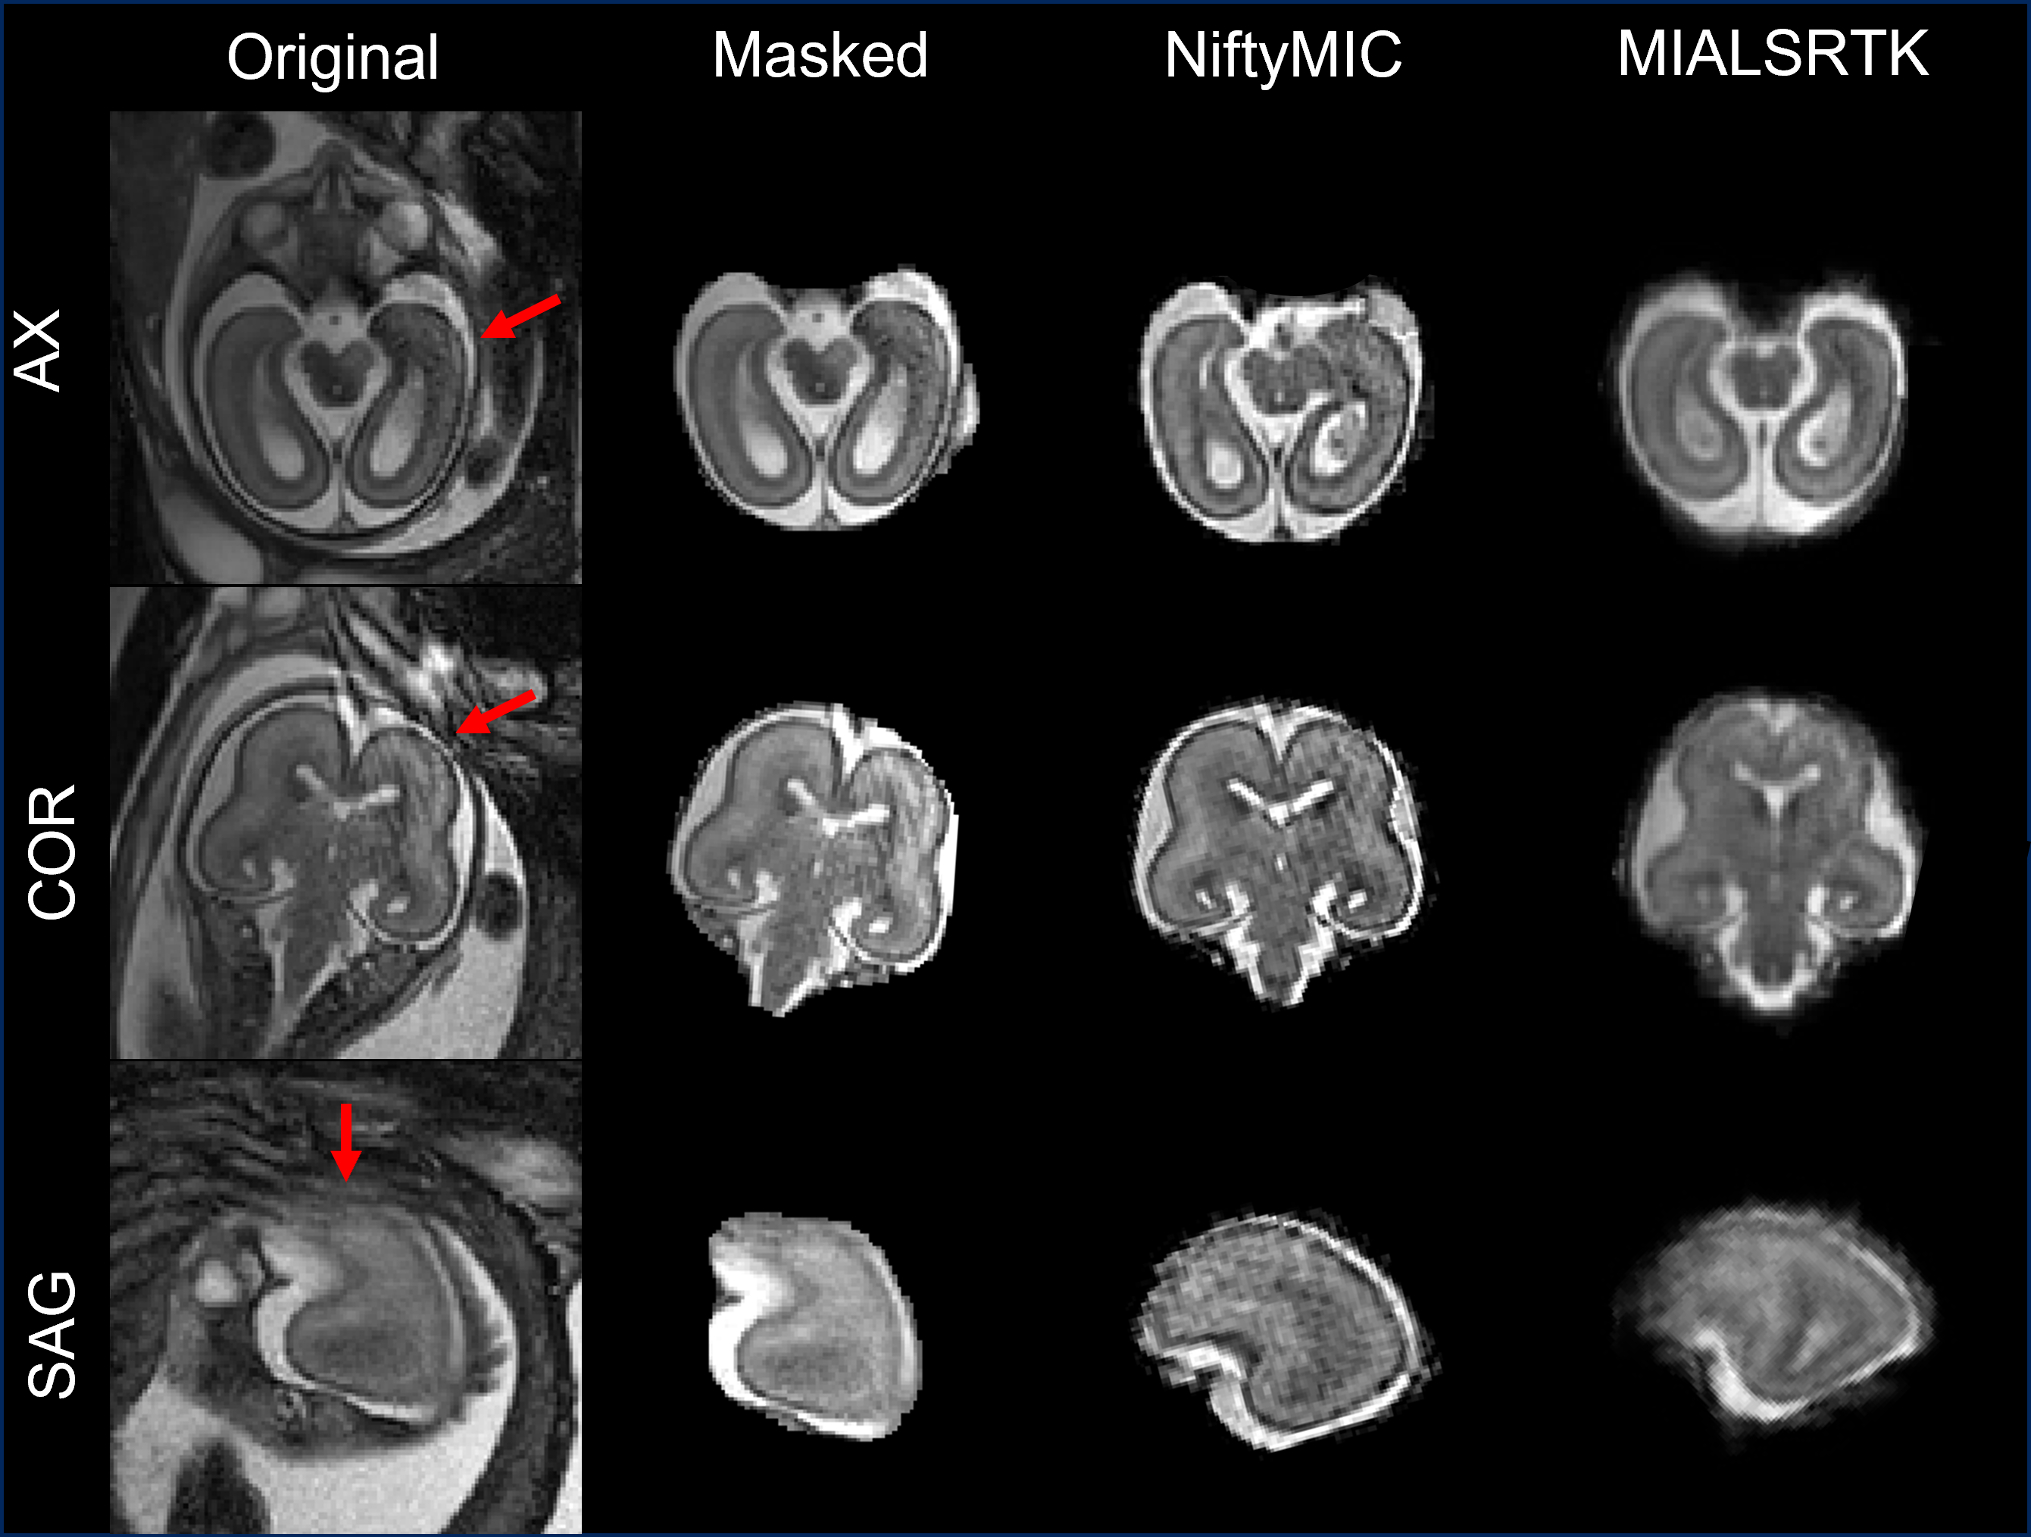
Figure 3: Examples of b-FFE acquisition artifacts. The artifact is reported on 2D images (original and its brain mask) and reconstructed fetal brain obtained via NiftyMIC and MIALSRTK. The artifact, pointed out by the red arrow, is shown in each of the three orthogonal planes (axial, sagittal, and coronal).
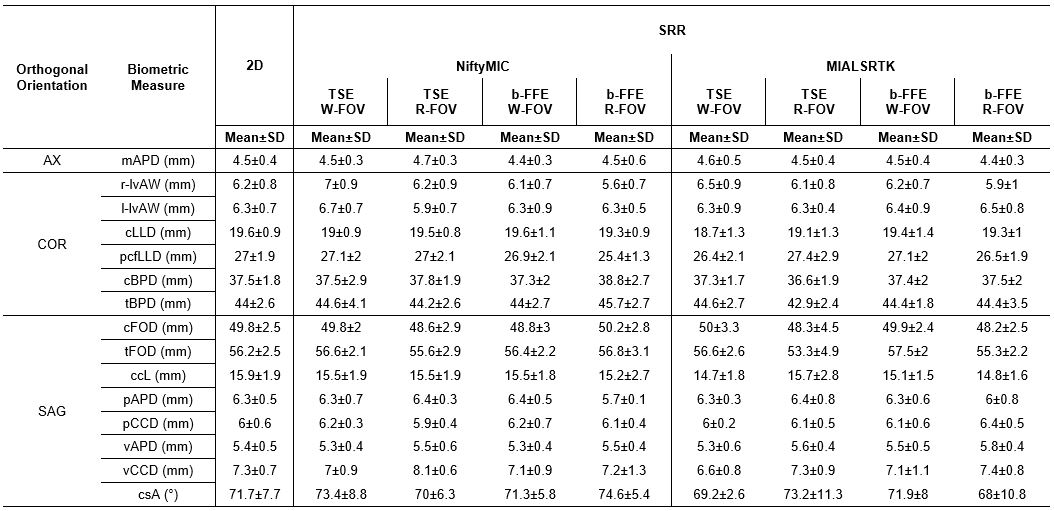
Table 1: Biometric measurements derived from 2D image and reconstructed fetal brain. All the measurements are expressed in millimeters (mm), with the only exception for csA in degrees (°). Each biometric measurement is discussed in terms of mean and standard deviation (SD).
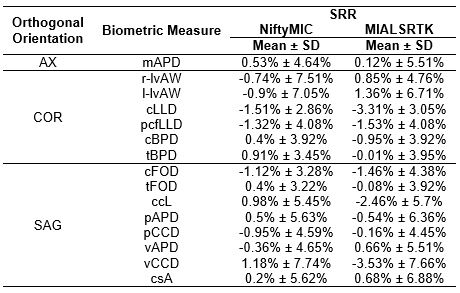
Table 2: Toolkits (NiftyMIC and MIALSRTK) comparison in terms of biometric measurements percentage error. The error is calculated between the measurements derived from the reconstructed fetal brain and those derived from 2D images. The percentage values are discussed in terms of mean and standard deviation (SD).
DOI: https://doi.org/10.58530/2023/2339