2335
Reduced adiposity in growth-restricted fetuses using quantitative two-point Dixon analysis1Sagol Brain Institute, Tel Aviv Sourasky Medical Center, Tel Aviv, Israel, 2Sackler Faculty of Medicine, Tel Aviv University, Tel Aviv, Israel, 3Department of Radiology, Tel Aviv Soursaky Medical Center, Tel Aviv, Israel, 4School of Computer Science and Engineering, The Hebrew University of Jerusalem, Jerusalem, Israel, 5Department of Obstetrics and Gynecology, Lis Hospital for Women, Tel Aviv Sourasky Medical Center, Tel Aviv, Israel, 6Department of Radiology, Tel Aviv Sourasky Medical Center, Tel Aviv, Israel, 7Neonatal Intensive Care Unit, Dana Dwek Children's Hospital, Tel Aviv Sourasky Medical Center, Tel Aviv, Israel, 8Sagol School of Neuroscience, Tel Aviv University, Tel Aviv, Israel
Synopsis
Keywords: Fetal, Fetus, Fetal growth restriction
Adipose tissue (AT, i.e., fat) deposition is reduced in undernourished growth-restricted fetuses (FGR) and may correlate with disease severity. Previous studies showed reduced AT using mainly linear sonographic measurements of the subcutaneous fat. We demonstrate the use of a two-point Dixon sequence for whole-body subcutaneous AT. The fat content of 64 fetuses (37 appropriate for gestation age [AGA], 18 FGR, and 9 small for gestational age) was measured using three adiposity parameters. We demonstrated third-trimester AT accretion in AGA fetuses and reduced AT in FGR. This study is the first to demonstrate whole-fetus subcutaneous AT changes in FGR.Introduction
Fetal growth restriction (FGR) is a major cause of short- and long-term adverse outcomes. Currently, FGR is assessed using sonographic biometrics and Doppler measurements of major vasculature.1 However, ultrasound measurements do not necessarily reflect the fetal body composition and nutritional mismatch and are not strong predictors of adverse perinatal outcomes in FGR.2,3Impaired adipose tissue (AT, i.e., fat) deposition has been suggested in growth-restricted fetuses due to undernutrition secondary to placental insufficiency.4 Furthermore, leaner newborns have worse outcomes, even when birth weight is within normal range.5,6
Ultrasound-based AT evaluation has limited capabilities as it is restricted to linear measurements on two-dimensional planes without the possibility of analyzing the AT lipid content. The two-point Dixon method provides three-dimensional information with excellent capabilities of lipid quantification. Giza et al. demonstrated the feasibility of using fat-water MRI to quantify the fetus's subcutaneous AT.7,8 This study aimed to quantify whole-body subcutaneous AT throughout the third trimester, to assess changes with gestational age (GA) in appropriate for GA (AGA) fetuses, and to assess lipid deposition differences between FGR, small for gestation age (SGA) and AGA.
Methods
Subjects: We used a retrospective cohort of AGA fetuses referred to MRI for various clinical purposes and prospectively recruited the SGA and FGR cohorts (IRB approved). Growth restriction was defined using the Delphi criteria:9 1) Sonographic estimated fetal weight (EFW) or abdominal circumference (AC) <3rd centile; 2) EFW or AC <10th centile with abnormal Doppler measurements. Fetuses who did not meet the Delphi criteria and had an EFW or AC <10th centile were classified as SGA. Fetuses with EFW and AC ≥10th centile were classified as AGA.MRI acquisition: Images were acquired on one of three 3T MRI scanners (Magnetom Skyra, Vida or Prisma, Siemens Healthineers). T2-weighted TRUFI and two-point Dixon images of the entire fetal body were acquired subsequently using a similar field of view (~80 sec).
Image analysis: A semi-automatic method was used to segment the subcutaneous AT, as described previously.10 In brief, a custom automatic network11 was used to segment the entire fetus from the T2-TRUFI and used as a mask on the Dixon fat-only images. Using thresholding and manual corrections, the fetal subcutaneous AT was segmented. AT quantification: Three parameters were used to assess the fetal AT content based on the total fetal and subcutaneous AT volumes (see Figure 1): 1) fat-to-body volumes ratio (FBVR); 2) proton density fat fraction (PDFF)12, and; 3) estimated total lipid content (ETLC). PDFF is clinically used for various indications, especially for hepatic fat quantification,13 and FBVR and ETLC are new.
To assess inter-reader agreement, a second reader independently segmented 11 randomly selected cases (6 AGA, 1 SGA, and 4 FGR) using the same semi-automatic method.
Statistical analysis: Readers' agreement was assessed with: 1) Dice similarity coefficient (DSC) for the segmentation results. 2) Interclass correlation coefficient (ICC) for the three computed AT parameters. Linear regression was used to evaluate the association between GA and FBVR, PDFF, and ETLC in AGA fetuses. Differences between the three groups (AGA, FGR, SGA) were assessed using linear regression while controlling for GA. In addition, comparisons were made on randomly selected age-matched (±0.5 weeks) sub-groups of AGA versus FGR and AGA versus SGA, using the Wilcoxon test. Mann-Whitney U test was used to compare differences between SGA and FGR fetuses.
Results
Sixty-four women with singleton pregnancies were included in the analysis (37 AGA, 18 FGR, and 9 SGA, GA range 30-39 weeks).A good to excellent agreement was detected between readers. The average DSC between readers was 91% (range, 74-98%). The ICC was 0.81 (95% confidence interval [CI], 0.22-0.95) for FBVR, 0.95 (95% CI, 0.67-0.99) for PDFF, and 0.95 (95% CI, 0.87-0.99) for ETLC.
AT accretion with GA: All three adiposity parameters increased between 30 to 39 weeks (P<0.001), results are presented in Table 1. Regression lines and individual data points for the three parameters are shown in Figure 2.
Differences between groups: All three adiposity parameters were significantly lower in FGR compared with AGA. A more moderate reduction was observed between SGA and AGA. Table 2 presents the changes in AT for FGR and SGA. Figure 2 shows individual data for all three AT parameters superimposed on the regression lines corresponding to the AGA subgroup.
GA-matched analysis on 17 pairs of FGR vs. AGA demonstrated similar results, showing reduced adiposity among FGR in all three AT parameters for FGR (P≤0.039). Seven GA-matched pairs of SGA vs. AGA demonstrated lower FBVR and ETLC, though these differences were not statistically significant (P=0.176-0.866). The differences between three AGA and FGR pairs are shown in Figure 3.
Compared with SGA, growth-restricted fetuses had a significantly lower FBVR (P=0.011) with no significant differences in PDFF (P=0.375) and ETLC (P=0.053).
Conclusions
During the third trimester, accretion of whole-body subcutaneous AT is reduced in FGR compared with AGA fetuses. SGA fetuses were also found to be leaner but to a lesser degree. The proposed segmentation and AT quantification method, based on the Dixon sequence, may add information on fetuses suspected of FGR and can be utilized for clinical use and research of other malnourishment pathologies.Acknowledgements
The authors would like to thank the women who participated in this study and the MRI radiographers for their vital role in scanning the women. This research was supported by Kamin grants (63418, 72126) from the Israel Innovation Authority and the Leo Mintz grant from the Sackler Faculty of Medicine, Tel Aviv University, Tel Aviv, Israel.References
1. Lees CC, Stampalija T, Baschat A, et al. ISUOG Practice Guidelines: diagnosis and management of small-for-gestational-age fetus and fetal growth restriction. Ultrasound Obstet Gynecol Off J Int Soc Ultrasound Obstet Gynecol. 2020;56(2):298-312.
2. Meler E, Martinez-Portilla RJ, Caradeux J, et al. Severe smallness as predictor of adverse neonatal outcome in suspected late SGA fetuses: systematic review and meta-analysis. Ultrasound Obstet Gynecol Off J Int Soc Ultrasound Obstet Gynecol. Published online June 2022.
3. Roeckner JT, Pressman K, Odibo L, Duncan JR, Odibo AO. Outcome-based comparison of SMFM and ISUOG definitions of fetal growth restriction. Ultrasound Obstet Gynecol Off J Int Soc Ultrasound Obstet Gynecol. 2021;57(6):925-930.
4. Larciprete G, Valensise H, Di Pierro G, et al. Intrauterine growth restriction and fetal body composition. Ultrasound Obstet Gynecol Off J Int Soc Ultrasound Obstet Gynecol. 2005;26(3):258-262.
5. Shaw M, Lutz T, Gordon A. Does low body fat percentage in neonates greater than the 5th percentile birthweight increase the risk of hypoglycaemia and neonatal morbidity? J Paediatr Child Health. 2019;55(12):1424-1428.
6. Banting SA, Dane KM, Charlton JK, et al. Estimation of neonatal body fat percentage predicts neonatal hypothermia better than birthweight centile. J Matern neonatal Med Off J Eur Assoc Perinat Med Fed Asia Ocean Perinat Soc Int Soc Perinat Obstet. Published online February 2022:1-8.
7. Giza SA, Miller MR, Parthasarathy P, de Vrijer B, McKenzie CA. Comparison of modified two-point dixon and chemical shift encoded MRI water-fat separation methods for fetal fat quantification. J Magn Reson Imaging. 2018;48(1):274-282.
8. Giza SA, Koreman TL, Sethi S, et al. Water-fat magnetic resonance imaging of adipose tissue compartments in the normal third trimester fetus. Pediatr Radiol. 2021;51(7):1214-1222.
9. Gordijn SJ, Beune IM, Thilaganathan B, et al. Consensus definition of fetal growth restriction: a Delphi procedure. Ultrasound Obstet Gynecol Off J Int Soc Ultrasound Obstet Gynecol. 2016;48(3):333-339.
10. Avisdris N, Rabinowich A, Fridkin D, et al. Automatic fetal fat quantification from MRI. In: International Workshop on Preterm, Perinatal and Paediatric Image Analysis. Springer, Cham; 2022:25-37.
11. Fadida-Specktor B, Ben Bashat D, Link Sourani D, et al. Automatic Segmentation and Normal Dataset of Fetal Body from Magnetic Resonance Imaging. In: ISMRM. ; 2021.
12. Reeder SB, Hu HH, Sirlin CB. Proton density fat-fraction: a standardized MR-based biomarker of tissue fat concentration. J Magn Reson Imaging. 2012;36(5):1011-1014.
13. Yokoo T, Serai SD, Pirasteh A, et al. Linearity, Bias, and Precision of Hepatic Proton Density Fat Fraction Measurements by Using MR Imaging: A Meta-Analysis. Radiology. 2018;286(2):486-498.
Figures
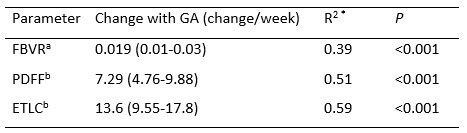
Table 1 Adiposity changes with GA in AGA.
a FBVR value is given as absolute change (95% confidence interval). b PDFF and ETLC data are provided in % change (95% confidence interval). AGA, appropriate for gestational age; ETLC, estimated total lipid content; FBVR, fat to body volume ratio; GA, gestational age; PDFF, proton density fat fraction.
* R2 gives the proportion of parameter variation explained by GA.
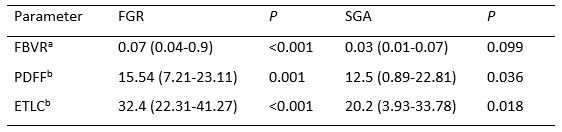
Table 2 Reduction in fetal adiposity in FGR and SGA compared to AGA fetuses as reference group using regression analysis.
a FBVR value is given as absolute change (95% confidence interval). b PDFF and ETLC data are given in % of change (95% confidence interval). AGA, appropriate for gestational age; ETLC, estimated total lipid content; FBVR, fat to body volume ratio; FGR, fetal growth restriction; SGA, small for gestational age; PDFF, proton density fat fraction.
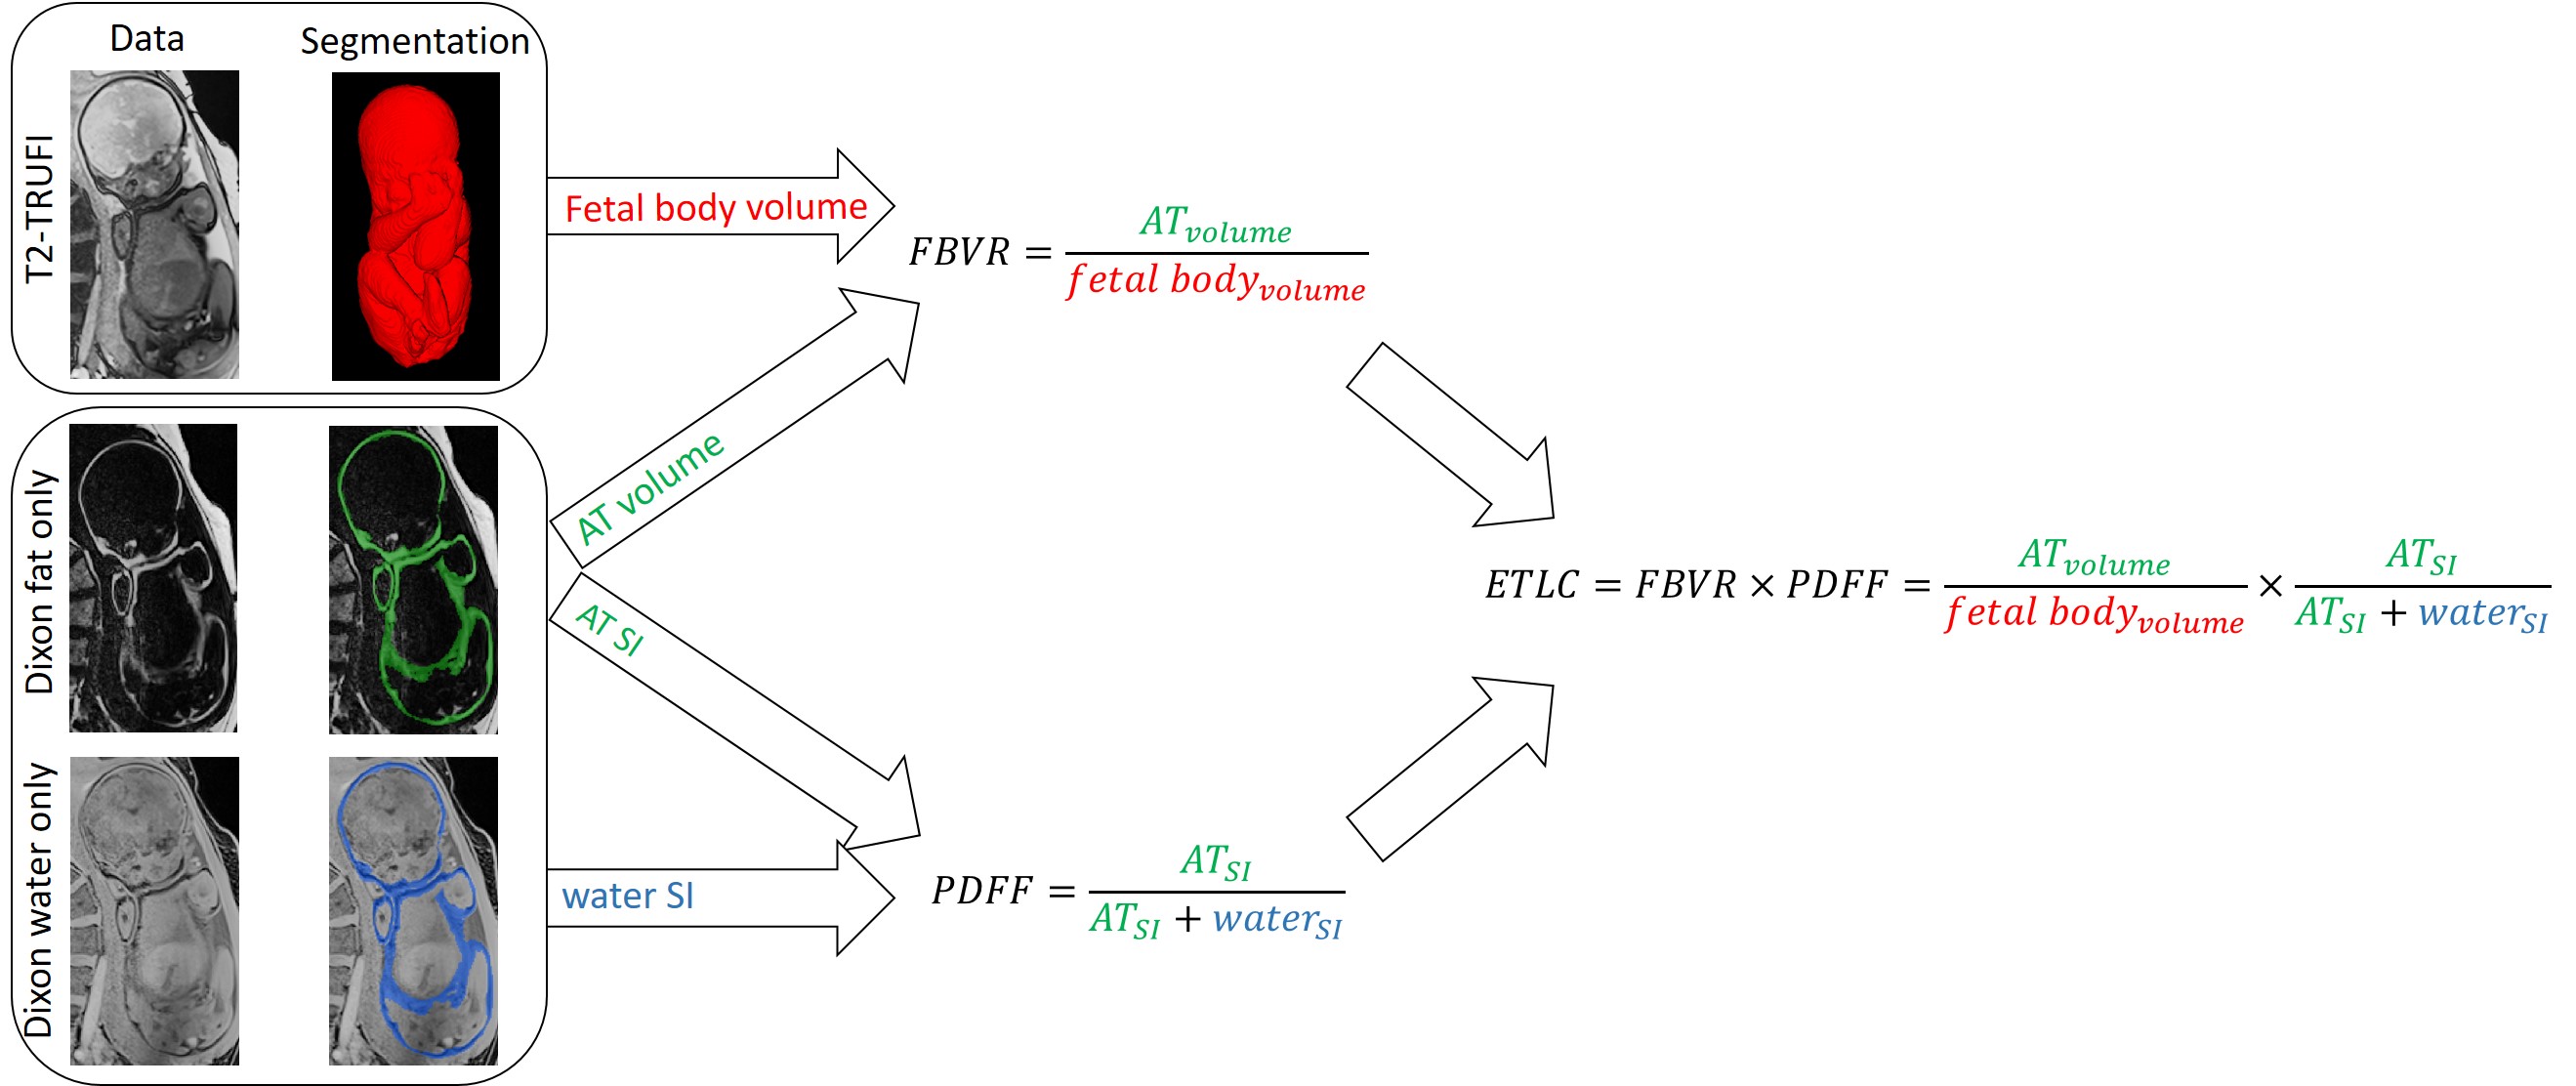
Fig. 1 Adiposity parameters.
AT parameters were computed using T2-TRUFI, fat-only and water-only data following AT and total fetal body volume segmentations. AT, adipose tissue; ETLC, estimated total lipid content; FBVR, fat to body volume ratio; PDFF, proton density fat fraction; SI, signal intensity; T2-TRUFI, T2-weighted True Fast Imaging with Steady State Free Precession.
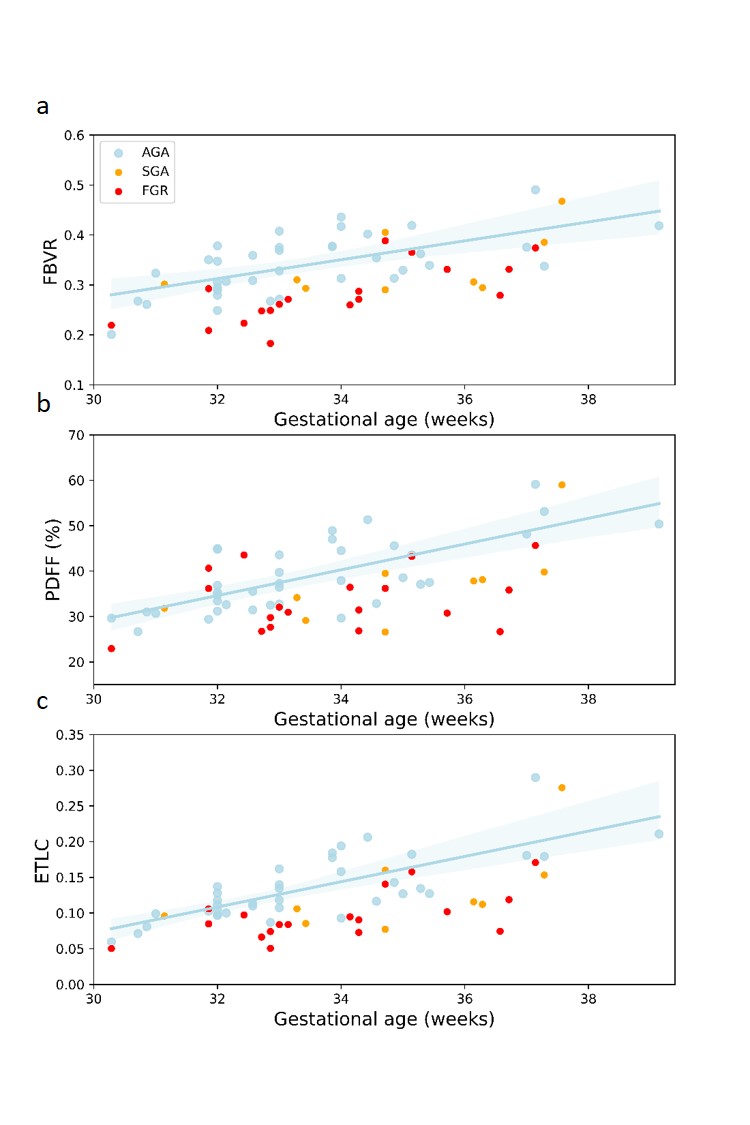
Fig. 2 Adiposity parameters versus GA of AGA, FGR, and SGA from 30+2 to 39+1 GA.
a-c, The AGA regression lines and individual data points are shown for FBVR (a), PDFF (b), and ETLC (c). For AGA fetuses, all parameters significantly increased with GA (P<0.001). AGA, appropriate for gestational age; ETLC, estimated total lipid content; FBVR, fat to body volume ratio; FGR, fetal growth restriction; GA, gestational age; PDFF, proton density fat fraction; SGA, small for gestational age.
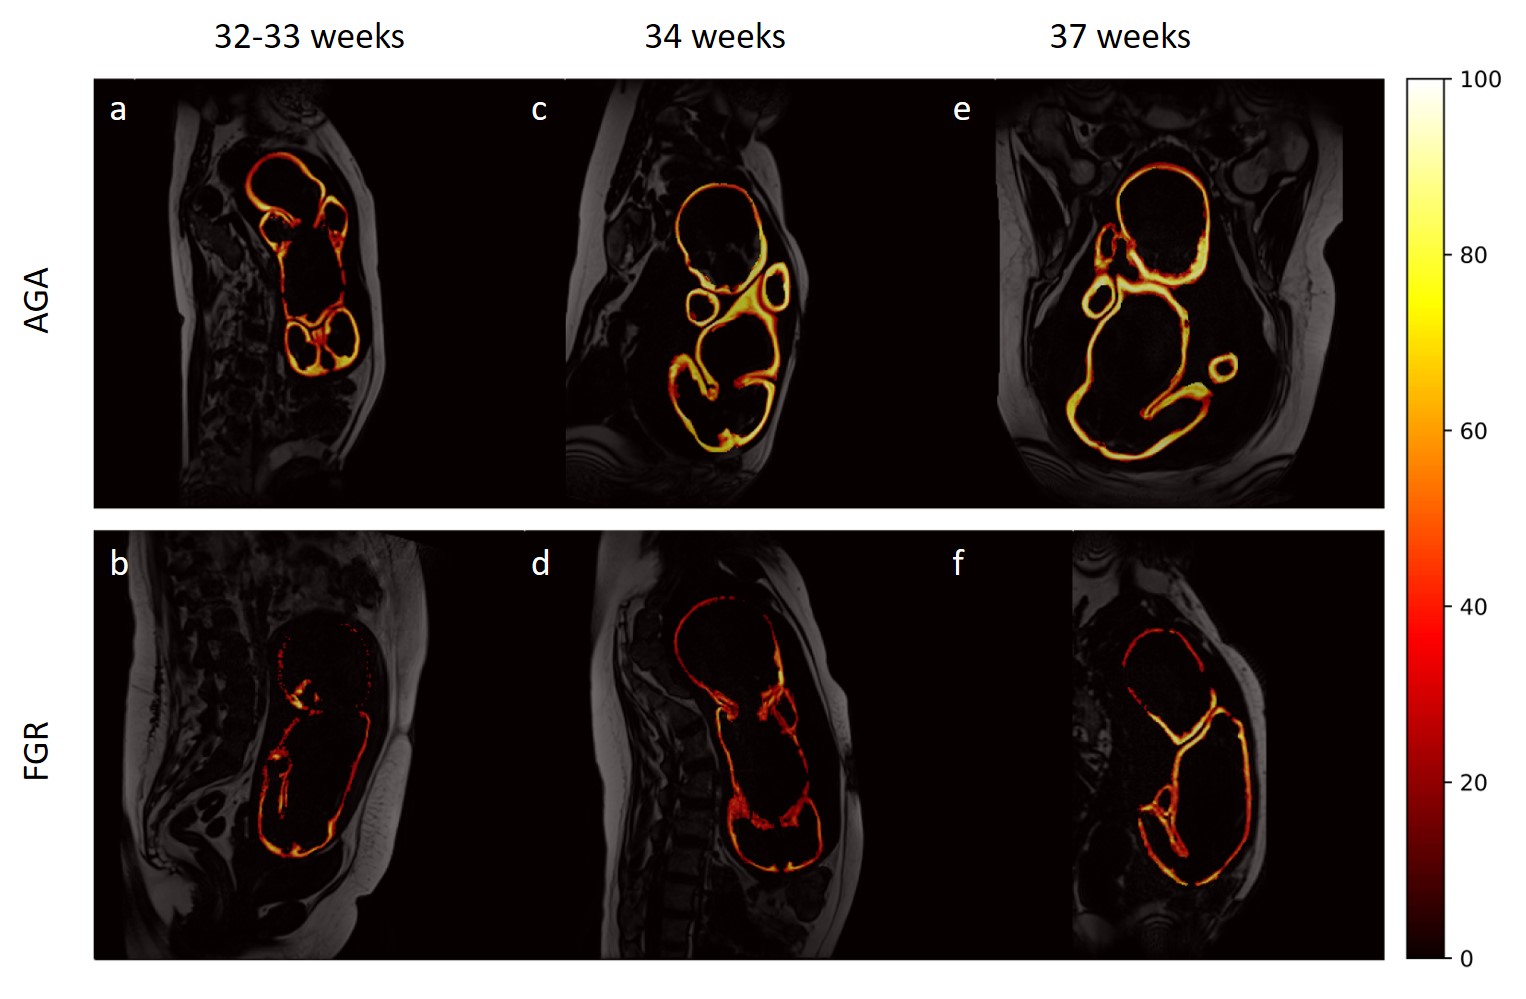
Fig. 3 Differences in lipid deposition between age-matched AGA and FGR across the third trimester.
The subcutaneous AT is segmented, and the tissue PDFF is color coded. AGA fetuses (upper row) have a thicker subcutaneous fat and higher PDFF compared with FGR fetuses (second row). AGA, appropriate for gestational age; FGR, fetal growth restriction.