2334
Quantitative Assessment of Gyrification Patterns and Symmetry of the Fetal Brain based on Routine Fetal 2D MRI
Bossmat Yehuda1,2, Aviad Rabinowich, MD1,3,4, Dafi Surani1, Yair Wexler5, Netanell avisdris1,6, Ori Ben-Zvi1, Bella Spector1,6, Leo Joskowicz6, Liat Ben-Sira, MD1,3, Elka Miller, MD7, and Dafna Ben Bashat1,2,4
1Sagol Brain Institute, Tel Aviv Sourasky Medical Center, Tel Aviv, Israel, 2Sagol School of Neuroscience, Tel Aviv University, Tel Aviv, Israel, 3Department of Radiology, Tel Aviv Sourasky Medical Center, Tel Aviv, Israel, 4Sackler Faculty of Medicine, Tel Aviv University, Tel Aviv, Israel, 5School of Neurobiology, Biochemistry and Biophysics, Faculty of Life Sciences, Tel Aviv University, Tel Aviv, Israel, 6School of Computer Science and Engineering, The Hebrew University of Jerusalem, Jerusalem, Israel, 7CHEO Medical Imaging, University of Ottawa, Ottawa, ON, Canada
1Sagol Brain Institute, Tel Aviv Sourasky Medical Center, Tel Aviv, Israel, 2Sagol School of Neuroscience, Tel Aviv University, Tel Aviv, Israel, 3Department of Radiology, Tel Aviv Sourasky Medical Center, Tel Aviv, Israel, 4Sackler Faculty of Medicine, Tel Aviv University, Tel Aviv, Israel, 5School of Neurobiology, Biochemistry and Biophysics, Faculty of Life Sciences, Tel Aviv University, Tel Aviv, Israel, 6School of Computer Science and Engineering, The Hebrew University of Jerusalem, Jerusalem, Israel, 7CHEO Medical Imaging, University of Ottawa, Ottawa, ON, Canada
Synopsis
Keywords: Fetal, Neuro, gyrification
Current clinical assessment of fetal brain gyrification is performed manually and subjectively. Previous studies that suggested methods for quantitative assessment of fetal brain gyrification were based on 3D reconstruction. In this study we propose an automatic method for quantifying the gyrification from routinely acquired 2D clinical data. We calculate five different gyrification indices for both the right and left hemispheres. We present developmental curves of 134 control fetuses in a wide range of GA (18-37 weeks) and demonstrate differences between control fetuses and fetuses with malformation of cortical development: five with lissencephaly and 13 with polymicrogyria.Introduction
Normal development of the fetal cerebral cortex has a unique spatio-temporal pattern along gestational age (GA)1–5, with gyrification starting from the second trimester and continuing during post-natal life5. Malformations of cortical development (MCD) were shown to be associated with worse neurodevelopmental outcomes6–8. Two common MCDs are lissencephaly (LIS) and polymicrogyria (PMG), both resulting from abnormal neuronal migration and organization9.Fetal MRI is increasingly being used for cortical development assessment to support ultrasound or to reveal new findings. To date, using both ultrasound and MRI, the cortical surface is assessed qualitatively by visual inspection. However, some pathologies may be missed, especially when the cortical abnormality is only mild and symmetrical10. A few studies suggested quantitative measures of fetal cortical folding based on 3D reconstructed cortical surface11–15. However, these studies were limited by using prospective specific data for 3D reconstruction, developed on small cohorts of mainly normal fetuses, and proposed developmental curves along narrow ranges of GA11–15. Our aims were: 1) develop a method for quantitative assessment of the gyrification of fetal brain based on routinely acquired clinical 2D MRI data; 2) quantify normal gyrification and symmetry on a large cohort of control fetuses; 3) measure gyrification alternations in fetuses with LIS and PMG.Methods
Participants and MRI protocol: Coronal T2 weighted MRI of 152 fetuses was collected retrospectively: 134 control fetuses (having normal imaging findings and without any congenital abnormalities), five with LIS and 13 with PMG. MRI was acquired on two 3T scanners from two vendors (GE/Siemens), with various sequences FRFSE, TRUFI, HASTE and FIESTA, and acquisition parameters.Image processing pipeline: (Figure 1) it consists of 4 stages: A) Brain detection: computation of the brain region of interest16; B) Brain component segmentation with an existing method17; manual corrections were performed when needed to ensure accurate contour segmentation; C) Computation of the gyrification index (GI) based on the bounded area between the cerebral cortex and the convex hull of the cortex (GIA, Eq. I); and D) Computation of the GI based on the contour (GIC, Eq. II). $$Eq. I: GIA = \frac{S_{\text{bounded area}}}{{S_{\text{hemisphere area}}}}$$ $$Eq. II: GIC = \frac{l_{\text{cerebral contour}}}{{l_{\text{convex hull contour}}}}$$
A total of five quantitative parameters were extracted: Area-based: (1) Mean GIA=the mean value of the GIA calculated from all volume slices; (2) max GIA=the maximum GIA value from all volume slices; (3) Bounded volume=the sum of areas in all slices between the cerebral brain and its convex hull, normalized to the hemisphere’s volume. Contour-based: (4) Mean GIC; (5) Max GIC. Each parameter was calculated separately for the right and left hemispheres. In addition, brain symmetry indices were calculated for each of the five parameters (Eq. III): $$Eq. III: SI = \frac{Right-Left}{{Right+Left}}$$
Statistical analysis: Changes with GA in the control group were assessed by fitting a second-degree polynomial using GAMLSS18,19 with BCPE distribution. Comparison between control fetuses and LIS and PMG were performed using Wilcoxon’s rank sum tests, with control for GA. All p-values were adjusted for multiple comparisons by Benjamini-Hochberg20. The 95% nonparametric confidence intervals21 were adjusted to a false coverage rate of 0.0518.
Results
Control: Significant changes in all GI parameters with GA were detected. Figure 2 shows developmental curves22. While most parameters demonstrated increased values with GA, a few showed parabolic shape with a minimum value around GA = 25, which may be explained by changes in the shape of the Sylvian Fissure. No brain asymmetry was detected in the control group for any of the GI parameters (Figure 3).MCD: Table 1 lists the adjusted p-values and confidence intervals of MCDs compared with control fetuses. Seven parameters were significantly lower in LIS fetuses and four parameters were significantly lower in PMG fetuses. The difference between control and LIS fetuses increases as GA advances.In addition, three fetuses referred to MRI due to suspected LIS in ultrasound were determined with normal cortical development based on MRI reading, supported by normal GI values. No brain asymmetry was detected in LIS and PMG (Figure 3) based on group comparisons.
Discussion
This study presents quantitative parameters of fetal gyrification along GA, applicable for clinical routine 2D MRI data. Changes in all gyrification parameters were detected along GA in the control group corroborating previous studies11,23,24. No brain asymmetry was detected in control fetuses in all parameters, in line with previous studies which used 3D GI11–14,25–30. 2D and 3D GI may hinder small differences known in specific sulci1,23,31. Our results show a significant difference between control and LIS fetuses and supported radiological interpretation in three normal fetuses suspected of LIS. Only one previous study15 quantified the gyrification of three PMG fetuses and reported no differences. Our results in PMG fetuses did show some differences, yet studies of additional gyrification parameters are needed.Conclusion
This study presents for the first time an automated method for GI quantification based on 2D clinical routine MRI. Quantifying gyrification may allow more precise assessment, revealing subtle changes, therefore assess severity in fetuses with MCD. Multi-parametric analysis of brain gyrification may provide complementary information for fetuses with different pathologies.Acknowledgements
This work was supported by the Yoran Institute for Human Genome Research and by the Israel Innovation Authority.
References
1. Garel C, Chantrel E, Brisse H, et al. Fetal Cerebral Cortex: Normal Gestational Landmarks Identified Using Prenatal MR Imaging. Vol 22.; 2001.
2. Dubois J, Lefèvre J, Angleys H, et al. The dynamics of cortical folding waves and prematurity-related deviations revealed by spatial and spectral analysis of gyrification. Neuroimage. 2019;185:934-946. doi:10.1016/j.neuroimage.2018.03.005
3. Dubois J, Benders M, Borradori-Tolsa C, et al. Primary cortical folding in the human newborn: An early marker of later functional development. Brain. 2008;131(8):2028-2041. doi:10.1093/brain/awn137
4. Garel C. MRI of the Fetal Brain Normal Development and Cerebral Pathologies.
5. Dubois J, Dehaene-Lambertz G, Dehaene-Lambertz Fetal G, development postnatal. Fetal and postnatal development of the cortex: MRI and genetics. Brain Mapping: An Encyclopedic Reference. 2015;2:11-19. Accessed September 28, 2022. https://hal.archives-ouvertes.fr/hal-02436275
6. Schmitt S, Ringwald KG, Meller T, et al. European Archives of Psychiatry and Clinical Neuroscience Associations of gestational age with gyrification and neurocognition in healthy adults. Eur Arch Psychiatry Clin Neurosci. 1:3. doi:10.1007/s00406-022-01454-0
7. Papaioannou G, Garel C. The fetal brain: migration and gyration anomalies — pre- and postnatal correlations. 1:3. doi:10.1007/s00247-022-05458-9
8. Guerrini R, Dobyns WB. Malformations of cortical development: clinical features and genetic causes. 2014;13. doi:10.1016/S1474-4422(14)70040-7
9. Mangin JF, Jouvent E, Cachia A. In-vivo measurement of cortical morphology: Means and meanings. Curr Opin Neurol. 2010;23(4):359-367. doi:10.1097/WCO.0B013E32833A0AFC
10. Barkovich AJ. MRI analysis of sulcation morphology in polymicrogyria. Epilesia. Published online 2010:17-22. doi:10.1111/j.1528-1167.2009.02436.x
11. Wright R, Kyriakopoulou V, Ledig C, et al. Automatic quantification of normal cortical folding patterns from fetal brain MRI. Neuroimage. 2014;91:21-32. doi:10.1016/j.neuroimage.2014.01.034
12. Clouchoux C, Kudelski D, Gholipour A, et al. Quantitative in vivo MRI measurement of cortical development in the fetus. Brain Struct Funct. 2012;217(1):127-139. doi:10.1007/s00429-011-0325-x
13. Rajagopalan V, Scott J, Habas PA, et al. Local tissue growth patterns underlying normal fetal human brain gyrification quantified in utero. Journal of Neuroscience. 2011;31(8):2878-2887. doi:10.1523/JNEUROSCI.5458-10.2011
14. Habas PA, Scott JA, Roosta A, et al. Early folding patterns and asymmetries of the normal human brain detected from in utero MRI. Cerebral Cortex. 2012;22(1):13-25. doi:10.1093/cercor/bhr053
15. Im K, Guimaraes A, Kim Y, et al. Quantitative folding pattern analysis of early primary sulci in human fetuses with brain abnormalities. American Journal of Neuroradiology. 2017;38(7):1449-1455. doi:10.3174/ajnr.A5217
16. Dudovitch G, Link-Sourani D, ben Sira L, Miller E, ben Bashat D, Joskowicz L. Deep Learning Automatic Fetal Structures Segmentation in MRI Scans with Few Annotated Datasets. In: International Conference on Medical Image Computing and Computer-Assisted Intervention. ; 2020:365-374.
17. Ori Ben Zvi, Netanell Avisdris, Bossmat Yehuda, et al. Automatic segmentation of fetal brain components from MRI using deep learning. In: ISMRM . ; 2021.
18. Rigby RA, Stasinopoulos DM. Generalized Additive Models for Location, Scale and Shape. Vol 54.; 2005.
19. Stasinopoulos M, Rigby R, Heller G, de Bastiani F. Flexible Regression and Smoothing: Using GAMLSS in R.; 2019.
20. Benjamini Y, Yekutieli D. The Control of the False Discovery Rate in Multiple Testing under Dependency. Vol 29.; 2001.
21. Benjamini Y, Yekutieli D. False Discovery Rate–Adjusted Multiple Confidence Intervals for Selected Parameters. J Am Stat Assoc. 2005;100(469):71-81.
22. Borghi E, de Onis M, Garza C, et al. Construction of the World Health Organization child growth standards: Selection of methods for attained growth curves. Stat Med. 2006;25(2):247-265. doi:10.1002/sim.2227
23. Dubois J, Benders M, Cachia A, et al. Mapping the early cortical folding process in the preterm newborn brain. Cerebral Cortex. 2008;18(6):1444-1454. doi:10.1093/cercor/bhm180
24. Hu HH, Guo WY, Chen HY, et al. Morphological regionalization using fetal magnetic resonance images of normal developing brains. European Journal of Neuroscience. 2009;29(8):1560-1567. doi:10.1111/J.1460-9568.2009.06707.X
25. Shimony JS, Smyser CD, Wideman G, et al. Comparison of cortical folding measures for evaluation of developing human brain. Neuroimage. 2016;125:780-790. doi:10.1016/j.neuroimage.2015.11.001
26. Raznahan A, Shaw P, Lalonde F, et al. How Does Your Cortex Grow? Published online 2011. doi:10.1523/JNEUROSCI.0054-11.2011
27. Duvernoy CS, Smith DE, Manohar P, et al. Gender differences in adverse outcomes after contemporary percutaneous coronary intervention: An analysis from the Blue Cross Blue Shield of Michigan Cardiovascular Consortium (BMC2) percutaneous coronary intervention registry. Am Heart J. 2010;159:677-683.e1. doi:10.1016/j.ahj.2009.12.040
28. Lohmann G. Extracting line representations of sulcal and gyral patterns in MR images of the human brain. IEEE Trans Med Imaging. 1998;17(6):1040-1048. doi:10.1109/42.746714
29. Chen H, Li Y, Ge F, Li G, Shen D, Liu T. Gyral net: A new representation of cortical folding organization. Med Image Anal. 2017;42:14-25. doi:10.1016/j.media.2017.07.001
30. Janssen J, Diáz-Caneja CM, Alloza C, et al. Dissimilarity in Sulcal Width Patterns in the Cortex can be Used to Identify Patients with Schizophrenia with Extreme Deficits in Cognitive Performance. Schizophr Bull. 2021;47(2):552-561. doi:10.1093/schbul/sbaa131
31. Kasprian G, Langs G, Brugger PC, et al. The Prenatal Origin of Hemispheric Asymmetry: An In Utero Neuroimaging Study. Cerebral Cortex. 2011;21:1076-1083. doi:10.1093/cercor/bhq179
Figures
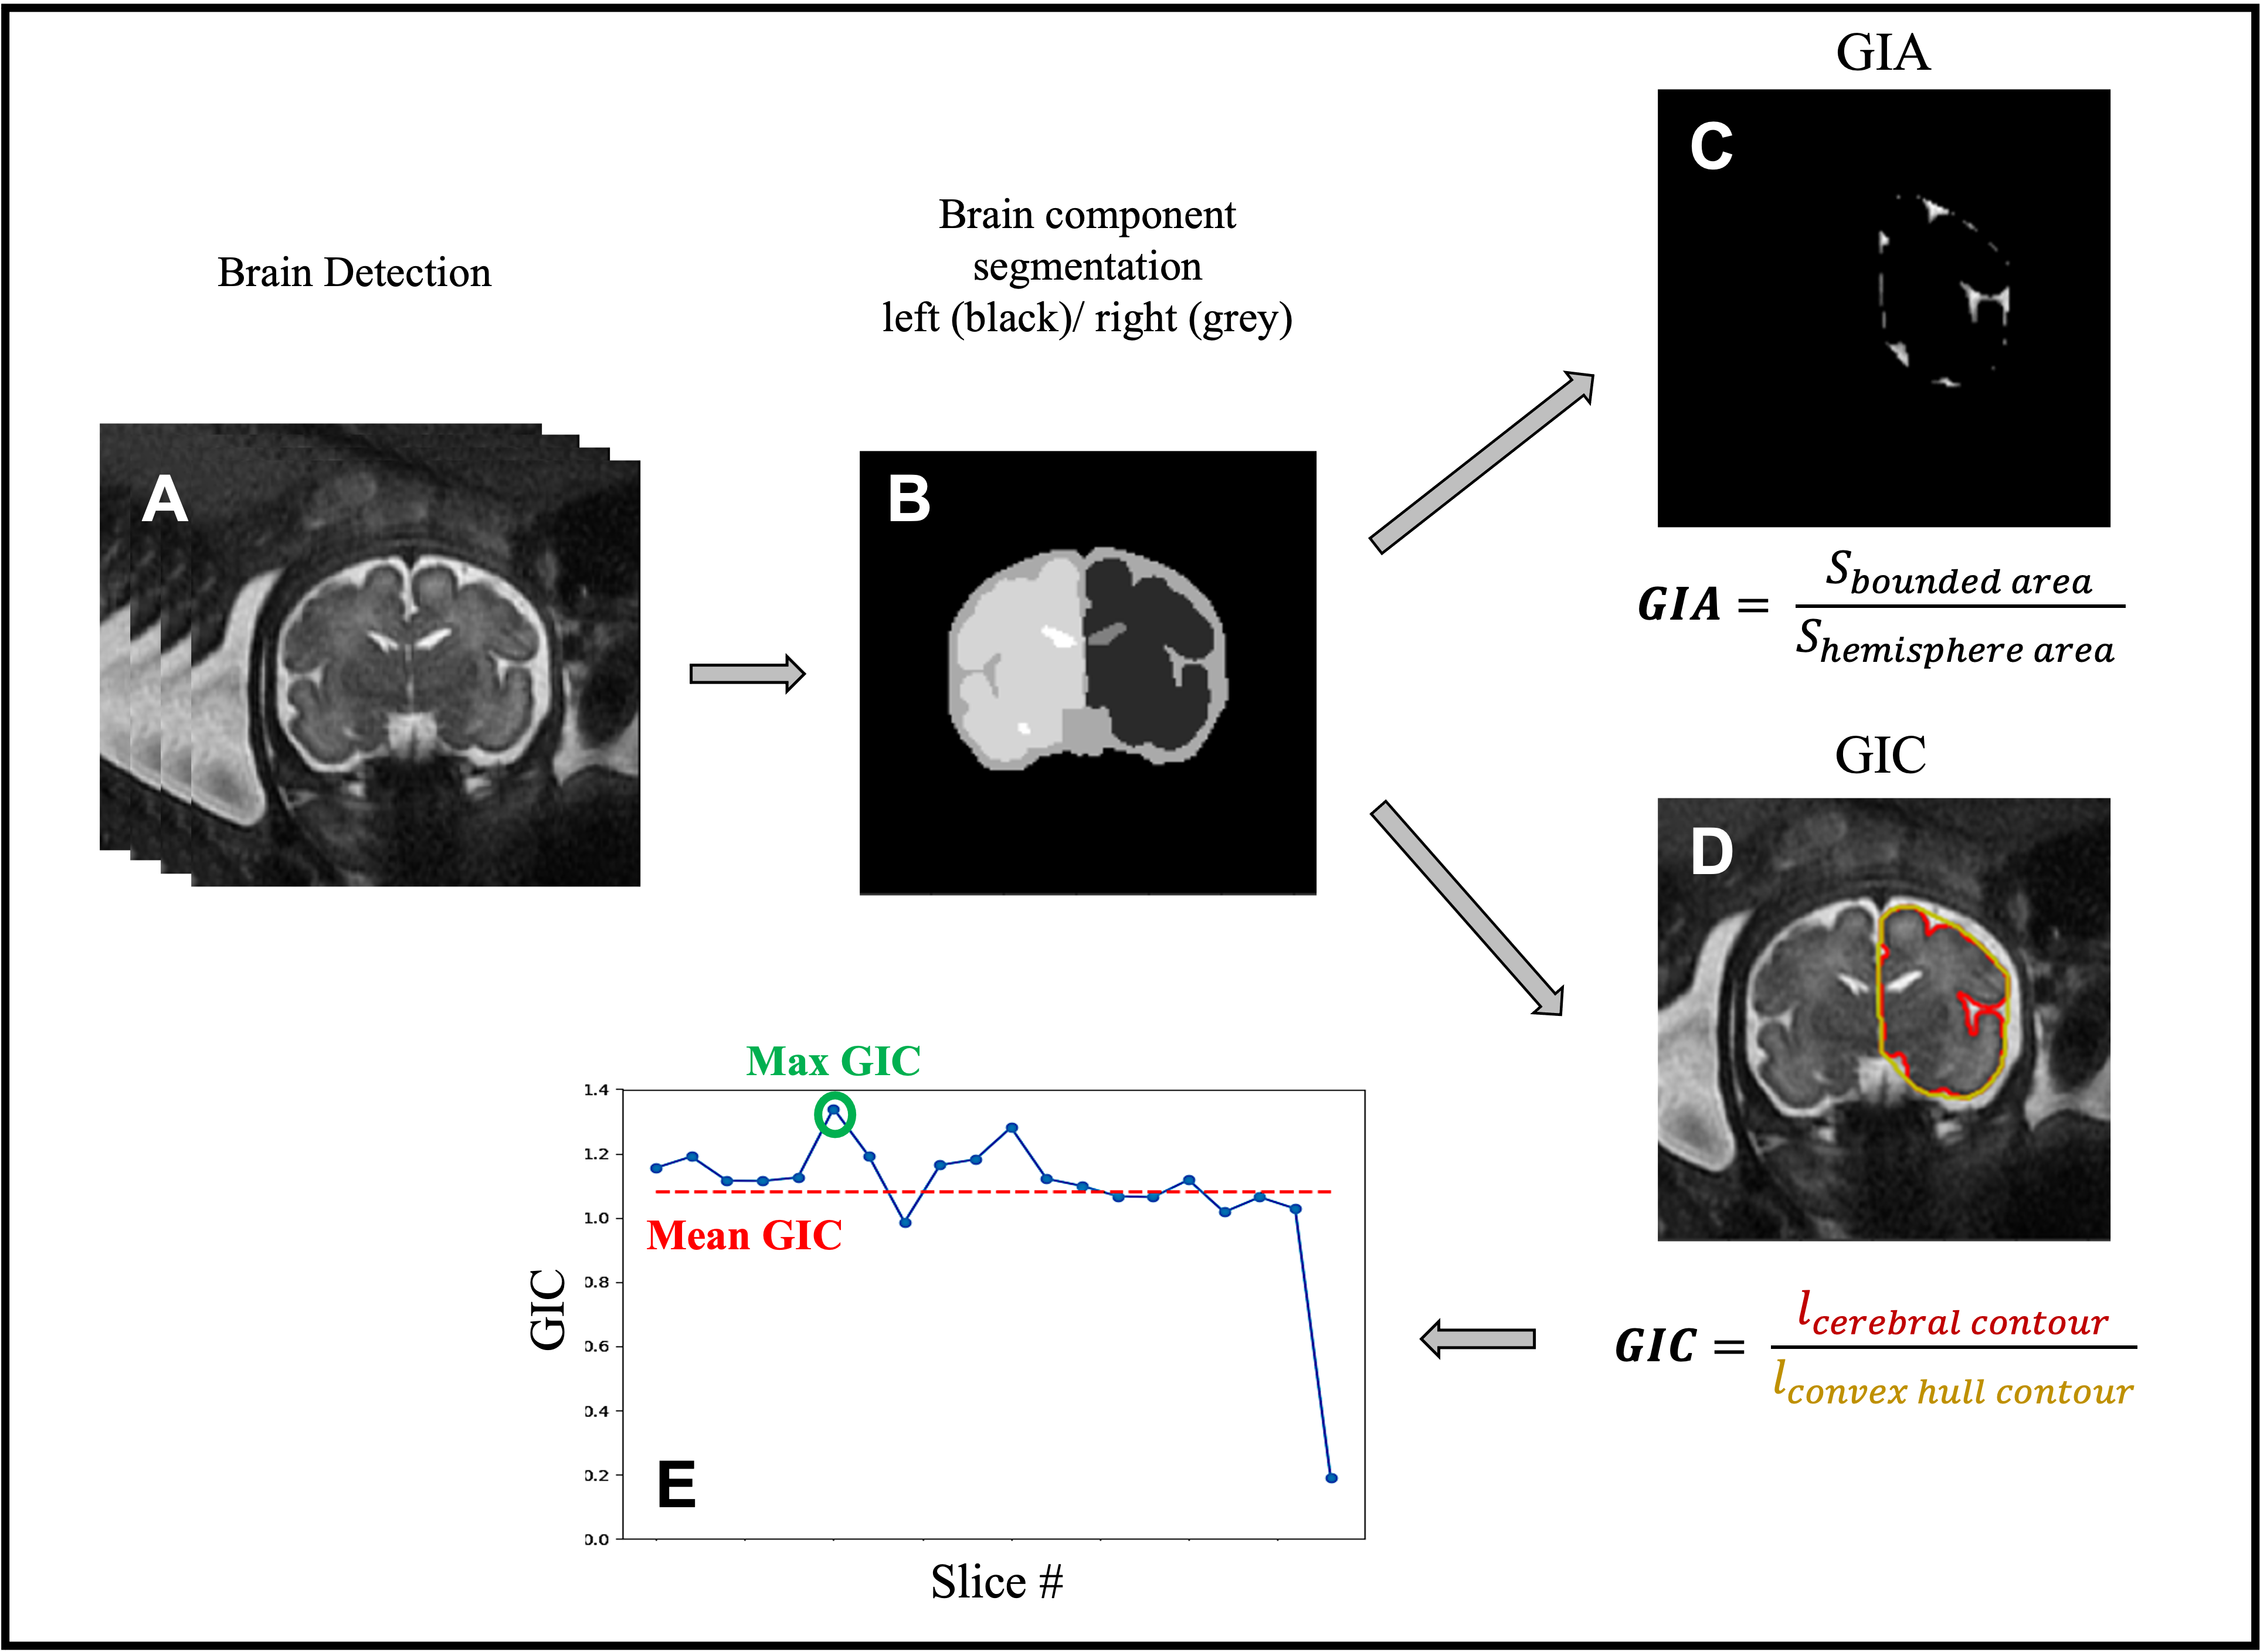
Figure 1: Image analysis pipeline: (A) brain detection. (B) brain component segmentation. (C) gyrification index area (GIA) calculation based on the bounded area (white) between the cerebral cortex and its convex hull, and the hemisphere area (black). (D) gyrification index contour (GIC) calculation based on contour extraction of the cerebral hemisphere (red) and its convex (yellow). (E) GIC profile example of one fetus (all slices).
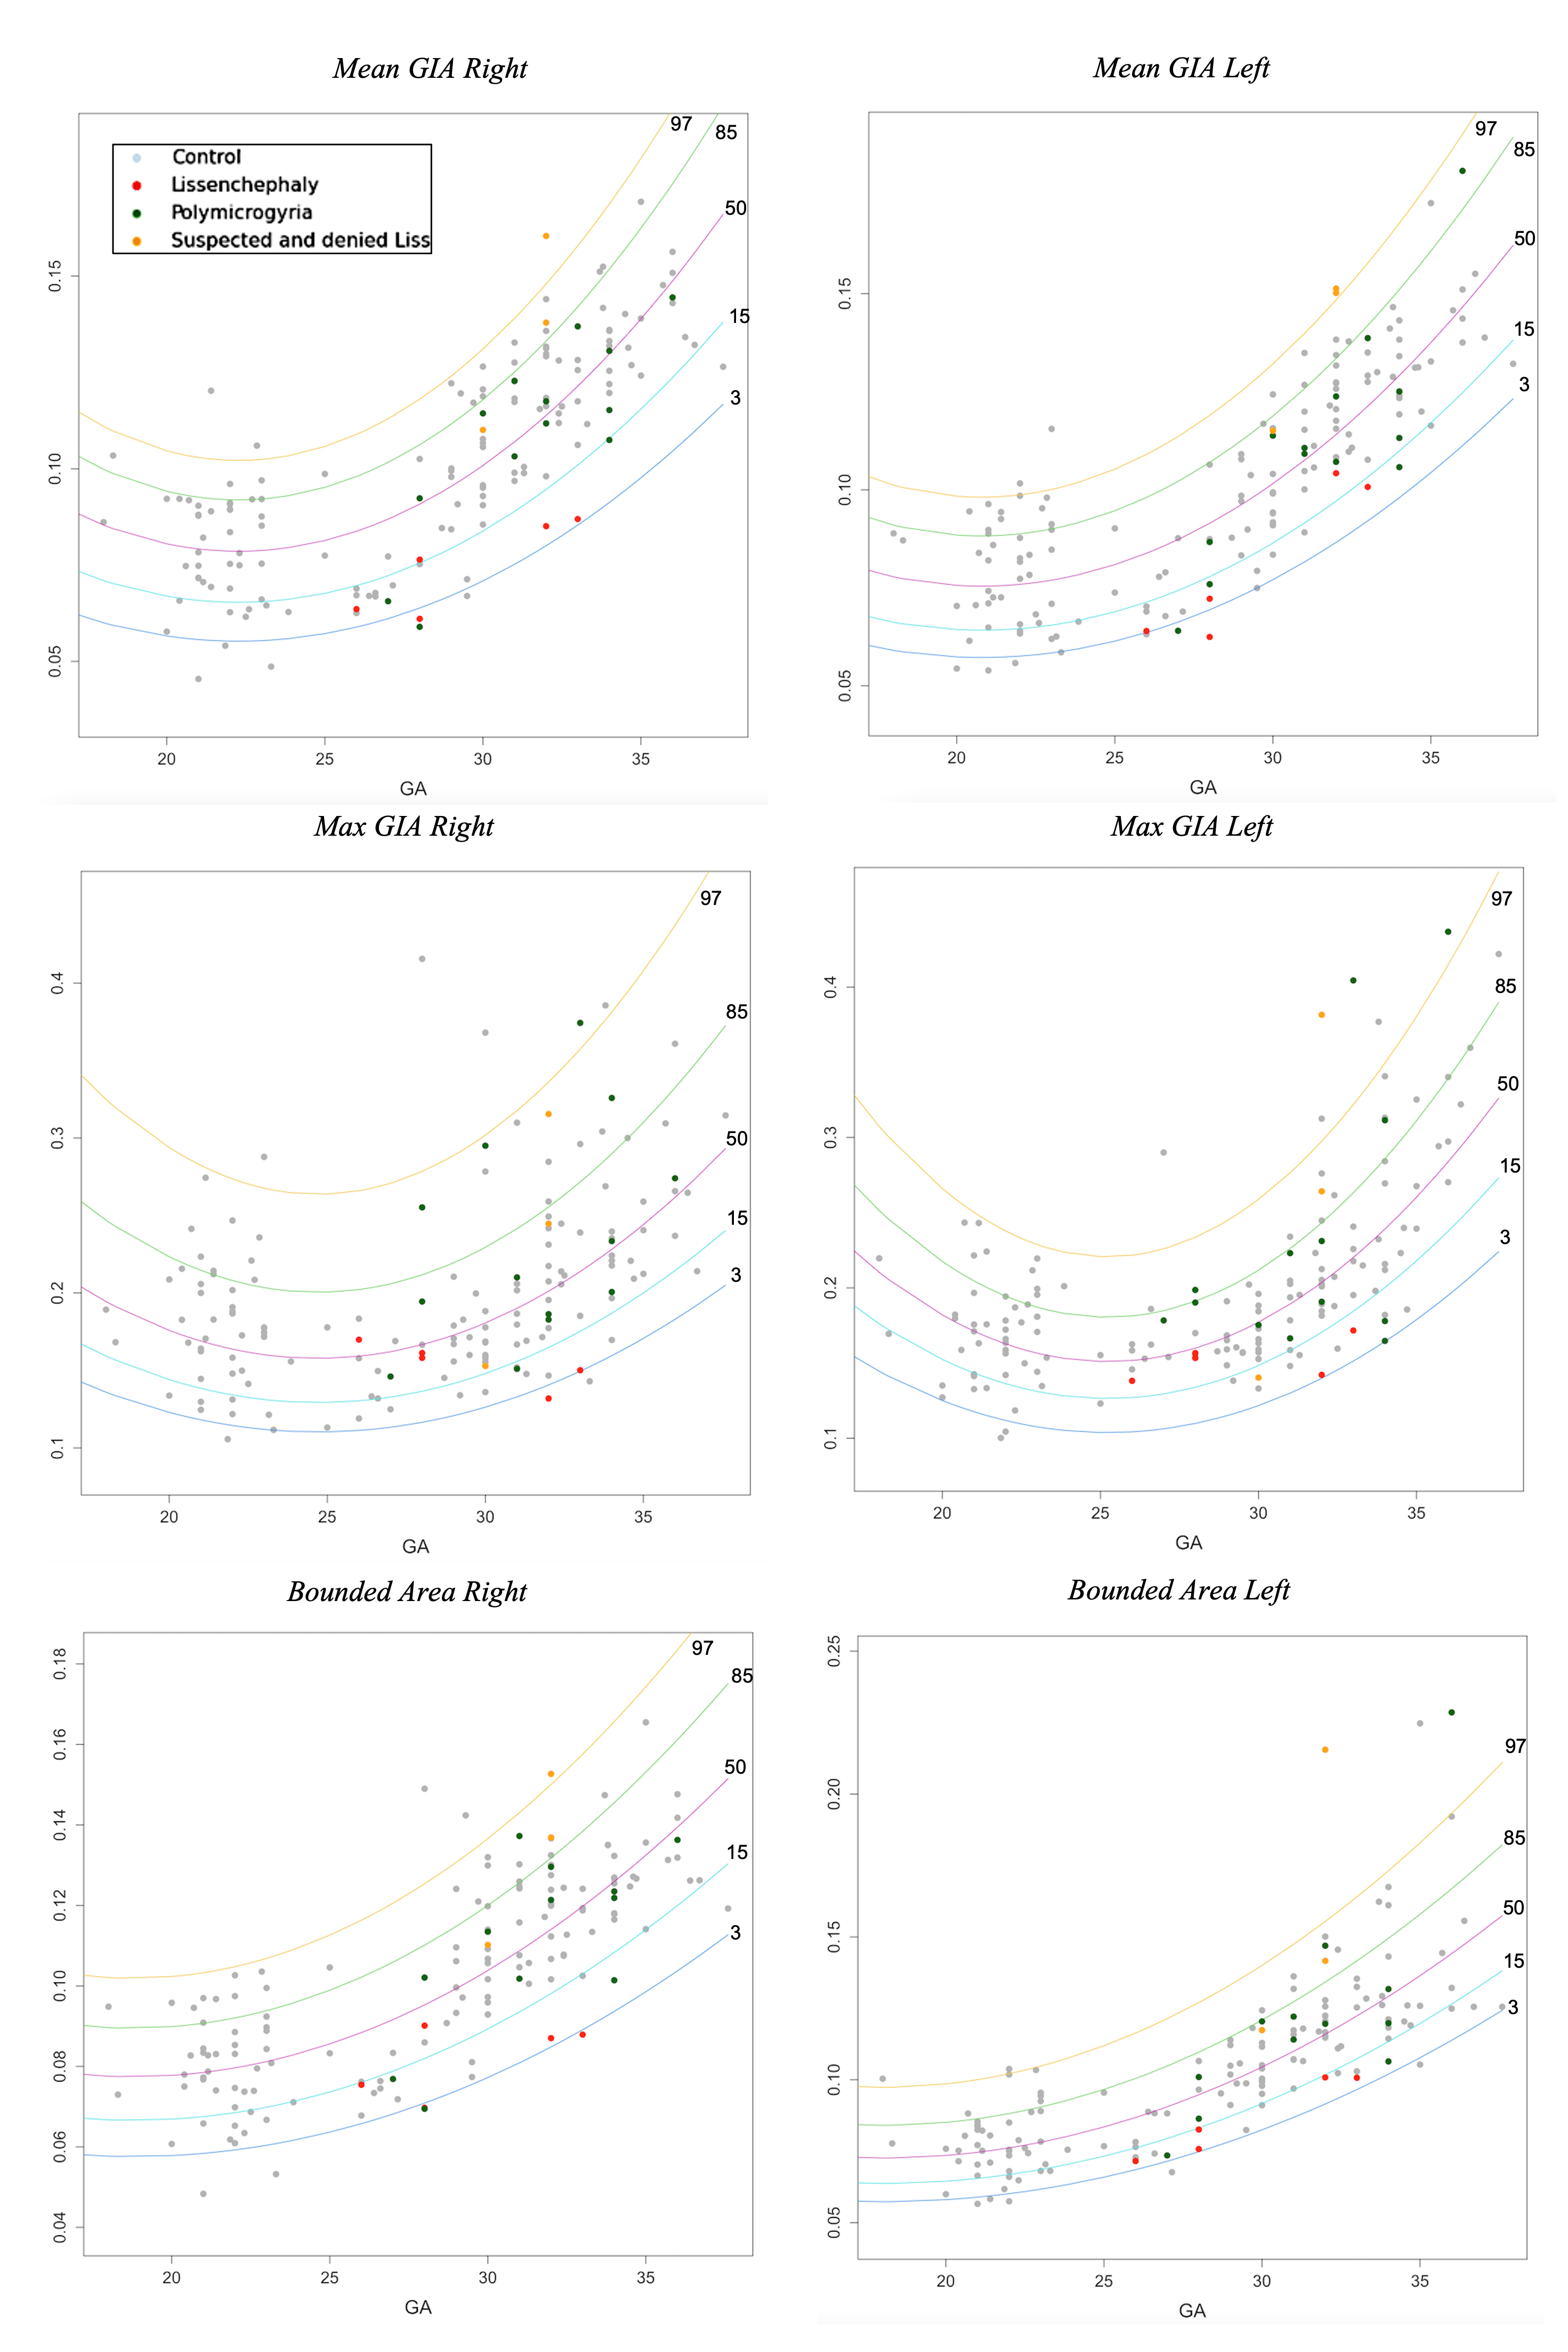
Figure 2: GIA and bounded volume development curves along GA. Curve percentile lines are 3 (blue), 15 (light blue), 50 (purple), 85 (green), and 97 (yellow). Control fetuses are presented (grey). In addition, PMG (green), LIS (red) and suspected LIS (orange).
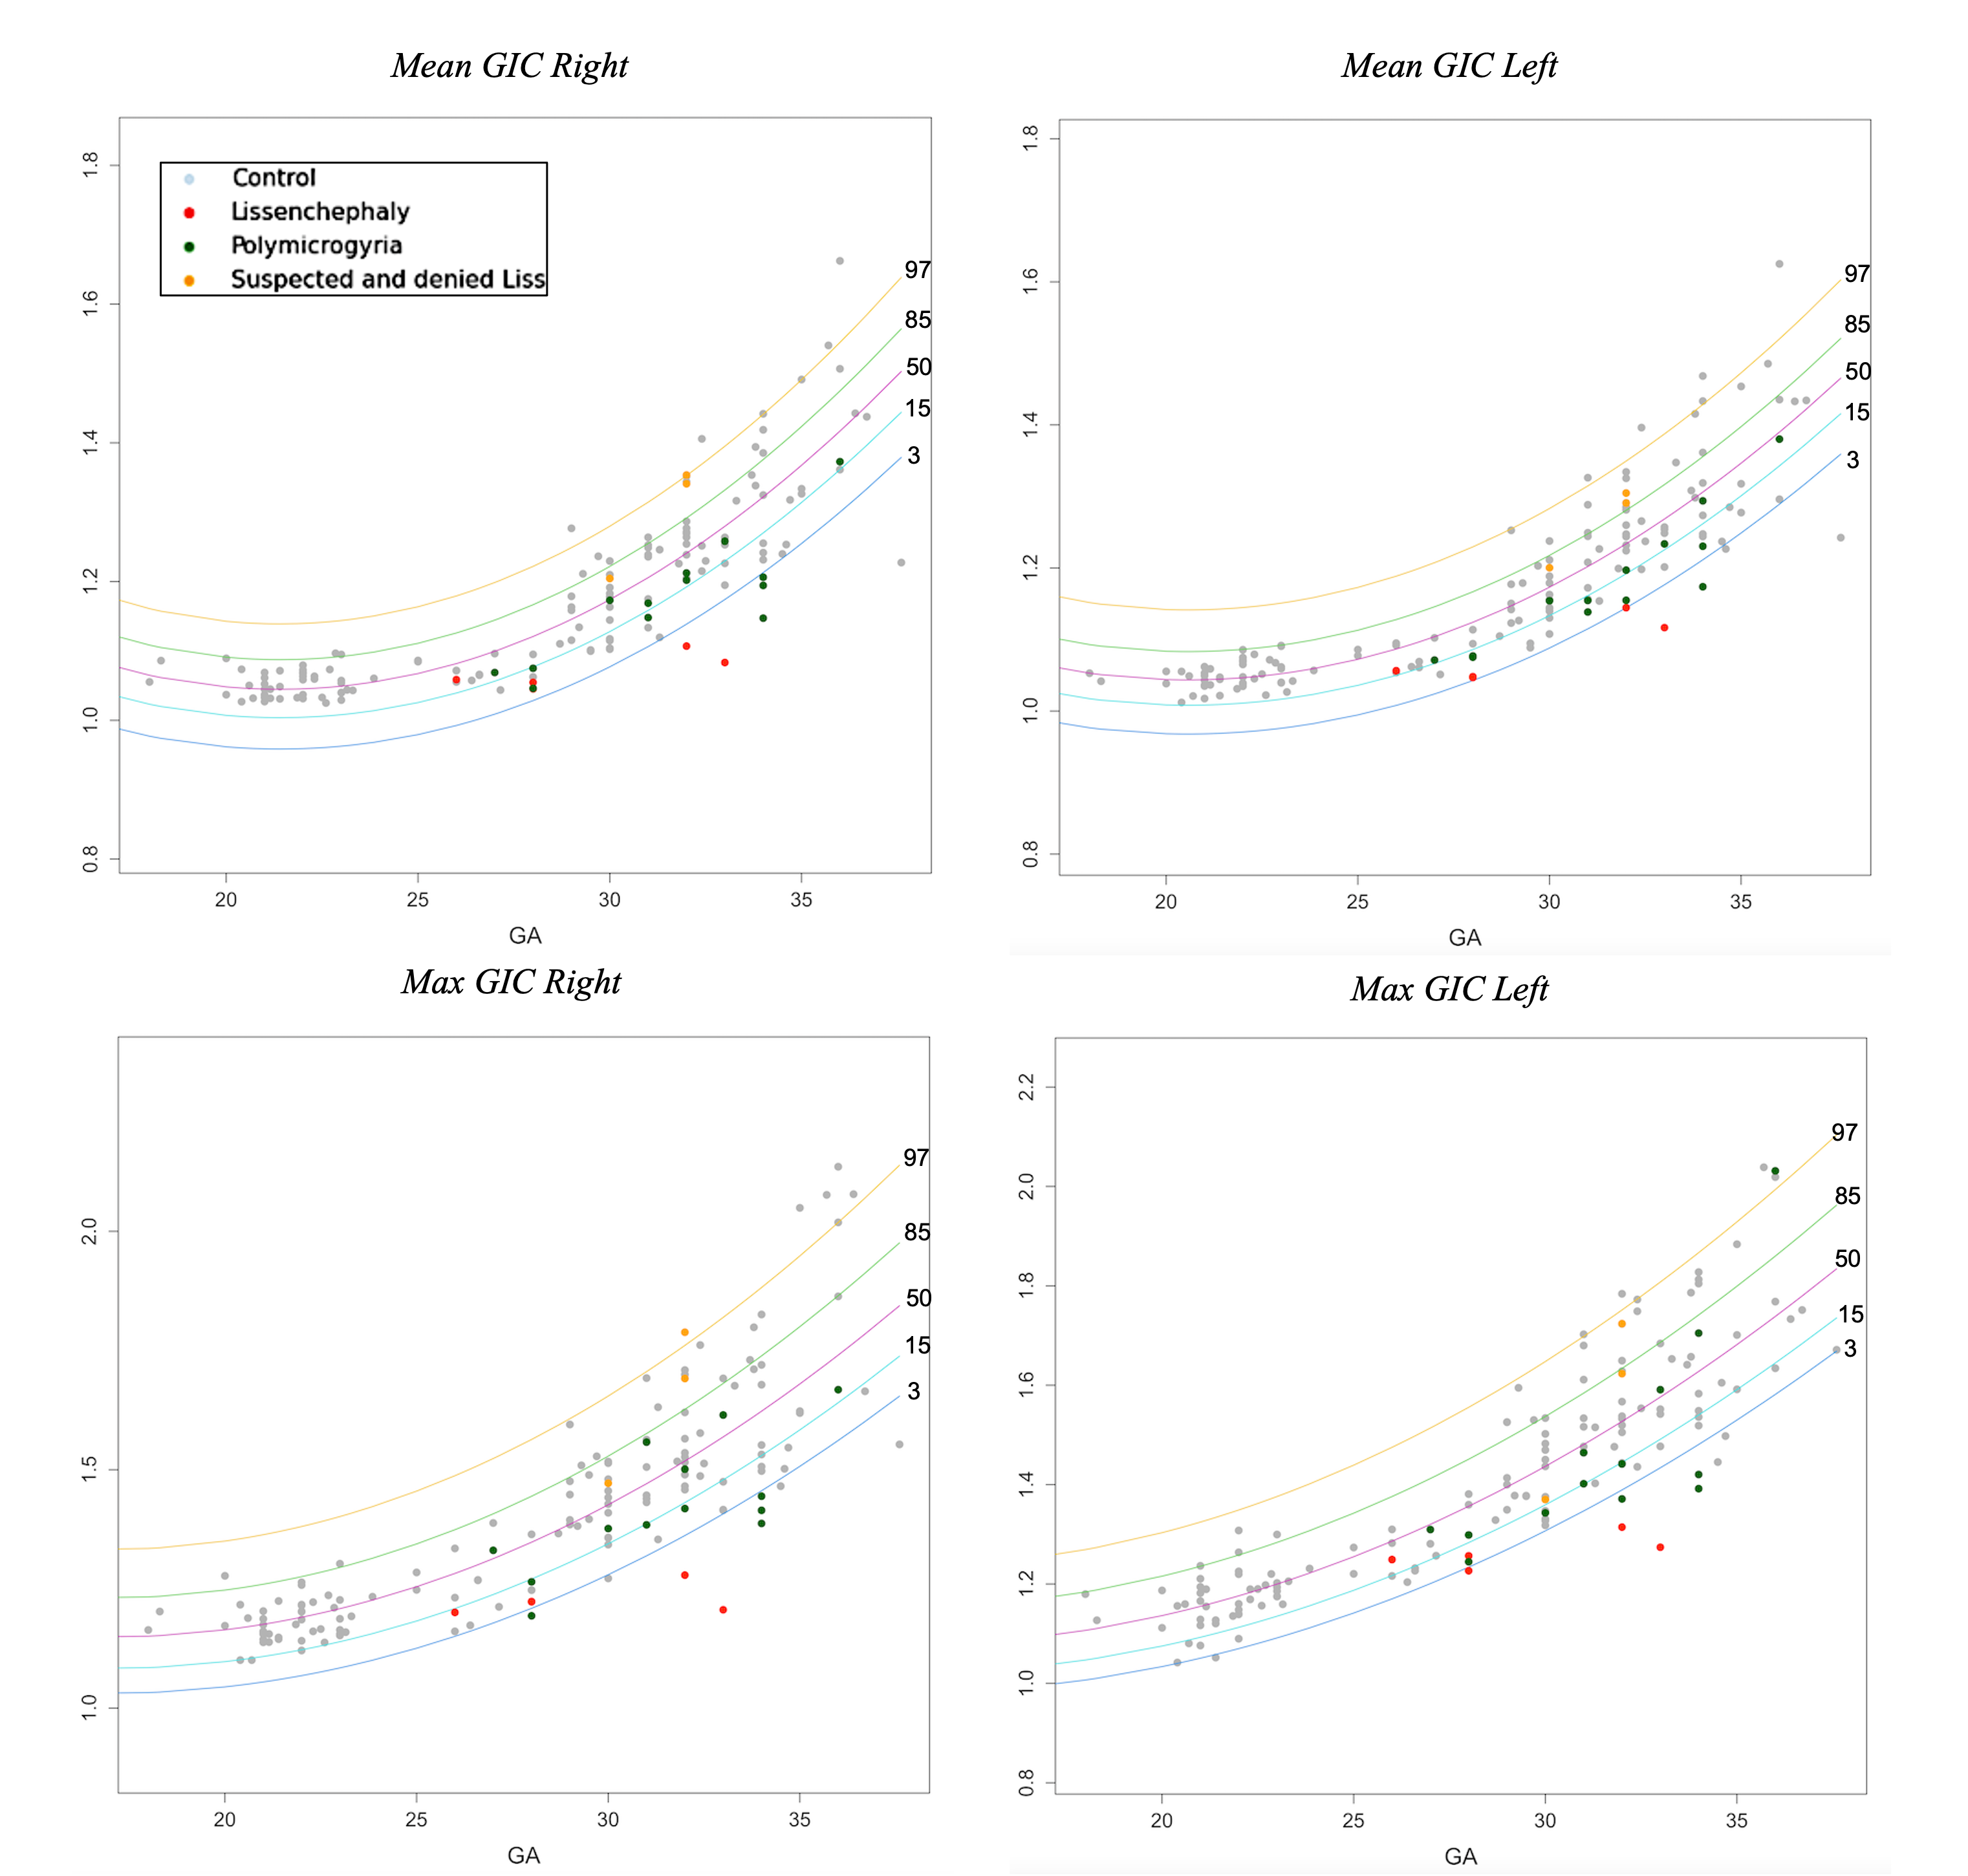
Figure 3: GIC development curves along GA. Curve percentile lines are 3 (blue), 15 (light blue), 50 (purple), 85 (green), and 97 (yellow). Control fetuses are presented (grey). In addition, PMG (green), LIS (red) and suspected LIS (orange).
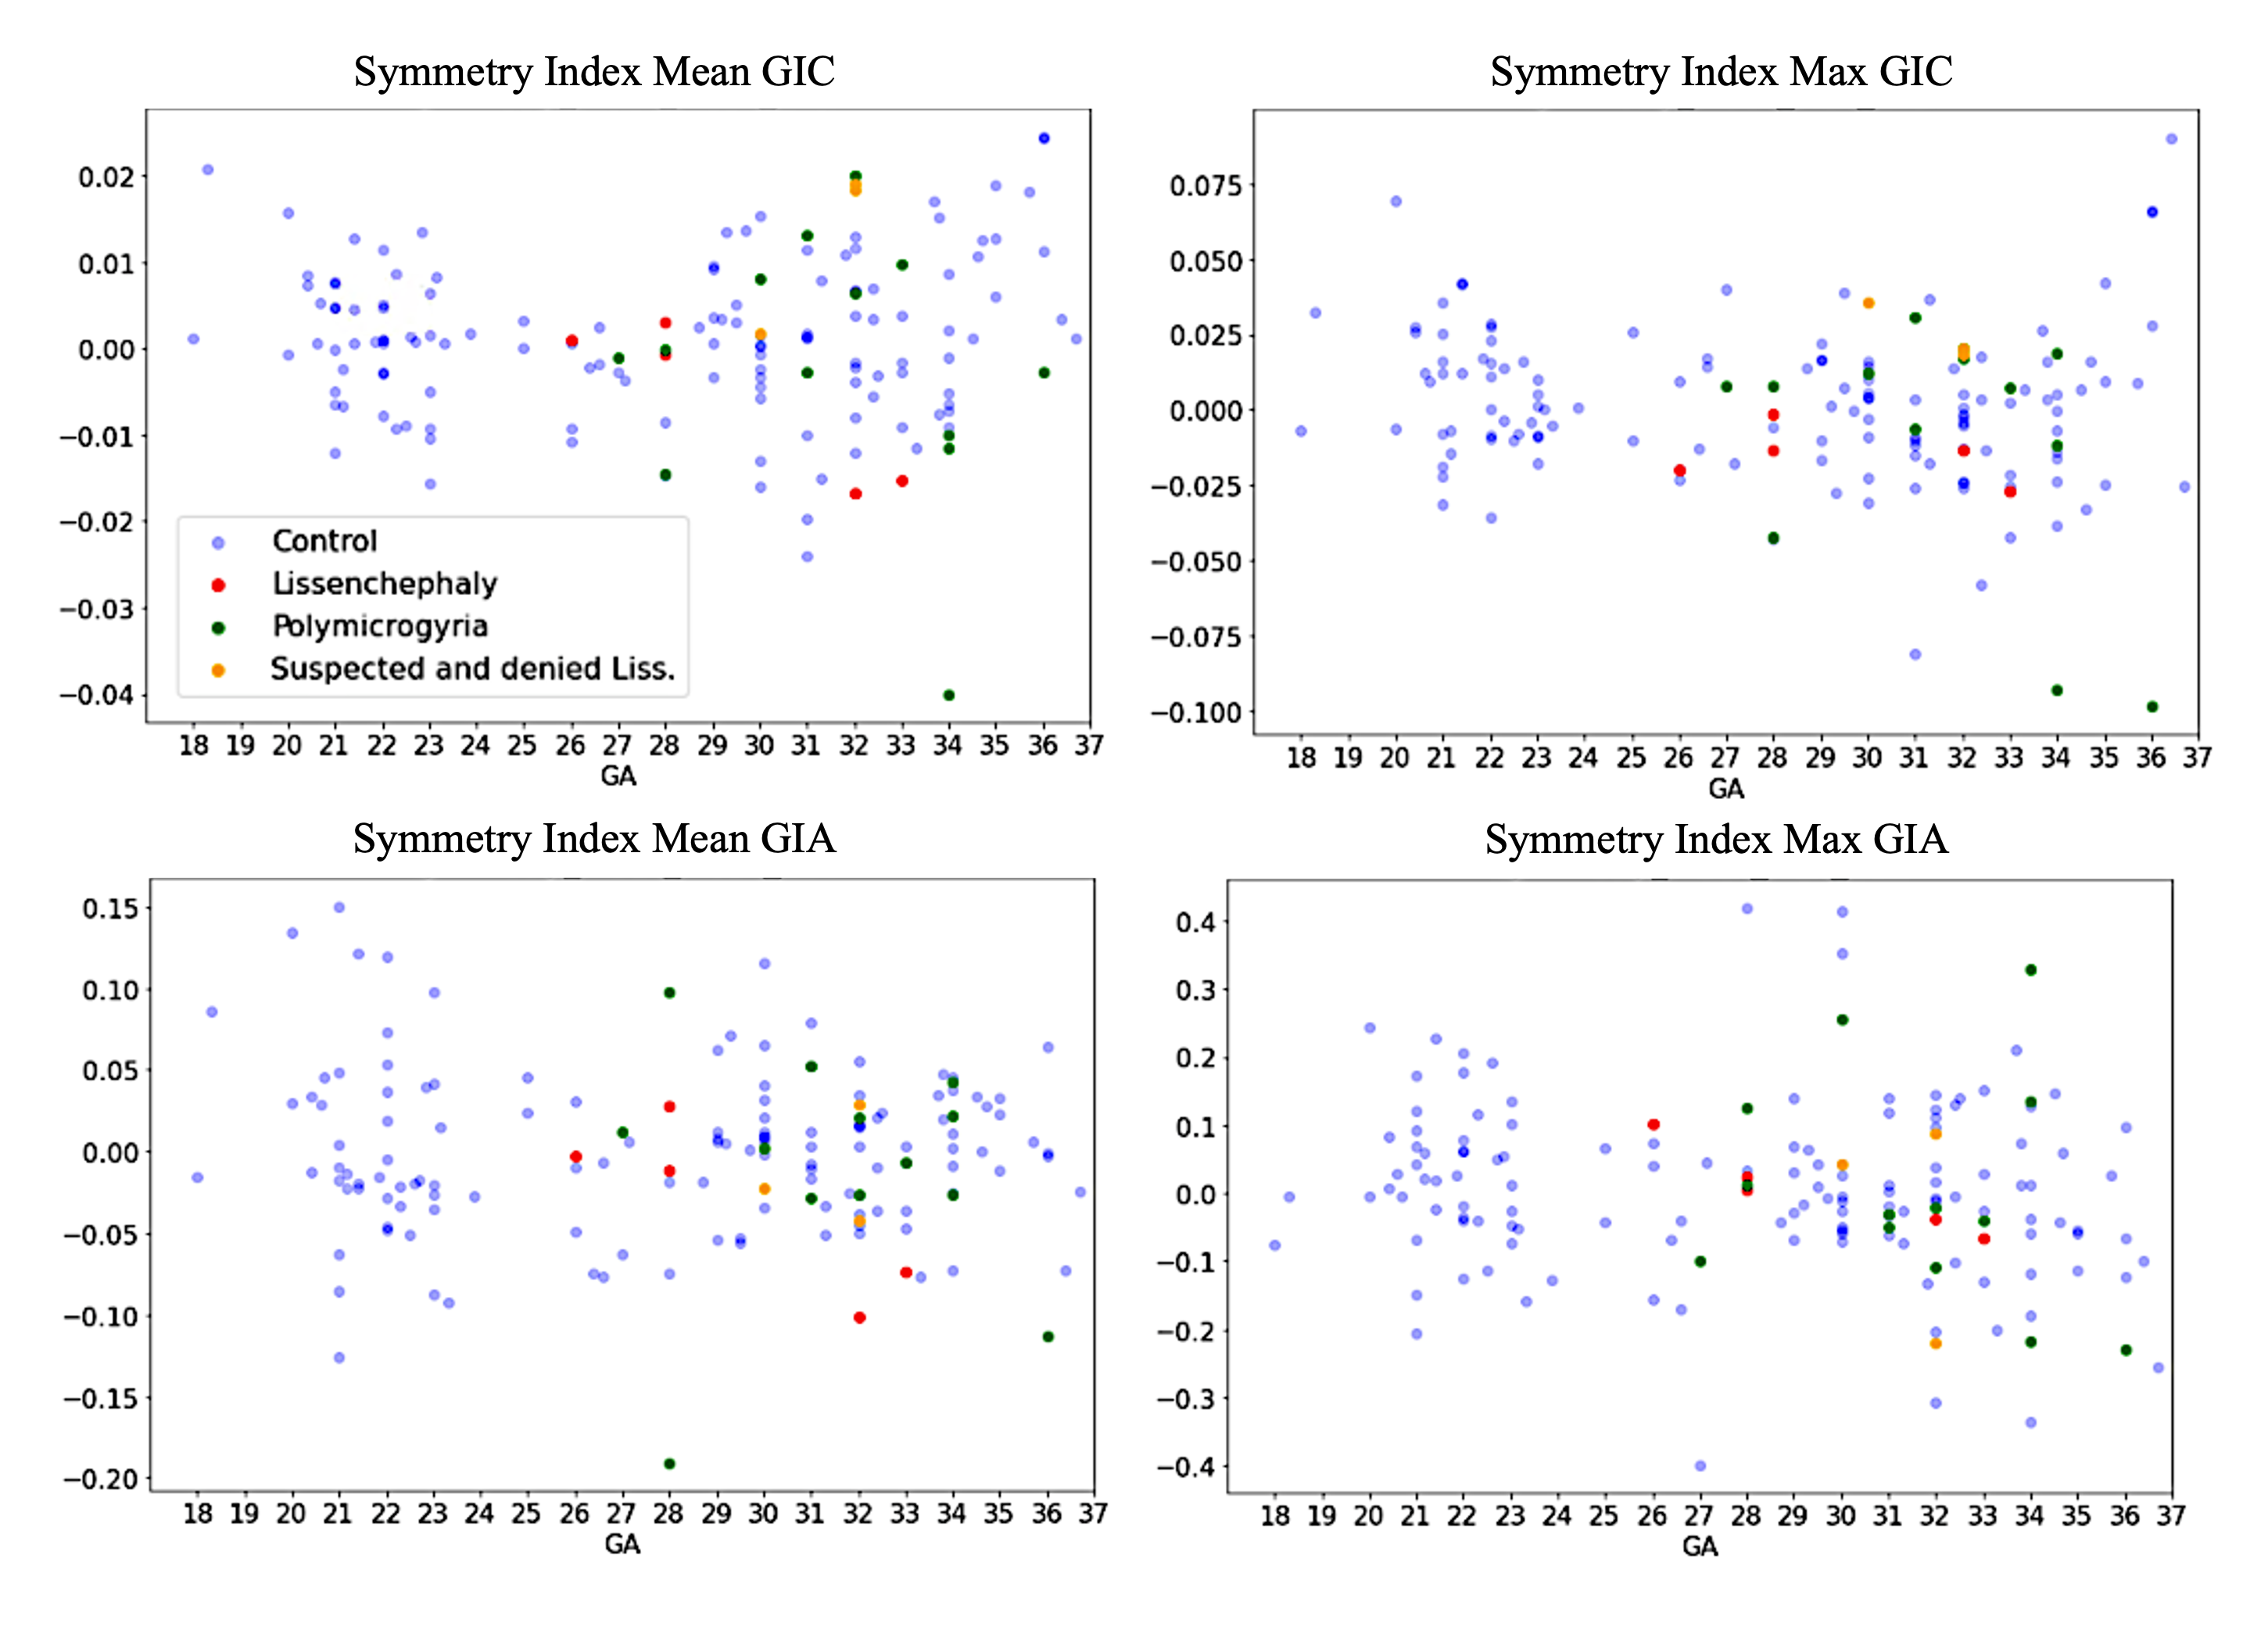
Figure 4: Symmetry index for GI parameters. All are close to zero, with no change along GA, and with homogeneous dispersion, indicating no brain asymmetry.
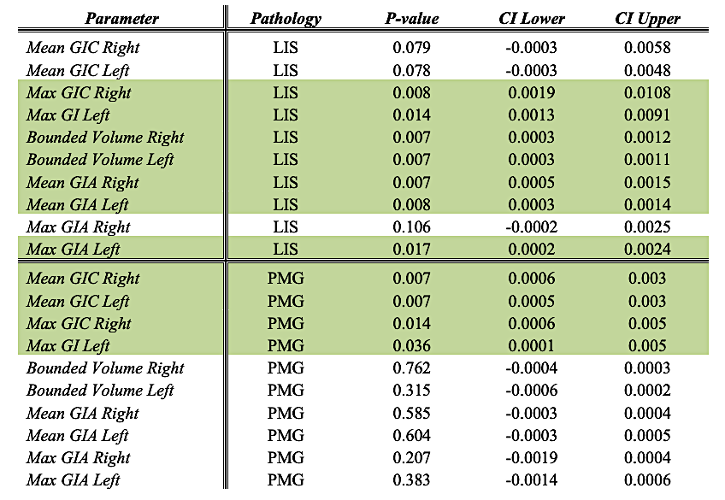
Table 1: the adjusted p-values and confidence interval (CI) when comparing LIS or PMG with control fetuses. Significant differences are marked in green.
DOI: https://doi.org/10.58530/2023/2334