2332
Multi-modal multi-resolution atlas of the human neonatal cerebral cortex based on microstructural similarity1College of Biomedical Engineering & Instrument Science, Zhejiang University, Zhejiang, China
Synopsis
Keywords: Gray Matter, Multimodal, parcellation, morphometric similarity, atlas
In this work, we aimed to generate a comprehensive parcellation of the human neonatal cortex based on multi-modal MRI features. We collected the dataset from the developing human connectome project and estimated ten different MRI features to calculate the similarity between different locations in the neonatal cortex. We developed an automated algorithm based on gradient of the integrated similarity map to generate parcellations at different resolutions. We also provided a manual parcellation based on the multimodal similarity for higher anatomical interpretability. The present work may facilitate structural-functional connectome analysis in early brain development.Introduction
It is widely accepted that the cortical cortex can be divided into many subregions 1,2, based on the distinct cytoarchitecture or specialized functions of these regions. Several parcellations have been established in human adults 2–5, but limited parcellations exist for human neonates. This is an unmet need in the surge of developmental neuroscience. The existing neonate-specific parcellations were all created based on single MRI features (e.g. sulcus or functional connectivity ) 6–8. Nevertheless, combining multiple MRI features could provide complementary and confirmatory information on areal boundaries 2. Therefore, we aimed to generate parcellations of the human neonatal cortex based on the similarity of the combined structural and functional signatures from multi-modal MRI data, which would facilitate both functional and structural connectomics and also integrated structure-function analysis due to its unbiased nature 9.Method
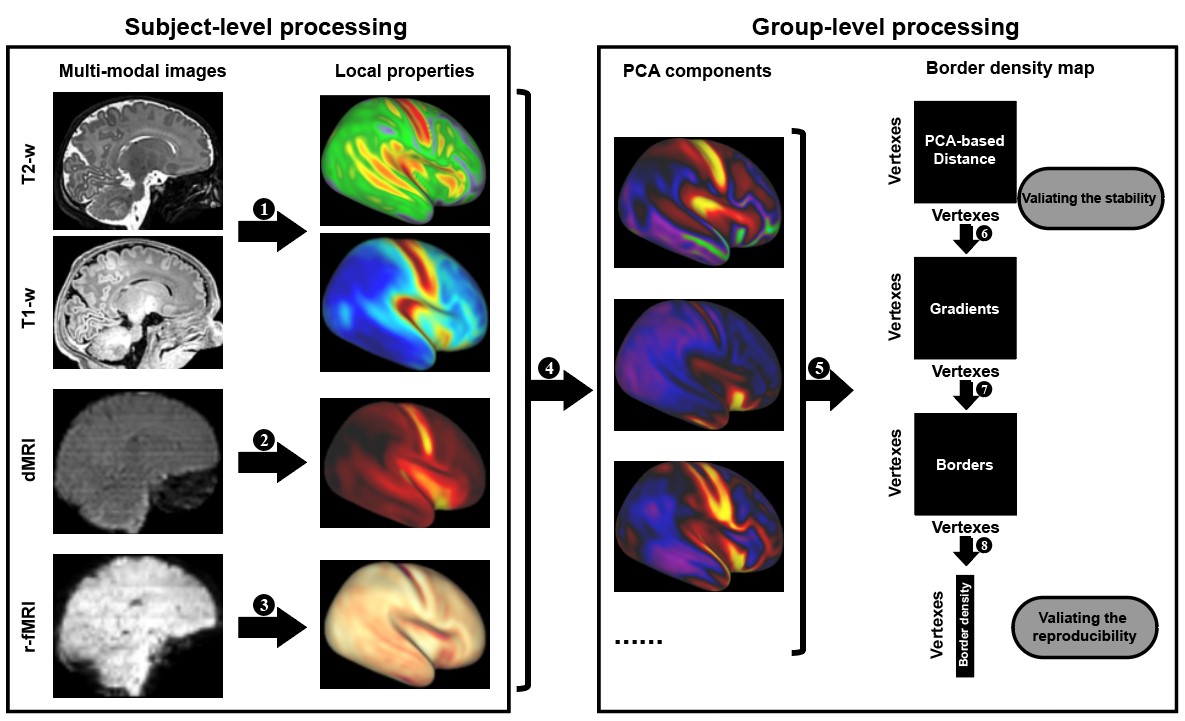
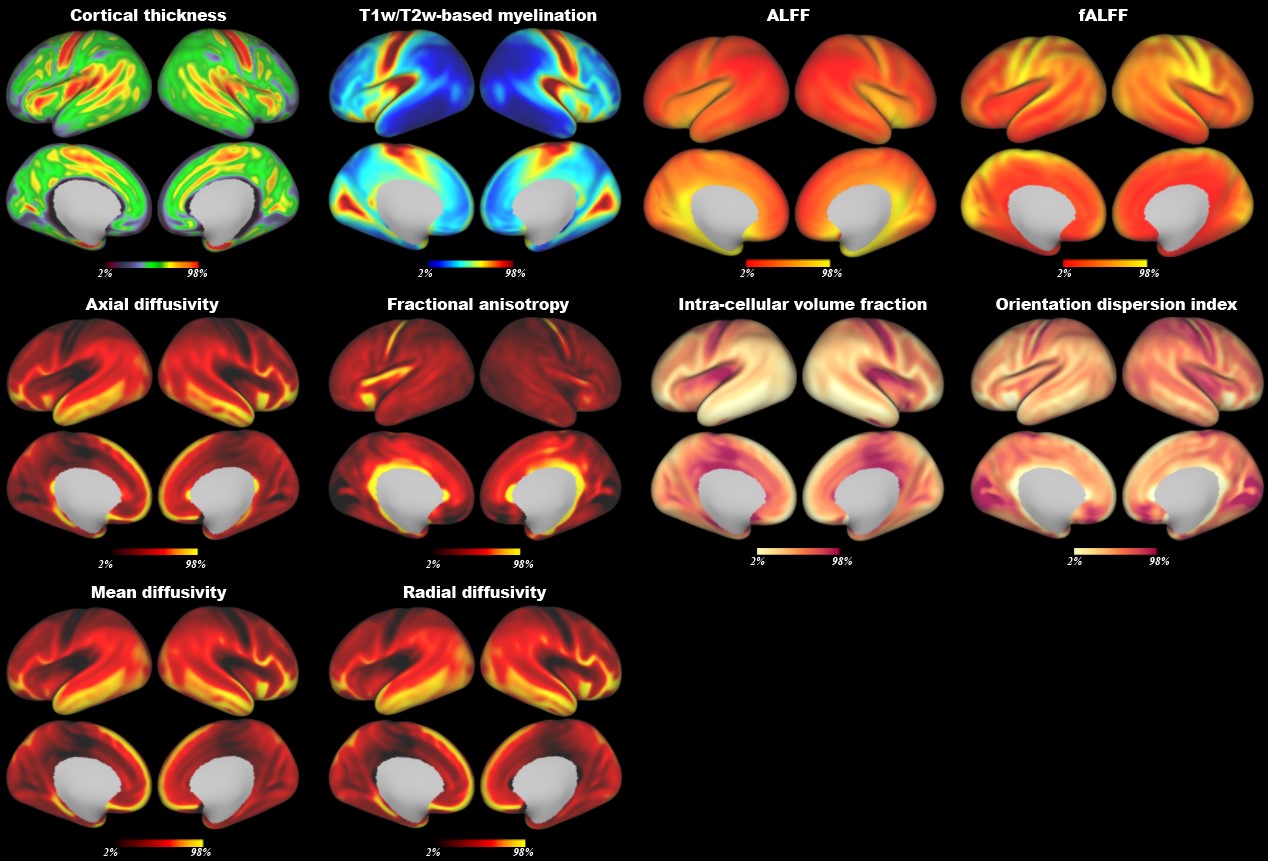
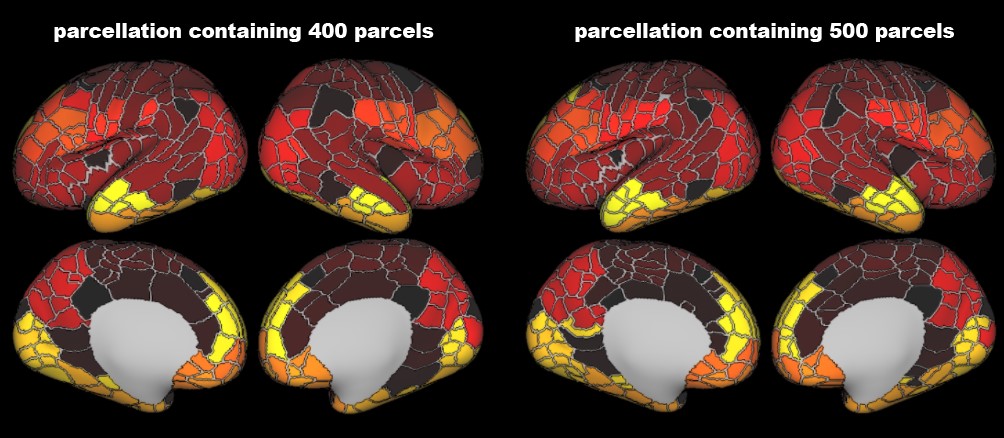
Atlas Generation: The present study included 348 term-born neonates from dHCP. The detailed descriptions of MRI data acquisition and preprocessing were in the previous studies of dHCP 10–12. For each subject, we obtained 10 different cortical feature maps from three MRI modalities, including cortical thickness, T1w/T2w myelination from structural MRI; mean diffusivity, axial diffusivity, radial diffusivity, fractional anisotropy of the tensor model and intra-cellular volume fraction, orientation dispersion of the NODDI model from diffusion MRI; and amplitude of low-frequency fluctuations (ALFF), fractional ALFF, from rest-state functional MRI. Those maps were averaged vertex-wise across subjects followed by slight smoothing with a 2mm FWHM. We applied the PCA algorithm to transform the original 10 features into lower dimensionality which could explain the major variation (above 90%). The generated PCA maps were used to estimate the similarity between different vertices by calculating the Mahalanobis distance 13,14 across the PCA components, resulting in a 32k × 32k local-similarity matrix for each hemisphere. We used the “watershed by flooding” algorithm 15 to identify the tentative boundaries in the gradient maps. The boundary map was further to generate a border density map 5 (see Fig 1 for the flowchart). Finally, we applied an automated algorithm 5 to generate the parcellations with different resolutions (300, 400, 500 parcels) and used a manual approach to produce a nearly symmetric parcellation. Stability and reliability test: To test how the choice of MRI features affects the final analysis (aka, stability of the parcellation), we estimated the contribution of each feature on the averaged distance map by a leave-one-out approach. Specifically, we repeated the above procedures to generate a PCA-based distance map after we left one feature out and then calculated the Pearson correlation between this new map and the original map. In addition, we estimated the stability of the distance map by removing all derived measurements from a single MRI modality. To determine if our parcellation was reliable at the group level, we separated the neonates into two groups with an equal number of subjects and calculated the spatial correlation between the two groups in terms of the 10 MRI features and the derivate maps.Results
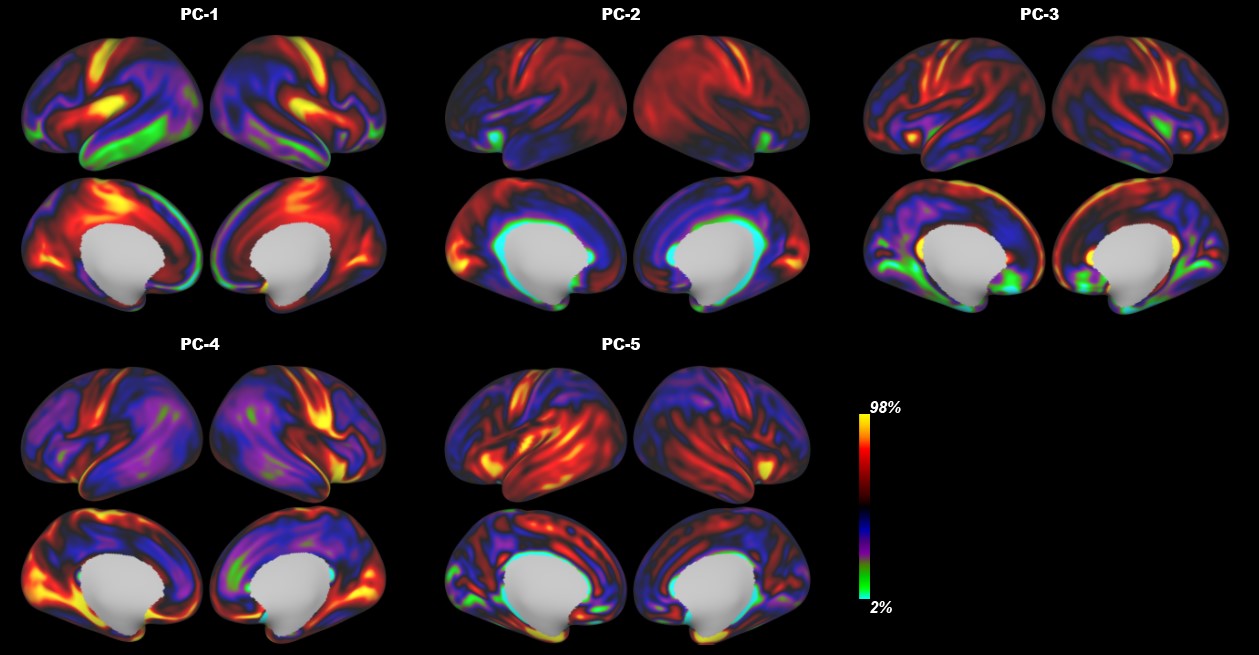
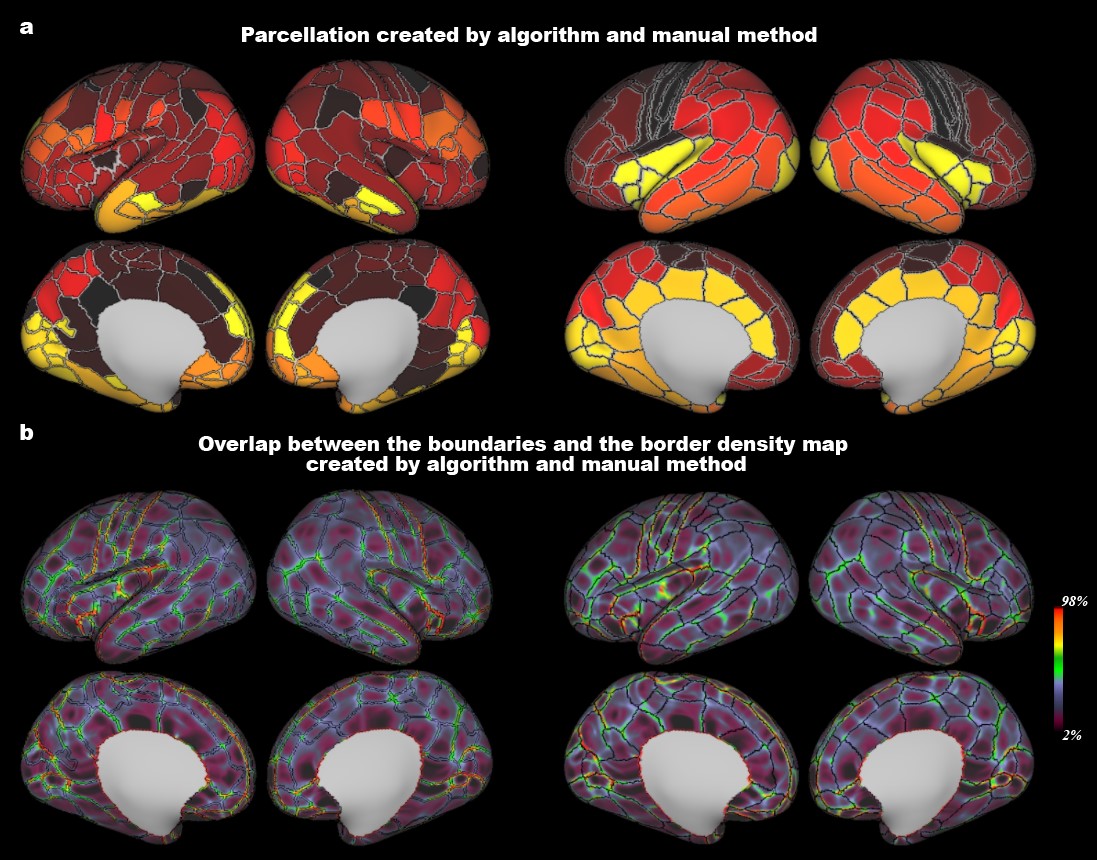
The population-averaged surface maps of 10 MRI features from 348 term-born neonates (mean age 39.93 ± 1.25; 164 females) showed distinct spatial patterns (Fig 2). We selected the first 5 components (Fig 3) from PCA analysis to calculate the paired distance of vertices in the right and left hemispheres, respectively. The spatial correlations of the averaged distance map between the leave-one-feature-out maps and the all-feature map were high in all the cases (r = 0.93 – 0.99). The correlations were still high (r = 0.81 – 0.99) even when we remove all derivatives from one MRI modality, suggesting that the PCA-based distance map was relatively stable regardless of the choice of MRI features. Furthermore, the two split-half groups showed high consistency in all MRI properties (r = 0.991 – 0.999), as well as the averaged distance maps, gradient maps, and border density maps (r = 0.94 – 0.99), indicating high reliability of the boundary information regardless of the choice of subjects. The final cortical parcellations from both automated and manually approaches were presented at multiple resolutions in Fig 4-5 and will be available online soon.Discussion and Conclusion
We proposed multi-modal-based cortical parcellations designed for the neonatal brain. The PCA-based distance map used for parcellation integrated 10 MRI features from macrostructural, microstructural, and functional levels, which was shown to be stable to the choice of MRI features and repeatable to the neonatal populations. We utilized this cross-modal information to generate the parcellations by an automatic algorithm at multiple resolutions (300-500 parcels), as well as manually delineated parcellation with good interpretability and symmetry, to be adaptable to various needs in future studies about the development of human connectome.Acknowledgements
This work was supported by the Ministry of Science and Technology of the People’s Republic of China (2018YFE0114600, 2021ZD0200202), the National Natural Science Foundation of China (81971606, 82122032), and the Science and Technology Department of Zhejiang Province (202006140, 2022C03057). Data were provided by the developing Human Connectome Project, KCL-Imperial-Oxford Consortium funded by the European Research Council under the European Union Seventh Framework Programme (FP/2007-2013) / ERC Grant Agreement no. 319456. We are grateful to the families who generously supported this trial.References
1. Van Essen, D. C. et al. Cerebral cortical folding, parcellation, and connectivity in humans, nonhuman primates, and mice. Proc. Natl. Acad. Sci. U. S. A. 116, 26173–26180 (2019).
2. Glasser, M. F. et al. A multi-modal parcellation of human cerebral cortex. Nature 536, 171–178 (2016).
3. Tzourio-Mazoyer, N. et al. Automated anatomical labeling of activations in SPM using a macroscopic anatomical parcellation of the MNI MRI single-subject brain. Neuroimage 15, 273–289 (2002).
4. Zhang, Y. et al. Connectivity-based parcellation of the human posteromedial cortex. Cereb. Cortex 24, 719–727 (2014).
5. Gordon, E. M. et al. Generation and Evaluation of a Cortical Area Parcellation from Resting-State Correlations. Cereb. Cortex 26, 288–303 (2016).
6. Adamson, C. L. et al. Parcellation of the neonatal cortex using Surface-based Melbourne Children’s Regional Infant Brain atlases (M-CRIB-S). Sci. Rep. 10, 1–11 (2020).
7. Alexander, B. et al. A new neonatal cortical and subcortical brain atlas: the Melbourne Children’s Regional Infant Brain (M-CRIB) atlas. Neuroimage 147, 841–851 (2017).
8. Shi, F., Salzwedel, A. P., Lin, W., Gilmore, J. H. & Gao, W. Functional Brain Parcellations of the Infant Brain and the Associated Developmental Trends. Cereb. Cortex 28, 1358–1368 (2018).
9. Caspers, S., Eickhoff, S. B., Zilles, K. & Amunts, K. Microstructural grey matter parcellation and its relevance for connectome analyses. Neuroimage 80, 18–26 (2013).
10. Hughes, E. J. et al. A dedicated neonatal brain imaging system. Magn. Reson. Med. 78, 794–804 (2017).
11. Makropoulos, A. et al. The developing human connectome project: A minimal processing pipeline for neonatal cortical surface reconstruction. Neuroimage 173, 88–112 (2018).
12. Bastiani, M. et al. Automated processing pipeline for neonatal diffusion MRI in the developing Human Connectome Project. Neuroimage 185, 750–763 (2019).
13. Amunts, K., Mohlberg, H., Bludau, S. & Zilles, K. Julich-Brain: A 3D probabilistic atlas of the human brain’s cytoarchitecture. Science. 369, 988–992 (2020).
14. Zilles, K. & Amunts, K. Centenary of Brodmann’s map conception and fate. Nat. Rev. Neurosci. 11, 139–145 (2010).
15. Beucher, S. & Lantuejoul, C. Use of Watersheds in Contour Detection. (1979).
Figures