2328
Evaluations of tumor acidosis that monitors early response to radiotherapy in a glioblastoma model using acidoCEST MRI1Cancer Systems Imaging, UT MD Anderson Cancer Center, Houston, TX, United States, 2Center for Biosystems Science and Engineering, Indian Institute of Science, Bangalore, India
Synopsis
Keywords: Cancer, CEST & MT, pH imaging
The treatment of glioblastoma potentially causes tumor necrosis, which has reduced glycolytic metabolism. AcidoCEST MRI measures tumor acidosis caused by tumor glycolysis. Our study demonstrated that acidoCEST MRI, a molecular imaging method that measures tumor extracellular pH, can detect a decrease in pHe < 7.0 for tumors that resisted radiotherapy or were untreated, and can detect an increase in pHe > 7.0 for tumors that were successfully treated or showed evidence for necrosis.INTRODUCTION
Glioblastoma is often treated with radiotherapy that causes tumor necrosis. However, there is a key need to evaluate the early response of the tumor soon after radiotherapy, to identify tumors that are inadequately responding to treatment.1,2 A key consequence of early-stage necrosis is reduced metabolism, specifically glycolysis. Because glycolysis causes the production and secretion of lactic acid in tumors (the Warburg effect),3 including glioblastoma,4 the extracellular pH (pHe) of the tumor microenvironment is a putative biomarker for the early response of glioblastoma to radiotherapy.We have developed acidoCEST MRI that can measure tumor pHe.5 This molecular imaging method uses chemical exchange saturation transfer (CEST) MRI with an exogenous contrast agent, iopamidol. We analyze CEST spectra of iopamidol using the Bloch-McConnell equations that are modified to include pH as a fitting parameter.6 For this study, we hypothesized that acidoCEST MRI with iopamidol can measure pHe in GBM before and after radiotherapy, which can be used as a biomarker of early response to radiotherapy that causes necrosis.
METHODS and MATERIALS
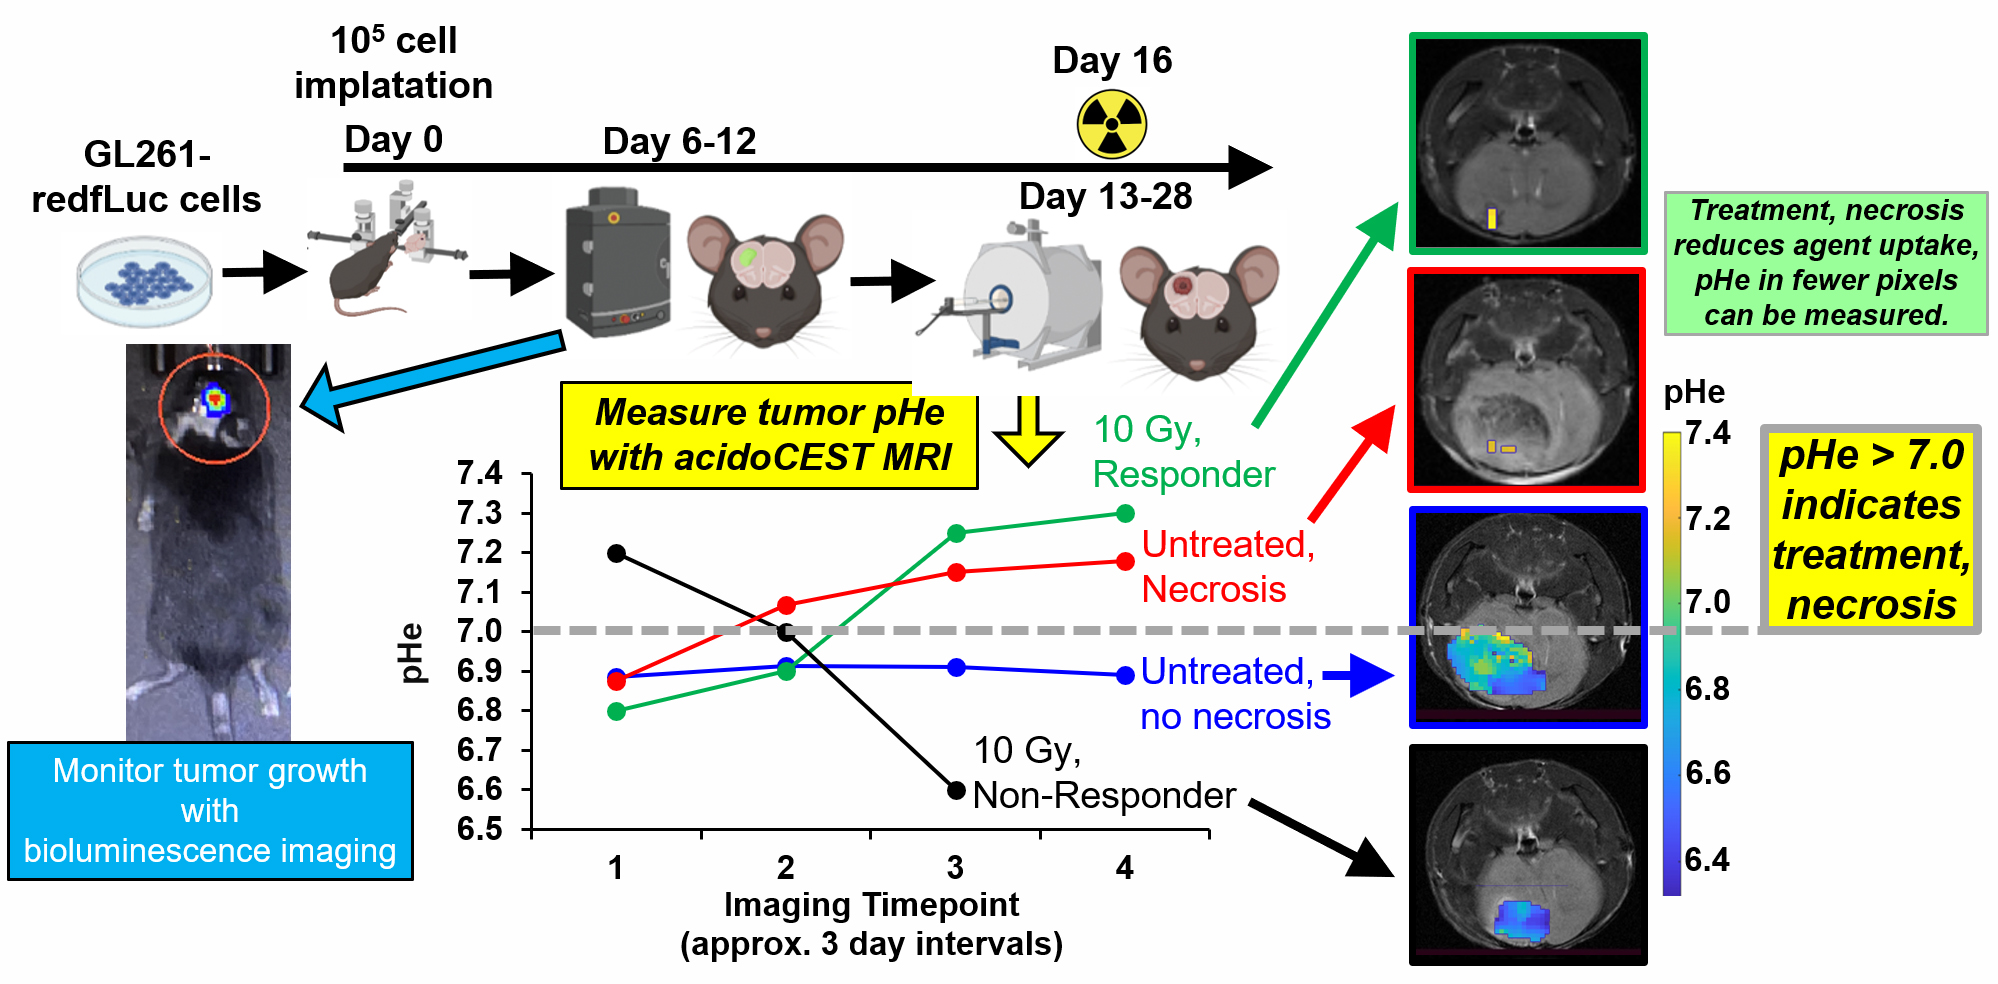
We implanted 105 GL261-fLuc cells in the right cerebral hemisphere (1 mm anterior and 2 mm lateral to the bregma, at a depth of 2 mm) in C57BL/6J mice using a stereotactic holder (Figure 1). We monitored tumor growth starting on Day 6 post-cell implantation using bioluminescence imaging 200 μL of 15 mg/mL D-luciferin injected i.p. Once the bioluminescence signal exceeded 107 photons/sec/cm2/steradian, we used a T2-weighted RARE acquisition to provide excellent image contrast between tumor and normal brain tissue.When the orthotopic brain tumors reached 2-3 mm in diameter, the mouse model was treated with 10 Gy radiation therapy. Mice were imaged at 4 time points to follow the progression of tumor growth and treatment, starting before treatment, at 1 day after treatment, and approximately 3-4 day intervals for the remainder of the study.
To prepare for scanning, a mouse was anesthetized with 1.5-2.0% isoflurane, and a 27g catheter was inserted in the tail vein to facilitate the intravenous administration of iopamidol, a clinically approved CT agent that we have repurposed for acidoCEST MRI. Probes for monitoring rectal temperature and respiratory rate were attached, and temperature was regulated at 37.0 ± 1°C using warm air. We acquired anatomical MR images to ensure positioning of the tumor in the scanner. We then acquired B0 and B1 maps prior to CEST MRI to account for magnetic field inhomogeneity. To perform AcidoCEST MRI, we acquired 4 pre-injection CEST MR image sets for 12 minutes at 3.5 μT saturation power and 4 s saturation time for signal averaging that improves CNR. We then injected 200 μL of iopamidol i.v. followed by infusion at 400 μL/hour for 18 minutes. During the infusion, we acquired 6 post-injection acidoCEST MR image sets. We then used our standard analysis procedure to measure tumor pHe.
RESULTS
Irradiated tumors that did not show evidence of necrosis based on T2-weighted MRI had a pHe < 7.0 using acidoCEST MRI. For comparison, irradiated tumors that showed evidence of necrosis with T2-weithgted MRI had a pHe > 7.0 using acidoCEST MRI. Similarly, control mice with no evidence for necrosis had pHe < 7.0 while control mice with evidence for necrosis had pHe > 7.0. This result with unirradiated control mice suggests that pHe is directly related to necrosis, and not necessarily directly related to other effects of radiation (e.g., cell swelling without necrosis). Therefore, tumor pHe could be a useful biomarker for other treatments that cause necrosis, including chemotherapy and chemoradiation.Importantly, this study suggests that a pHe threshold of 7.0 pH units can stratify responders vs. non-responders during radiotherapy. More studies are needed to evaluate whether this threshold of pHe 7.0 is common among all GBM models, and patients with GBM. In addition, the irradiated and control mice that showed evidence of necrosis also showed low uptake of the contrast agent. Therefore, the number of pixels that show uptake of the agent can potentially serve as another biomarker of early response during acidoCEST MRI studies.
CONCLUSIONS
This study establishes that tumor pHe is a useful biomarker for evaluating tumor necrosis after radiotherapy, especially as an early response biomarker when tumor volume has not changed.Acknowledgements
Our research is supported by the NIH/NCI through grants R01 CA231513 and P30 CA016672.References
1. Martins AN, Johnston JS, Henry JM, Stoffel TJ, di Chiro G. Delayed radiation necrosis of the brain. J Neurosurg 1977;47:336–345.
2. Verma N, Cowperthwaite MC, Burnett MG, Markey MK. Differentiating tumor recurrence from treatment necrosis: a review of neuro-oncologic imaging strategies. Neuro Oncol. 2013;15(5):515-534.
3. Hanahan D, Weinbert RA. Hallmarks of cancer: the next generation. Cell 2011;144:646-674.
4. Honasoge A, Sontheimer H. Involvement of tumor acidification in brain cancer pathophysiology. Front Physiol 2013;4:316.
5. Chen LQ, Randtke EA, Jones KM, Moon BF, Howison CM, Pagel MD. Evaluations of tumor acidosis within vivo tumor models using parametric maps generated with acidoCEST MRI. Mol Imaging Biol 2015;17(4):488-496.
6. Jones KM, Randtke, EA, Yoshimaru E, Howison CM, Chalasani P, Klein RR, Chambers SK, Kuo PH, Pagel MD. Clinical translation of acidosis measurements with acidoCEST MRI. Molec Biol Imaging 2017;19:617-625.
Figures