2327
Differences in Brain Structural and Metabolic Phenotype in Mouse Models of Down Syndrome and Brain Tumors1Radiology, University of Colorado Anschutz, Aurora, CO, United States, 2Pharmacology, University of Colorado Anschutz, Aurora, CO, United States, 3Biochemistry, Chaminade University of Honolulu, Honolulu, HI, United States, 4Pediatrics, University of Colorado Anschutz, Aurora, CO, United States
Synopsis
Keywords: Tumors, Animals, Down Syndrome
Gliomas are exceedingly rare in Down Syndrome (DS). This study characterizes metabolic biomarkers and structural differences in the brains of mouse DS models and compare them to glioma models. Analysis of the age-dependent differences in the metabolic profile was carried out by 1H-NMR metabolomics and compartmental brain volumes of mouse brains were assessed from T2-weighted MRI. A significant age-dependent neuronal loss in the cortex and hippocampus, with a hyperventricular profile, was observed in DS mice. Highly decreased lactate and amino acid concentrations were observed in DS, in contrast to glioma extracts, indicative of decreased metabolic dependency on glycolysis and proteolysis.INTRODUCTION
There is a surplus of information about abnormal metabolism in brain tumors (including gliomas). The “Warburg Effect” describes a mitochondrial dysfunction in tumors resulting in decreased ATP production and shifting glucose utilization towards “aerobic glycolysis” with increased lactate output, increased amino acid and glucose uptake in the presence of oxygen (1, 2). While it is common knowledge that gliomas have a drastically different metabolism based on this concept, there is nothing known regarding altered brain metabolism in Down Syndrome (DS). However, it is an established notion that solid tumors in DS individuals are exceedingly rare. Therefore, there must be some baseline metabolism which disallows glioma development in DS. Additionally, we must consider possible abnormalities in a DS brain in comparison to the structure and volume of a normal brain. The goal of this study was to establish structural and metabolic phenotype of young and old DS mouse brains using high-resolution MRI and ex-vivo NMR-metabolomics, respectively, in comparison to GBM and normal age-matching brains.METHODS
All animal protocols were reviewed and approved by the University of Colorado IACUC. Twenty-two mice were categorized into 5 different groups based on sex, age, and genotype (DS or wild-type). The Bruker 9.4 Tesla MRI scanner with a mouse head phased-array coil was used to acquire high-resolution T2-turboRARE 3D-MRI scans of mouse brains (3-5). The following MRI volumetric analysis was carried out using the Bruker ParaVision NEO360 v2.2 software: total brain volume in the coronal plane; cortex, hippocampus, olfactory bulb and ventricles in transversal; and cerebellum in sagittal. Following MRI acquisition, the mouse brains were snap-frozen in liquid nitrogen and extracted using an acid extraction procedure developed by our team (6). 1H-NMR spectra of brain extracts were acquired on Bruker 400 MHz Avance spectrometers and 30 hydrophilic brain metabolites were quantified using the 1D WINNMR software. Conventional ANOVA as well as PLS-DA multivariate analysis was applied for biomarker discovery.RESULTS
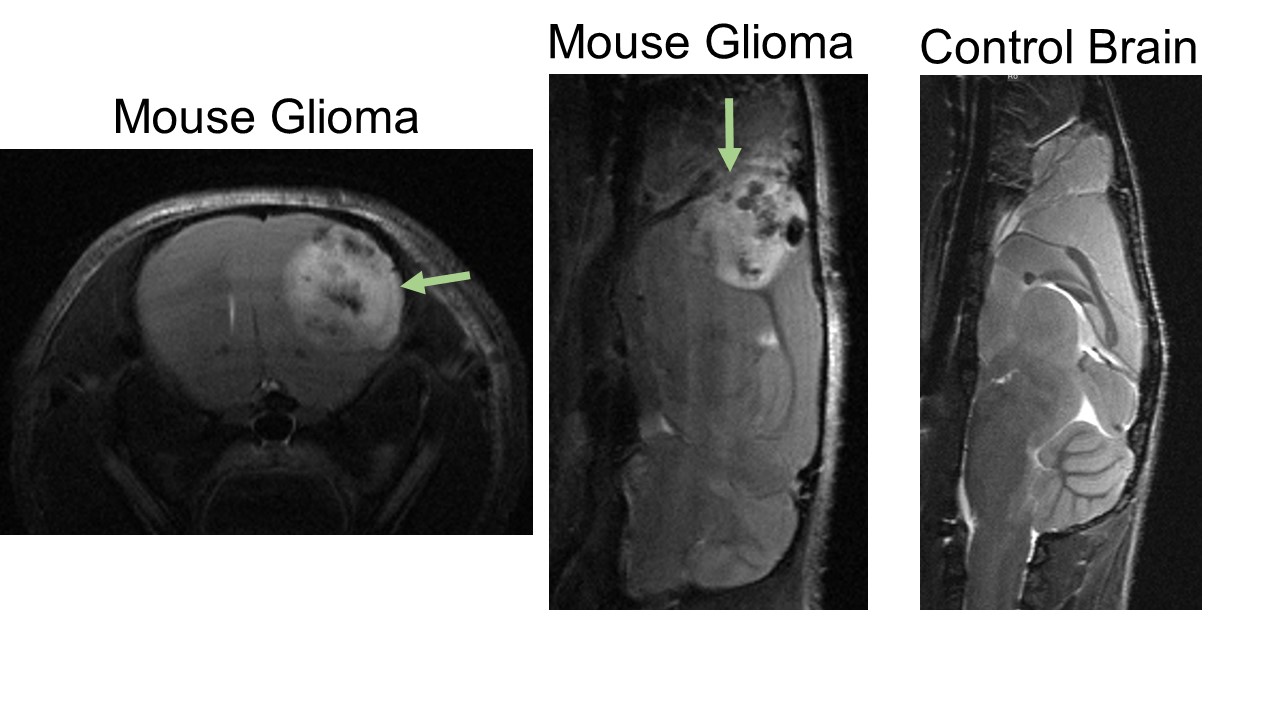
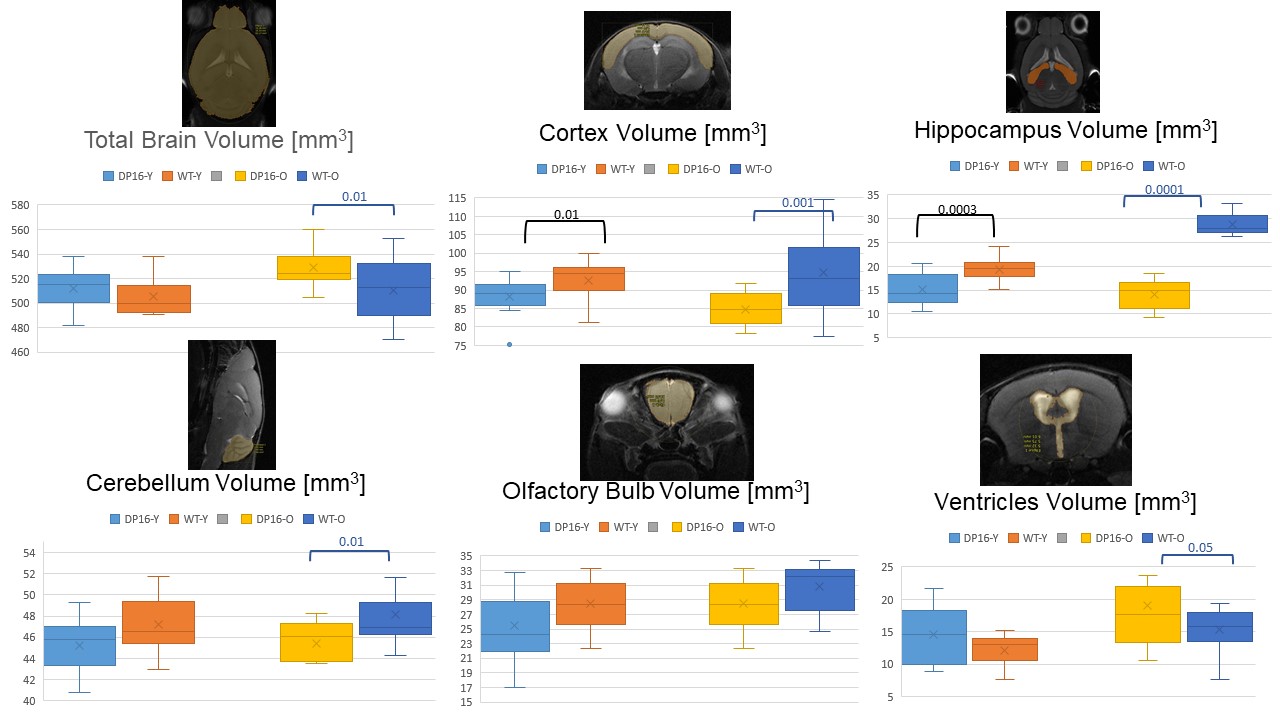
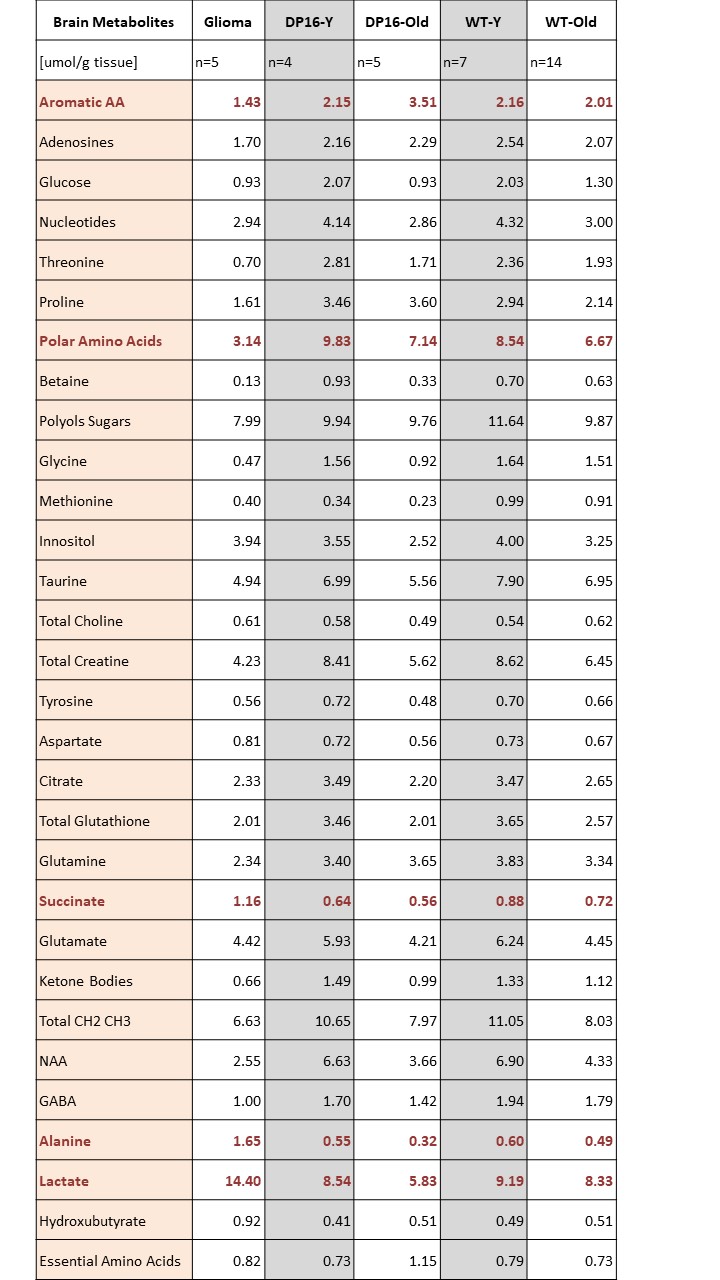
Results: High-resolution turboRARE T2w-MRI was able to detect brain structures and cortical glioma lesions with a 48 microns in-plane resolution (Figure 1). We first compared the brain volumes of the different brain compartments among age-matched (young: 3-month; and old: 20-month old mice) DS and wildtype animals. The only structural difference in the young DS mice was a decreased cortical volume (-18% vs wildtype, p<0.05, Figure 2). However, with the increasing age, the old DS brains reveal a highly decreased hippocampal, cerebellar, and cortical volumes (all p<0.01), with significantly increased ventricles (+27%, p<0.02, Figures 2 and 3). The multivariate PLS-DA analysis on MRI volumetric data set provides a clear group separation between the DS and wildtype brain (Figure 3), with the hippocampal volumes being the strongest discriminator for group clustering. There were no significant metabolic differences in young DS vs wildtype brains (Table 1). The metabolic biomarkers for aged DS brains are related to increased amino acid metabolism and uptake. The most profound difference between brain metabolic phenotype in DS versus glioma was a remarkably low concentration of lactate (-47% DS vs glioma, p<0.001, Table 4).DISCUSSION
With the increasing age, the DS animals reveal a significant loss in neuronal masses, especially in the cortex, hippocampus and cerebellum; while their ventricles progressively increase. Interestingly, our previous studies with glioma (including GBM and DIPG) mouse models also reveal a hyperventricular profile. The most profound finding of this study was highly decreased lactate concentrations in DS brain, as opposed to glioma extracts, indicative of decreased metabolic dependency on glycolysis in DS, a major energy-producing pathway in brain tumors. Future directions will include an assessment of brain compartmental volumes and metabolic phenotypes in male vs female DS mice; as well as further studies on altered amino acid metabolism in DS.CONCLUSION
We successfully developed a comprehensive MRI/MRS protocol for characterizing DS versus glioma brain phenotype. MRI analysis demonstrated a significant loss of neuronal masses in DS animal with the increasing age, especially in the hippocampus and cortex; while their ventricles progressively increase. 1H-NMR spectra revealed highly decreased lactate concentrations in Down Syndrome brains, as opposed to glioma extracts, indicative of decreased metabolic dependency on glycolysis in Down Syndrome animals.Acknowledgements
This study was supported by the University of Colorado CCSG Cancer Center grant NCI P30 CA046934 and by the NIH Shared Instrumentation Grant Program (S10 OD023485, S10OD023491, S10 OD027023) and Michele Plachy-Rubin Pilot Grant. An additional extension of gratitude to the University of Colorado Cancer Center NCI grant 1R25CA240122 and The Cancer League of Colorado for financial support.References
1. Serkova NJ, Spratlin JL, Eckhardt SG. NMR-based metabolomics: translational application and treatment of cancer. Curr Opin Mol Ther. 2007;9: 572-585.
2. Gottschalk S, Anderson N, Hainz C, Eckhardt SG, Serkova NJ. Imatinib (STI571)-mediated changes in glucose metabolism in human leukemia BCR-ABL-positive cells. Clin Cancer Res. 2004;10: 6661-6668.
3. Serkova NJ, Glunde K, Haney CR, et al. Preclinical Applications of Multi-Platform Imaging in Animal Models of Cancer. Cancer Res. 2021;81: 1189-1200.
4. Pierce AM, Witt DA, Donson AM, et al. Establishment of patient-derived orthotopic xenograft model of 1q+ posterior fossa group A ependymoma. Neuro Oncol. 2019;21: 1540-1551.
5. Dahl NA, Danis E, Balakrishnan I, et al. Super Elongation Complex as a Targetable Dependency in Diffuse Midline Glioma. Cell Rep. 2020;31: 107485.
6. Serkova NJ, Glunde K. Metabolomics of cancer. Methods Mol Biol. 2009;520: 273-295.
Figures