2326
Effects of glutamine synthetase on neovascularization in glioma studied by In vivo MR vessel size imaging
tianwei song1, yanan zhang1, chen zhou1, and Junchao Qian1
1Institute of Health and Medical Technology, Hefei Institutes of Physical Science, Hefei Cancer Hospital, Chinese Academy of Sciences, Hefei 230031, P. R. China, Hefei, China
1Institute of Health and Medical Technology, Hefei Institutes of Physical Science, Hefei Cancer Hospital, Chinese Academy of Sciences, Hefei 230031, P. R. China, Hefei, China
Synopsis
Keywords: Tumors, Blood vessels
Glioblastoma (GBM) is a highly invasive and vascularized primary malignant brain tumor. Glutamine synthetase (GS) could induce vessel sprouting through the improvement of endothelial cell migration in inflammatory diseases. MR vessel size imaging was supposed to visualize angiogenesis potentially in the brain. In the study we research the role of GS on neovascularization in glioma by in vivo vessel size imaging. Our results indicate that the vascular changes mainly occur in the tumor center and significant decreases of microvascular density values in the MSO group compared to the control. GS inhibitor could be a potential drug to treat glioma.INTRODUCTION
Glioblastoma (GBM) is the most common primary malignant brain tumor, which is highly vascularized1. Recent studies showed that glutamine synthetase (GS) could induce vessel sprouting through the improvement of endothelial cell migration in inflammatory diseases2. MR vessel size imaging was supposed to visualize angiogenesis potentially in the brain3-5. Thus, we explored the possibility to study the role of GS on neovascularization in glioma utilizing in vivo MR vessel size imaging in this study.MATERIALS and METHODS
Eight Sprague-Dawley rats (weighing 250–300 g) were used in this study. Glioma model were established according to previous studies6. All rats were randomly divided into two groups: control (treated with saline) and GS inhibitor (L-methionine sulfoximine, MSO) treatment. MSO (20 mg/kg; M-5379; Sigma, St. Louis, MO) was injected intraperitoneally every day for 3 times starting 10 days after implantation of rat glioma C6 cells. MR experiments were carried out on the BRUKER 7 T/200 mm scanner. Prior to MR studies, all rats were anesthetized with a mixture of isoflurane (3.5% induction, 1.0%-1.5% maintenance), 30% oxygen and air using an anesthesia machine for small animals. Two time points were selected: prior to treatment (D0) and 4 days after treatment (D4). T2* weighted (T2*WI) images and T2 weighted (T2WI) images were acquired using 2D gradient-echo (GE) sequence [repetition time (TR) = 800 ms; echo time (TE) = 3.5 ms: flip angle = 50] and the spin-echo (SE) sequence (TR = 4500 ms; TE = 35 ms), respectively. The other parameters were as follows: FOV = 25 mm × 25 mm; matrix size = 256 × 256, 24 slices with slice thickness of 1 mm; 2 averages. Diffusions images were obtained with a multi-shot spin-echo echo-planar imaging (EPI) sequence. The parameters were as follows: TE = 25 ms; TR = 3000 ms; FOV = 25 mm × 25 mm; matrix size = 128 × 128, number of averages = 2; 24 slices with slice thickness of 1 mm. The map of apparent diffusion coefficient (ADC) was obtained from a 30-directional diffusion-weighted spin-echo images with b = 800 s/mm2 and a reference image (b ≈ 0 s/mm2). Before and 5 minutes after the injection of USPIO (0.02 ml/kg) through the tail vein over approximately 5 min, the transverse relaxation changes of △R2and △R2*were acquired by repeated SE and GE sequence scans. MR Vessel size images were calculated as described previously 4,5. To quantify vascular morphological changes, MR data were analyzed with ImageJ software. Statistical comparisons were performed between the control and MSO treatment groups by two-tailed Student’s unpaired t tests.RESULTS
Fig.1 shows that the vascular morphology changed mainly in the tumor center. Significant decreases of 68% in quantitative microvascular density in tumor center (p < 0.05) 4 days after MSO treatment were observed compared to the levels in corresponding normal sites. Significant growth inhibition of tumor was also observed in MSO treatment group compared to the control.DISCUSSION
The decreases of microvascular density were observed in the tumor center after MSO treatment in current study, suggestive of angiogenesis suppression in tumor site, which might be due to the inhibition effects of endothelial cell migration of MSO2. In addition, tumor growth was also impeded possibly because of decreased blood supply after GS inhibitor treatment.CONCLUSION
GS inhibitor could be a potential drug to treat glioma and MR vessel size imaging might be a useful way to detect neovascularization in glioma.Acknowledgements
No acknowledgements foundReferences
1. Quinn T Ostrom, et al.Neuro-Oncology.2021;23(12 Suppl 2):iii1-iii105; 2. Guy Eelen, et al. Nature.2018;561(7721):63-69; 3. Lelacqua GD, et al. Front. Aging Neurosci. 2016;7:241; 4. Lemasson B, et al. Magnetic Resonance in Medicine. 2013;69:18–26; 5. Xu X, et al. Aging (Albany NY). 2020;12(17):17224-17234; 6. Bo Li, et al. Journal of Magnetic Resonance Imaging. 2021;56(2):427-439.Figures
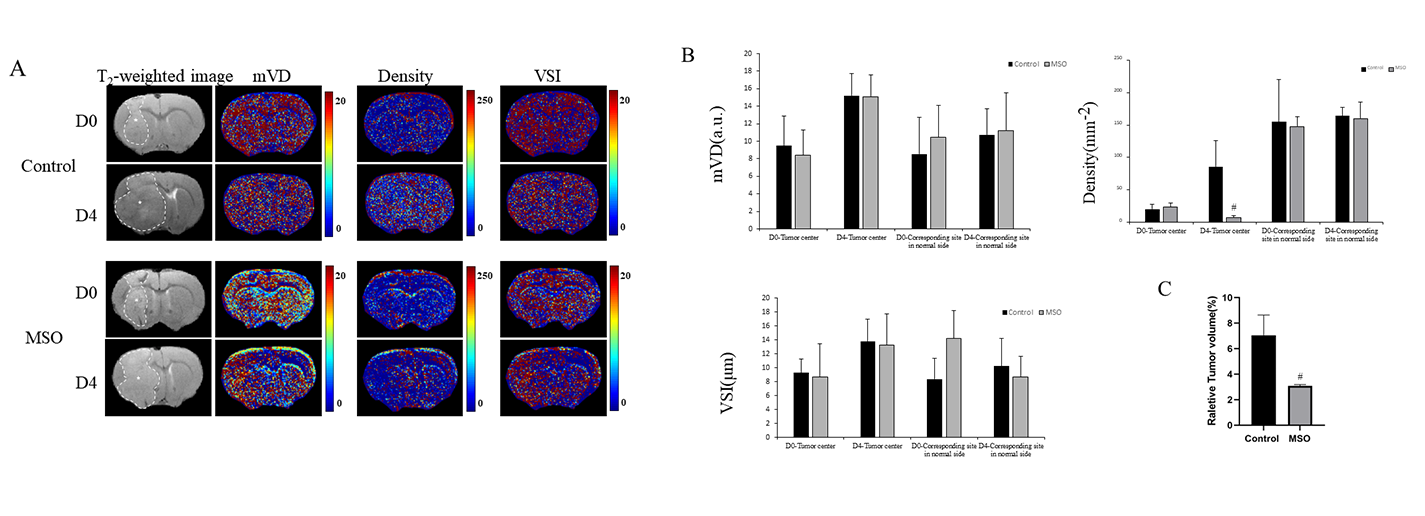
Fig 1. Representative MR vessel size images (A) of rat brain glioma with or without MSO treatment prior to (D0) and 4 days after treatment (D4), (B) quantitation of microvascular density (Density), mean vessel diameter (mVD), and vessel size index (VSI) in ROIs in tumor center and corresponding normal site. (C) Relative tumor volumes after treatment compared to pre-treatment levels. ROIs outlined with dashed lines on T2 images for tumor volume measurement. “*” indicate tumor center. “#” indicates significance at P=0.05.
DOI: https://doi.org/10.58530/2023/2326