2325
Benefit of Vessel Size/Architecture Imaging with DSC-MRI for Differentiation of Tumor Recurrence versus Pseudoprogression in Glioma Patients
Jian Ming Teo1,2, Jason M Johnson3, Halyna Pokhylevych3, Kinsey Lano3, Ping Hou1, Xinzeng Wang4, and Ho-Ling Liu1
1Department of Imaging Physics, The University of Texas MD Anderson Cancer Center, Houston, TX, United States, 2The University of Texas MD Anderson Cancer Center UTHealth Graduate School of Biomedical Sciences, Houston, TX, United States, 3Department of Neuroradiology, The University of Texas MD Anderson Cancer Center, Houston, TX, United States, 4GE Healthcare, Houston, TX, United States
1Department of Imaging Physics, The University of Texas MD Anderson Cancer Center, Houston, TX, United States, 2The University of Texas MD Anderson Cancer Center UTHealth Graduate School of Biomedical Sciences, Houston, TX, United States, 3Department of Neuroradiology, The University of Texas MD Anderson Cancer Center, Houston, TX, United States, 4GE Healthcare, Houston, TX, United States
Synopsis
Keywords: Tumors, DSC & DCE Perfusion, Gliomas
Vessel Size Imaging was performed on twenty-five glioma patients to obtain voxel-wise relative vessel size index and peak shift maps. This study aimed to investigate if relative vessel size index and difference in peak shift between lesion vs normal appearing white matter voxels will assist in differentiating pseudoprogression vs tumor recurrence for post-treatment gliomas. It was shown that AUC and accuracy increases when incorporating rVSI and difference in peak shift.Introduction
Gradient-echo (GE) and spin-echo (SE) dynamic susceptibility contrast (DSC) MRI can be used to perform vessel size/architecture imaging (VAI) for quantitative evaluation of microvasculature in brain lesions1-3. These quantities include relative vessel size index (rVSI), which represents mean vessel caliber of a voxel, and peak shift between the delta R2 and delta R2* time curves (dPk), which represents dominance of vessel types in a voxel. This study aimed to investigate the benefit in diagnostic performance added by rVSI and dPk in differentiating tumor recurrence vs. pseudoprogression for post-treatment gliomas.Methods
Twenty-three glioma patients (12 males and 11 Females, mean age 57 ± 11 y; age range 33-74 y) with post-treatment contrast-enhancing lesions on T1-weighted MRI underwent simultaneous GE (TE*=25ms) and SE (TE=80ms) DSC MRI on a 3T scanner. Leakage-corrected rCBV maps were derived from both GE (delta_R2*) and SE (delta_R2) DSC time curves. Voxel-wise rVSI and dPk maps were calculated using the delta_R2 and delta_R2* time curves, ADC map and rCBV maps for each patient. ROIs of enhancing lesions and contralateral normal appearing white matter (NAWM) were delineated on post-contrast T1 images by an experienced neuroradiologist. Mean values of GE rCBV, SE rCBV, rVSI and dPk within the ROIs were then obtained. Normalized CBV (nCBV) was obtained by taking the ratio of the mean rCBVs of the Lesion/NAWM. Difference in dPk was calculated by mean dPks of Lesion – NAWM.Results
Figure 1 lists the mean and standard deviation for parameters GE nCBV, SE nCBV, rVSI and dPk difference. P-values were determined with a two-sided independent samples t-test assuming unequal variances. Significant difference was found for tumor recurrence vs. pseudoprogression GE nCBV (P-value < 0.01) and SE nCBV (P-value < 0.05).Figure 2 lists the area under the ROC curve (AUC) and diagnostic performance of individual parameters, namely GE nCBV, SE nCBV, rVSI and dPk difference, as well as those of parameters combined with multivariate logistic regression analysis. GE nCBV outperformed the other three parameters with an AUC of 0.763 and accuracy of 0.715. Adding SE nCBV to GE nCBV did not improve the performance. Rather, the performance was improved upon when using the combination of GE nCBV + rVSI + dPk difference which had an AUC of 0.816 and accuracy of 0.743. Slightly higher AUC (0.829) was obtained when using GE nCBV + SE nCBV + rVSI + dPk difference with the same accuracy. Figure 3 presents the ROC curves for the parameters GE nCBV, SE nCBV, rVSI and dPk difference, GE nCBV + rVSI + dPk difference and GE nCBV + SE nCBV + rVSI + dPk difference.Discussion
Previous work had demonstrated the utility of rVSI and VAI (dPk) in improving differentiation of early tumor progression and pseudoprogression3. This was accomplished with the use of a subjective scoring metric termed “Arterial Dominance Score”. This work demonstrates an improvement to diagnostic performance can be achieved using quantitative parametric maps via combining GE nCBV with rVSI and dPk difference. Additionally, SE nCBV was also evaluated to have little added value by itself but appears to demonstrate the potential to improve diagnostic performance in combination with GE nCBV, rVSI and dPk difference.Conclusion
In a small cohort of glioma patients, we demonstrated that rVSI and dPk can provide an improvement in diagnostic performance for the determination of tumor recurrence vs pseudoprogression for post-treatment gliomas. This approach will be incorporated in future investigations involving a larger patient cohort.Acknowledgements
No acknowledgement found.References
- Kiselev VG, Strecker R, Ziyeh S, Speck O, Hennig J. Vessel size imaging in humans. Magn Reson Med 2005;53(3):553-563.
- Emblem KE, Mouridsen K, Bjornerud A, Farrar CT, Jennings D, Borra RJ, Wen PY, Ivy P, Batchelor TT, Rosen BR, Jain RK, Sorensen AG. Vessel architectural imaging identifies cancer patient responders to anti-angiogenic therapy. Nat Med 2013;19(9):1178-1183.
- Kim M, Park JE, Emblem K, Bjornerud A, Kim HS. Vessel Type Determined by Vessel Architectural Imaging Improves Differentiation between Early Tumor Progression and Pseudoprogression in Glioblastoma. AJNR Am J Neuroradiol 2021;42(4):663-670.
Figures

Figure 1. Table
of mean and standard deviation for parameters GE nCBV, SE nCBV, rVSI and dPk
difference in the samples of tumor recurrence and pseudoprogression. P-values
were determined with a two-sided independent samples t-test assuming unequal
variances. Significant differences were found for tumor recurrence vs. pseudoprogression
GE nCBV (P-value < 0.01) and SE nCBV (P-value < 0.05).
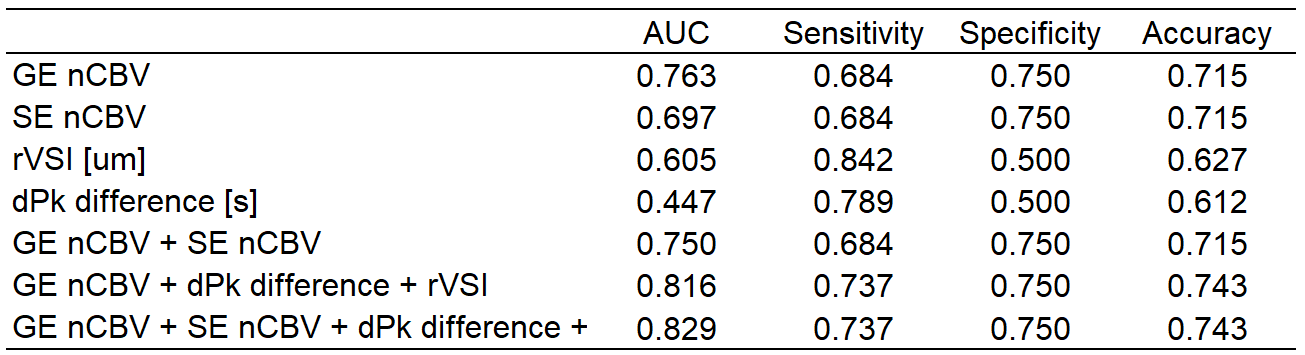
Figure 2. Table
of diagnostic performance for the different parameters. GE nCBV has an AUC of
0.763 and accuracy of 0.715. Incorporating dPk difference and rVSI increases AUC
to 0.816 and accuracy to 0.743. Additionally, incorporating SE nCBV would
increase AUC to 0.829. ROC curves are in Figure 3.
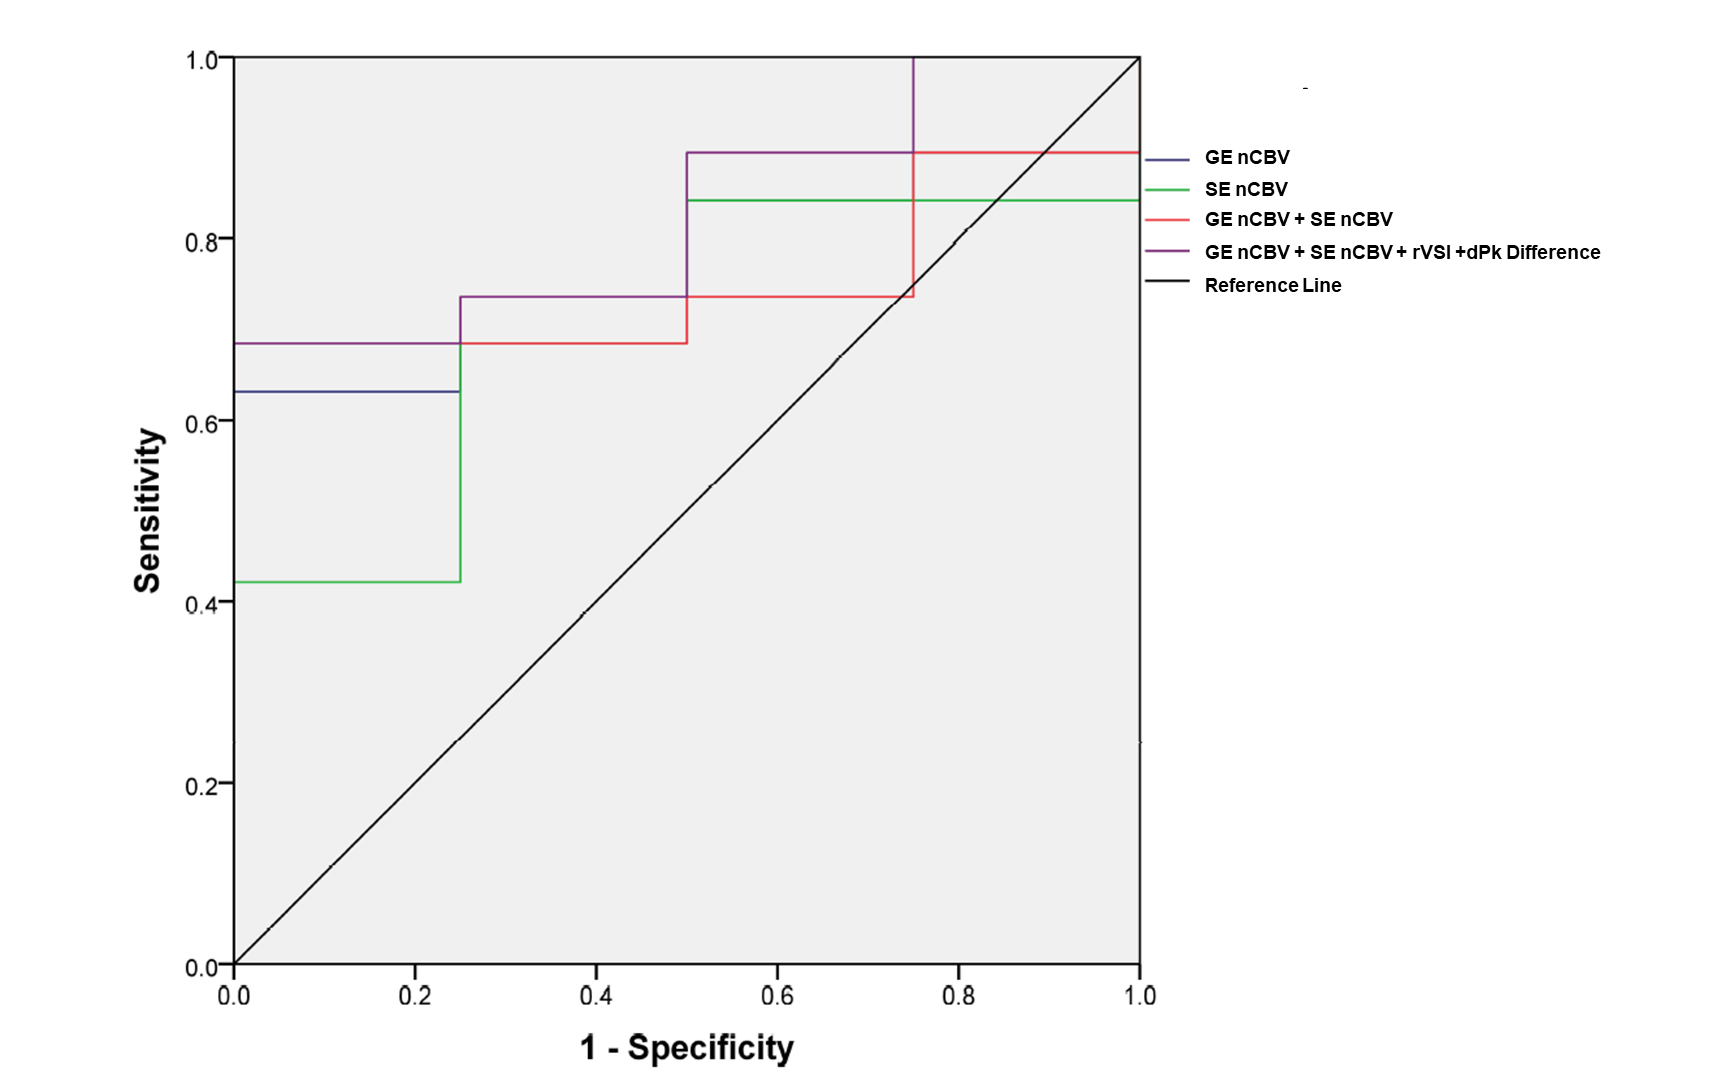
Figure
3. ROC for different parameters. ROC of GE nCBV (blue, AUC 0.763), SE nCBV
(green, AUC 0.697), GE nCBV + SE nCBV(red, AUC 0.750), GE nCBV + SE nCBV + rVSI
+ dPk difference (purple, AUC 0.829)
DOI: https://doi.org/10.58530/2023/2325