2321
Quantitative Sodium Imaging Report for Monitoring Brain Tumor Lesion Progress1BWH, Boston, MA, United States
Synopsis
Keywords: Tumors, Quantitative Imaging, Sodium Imaging
▶︎ MR has been commonly used for the brain tumor patient monitoring. However, most of the MR images does not provide quantitative physiologic information, which can be ambiguous with longitudinal monitoring.
▶︎ Sodium MR imaging can quantitatively provide tumor cell viability information.
▶︎ This presentation introduces a brain tumor patient’s longitudinal quantitative sodium imaging report.
▶︎ Potentially, this quantitative report can be attributed to the tumor patient’s treatment plan.
MR has been commonly used for brain tumor patient monitoring. However, most of the MR images do not provide quantitative physiologic information, which can be ambiguous with longitudinal monitoring [1]. In contrast, sodium MR imaging can quantitatively provide tumor cell viability information [2,3]. This presentation introduces a brain tumor patient’s longitudinal digital sodium imaging report. Potentially, this digital report can be attributed to the tumor patient’s treatment plan.
Materials and Methods
▶︎ Sodium images were acquired on a Magnetom Terra 7T MR system (Siemens Healthcare, Erlangen, Germany) using a dual-tuned (1H/23Na) head coil and 3D ultrashort echo time sequence (TR/TE: 12.8 / 0.27 ms, FA: 19, FOV: 240x240x240mm). The scan time for a 2mm resolution sodium image was 9.5 min for the array coil image and 2 min for the volume coil image for uniformity correction [4].
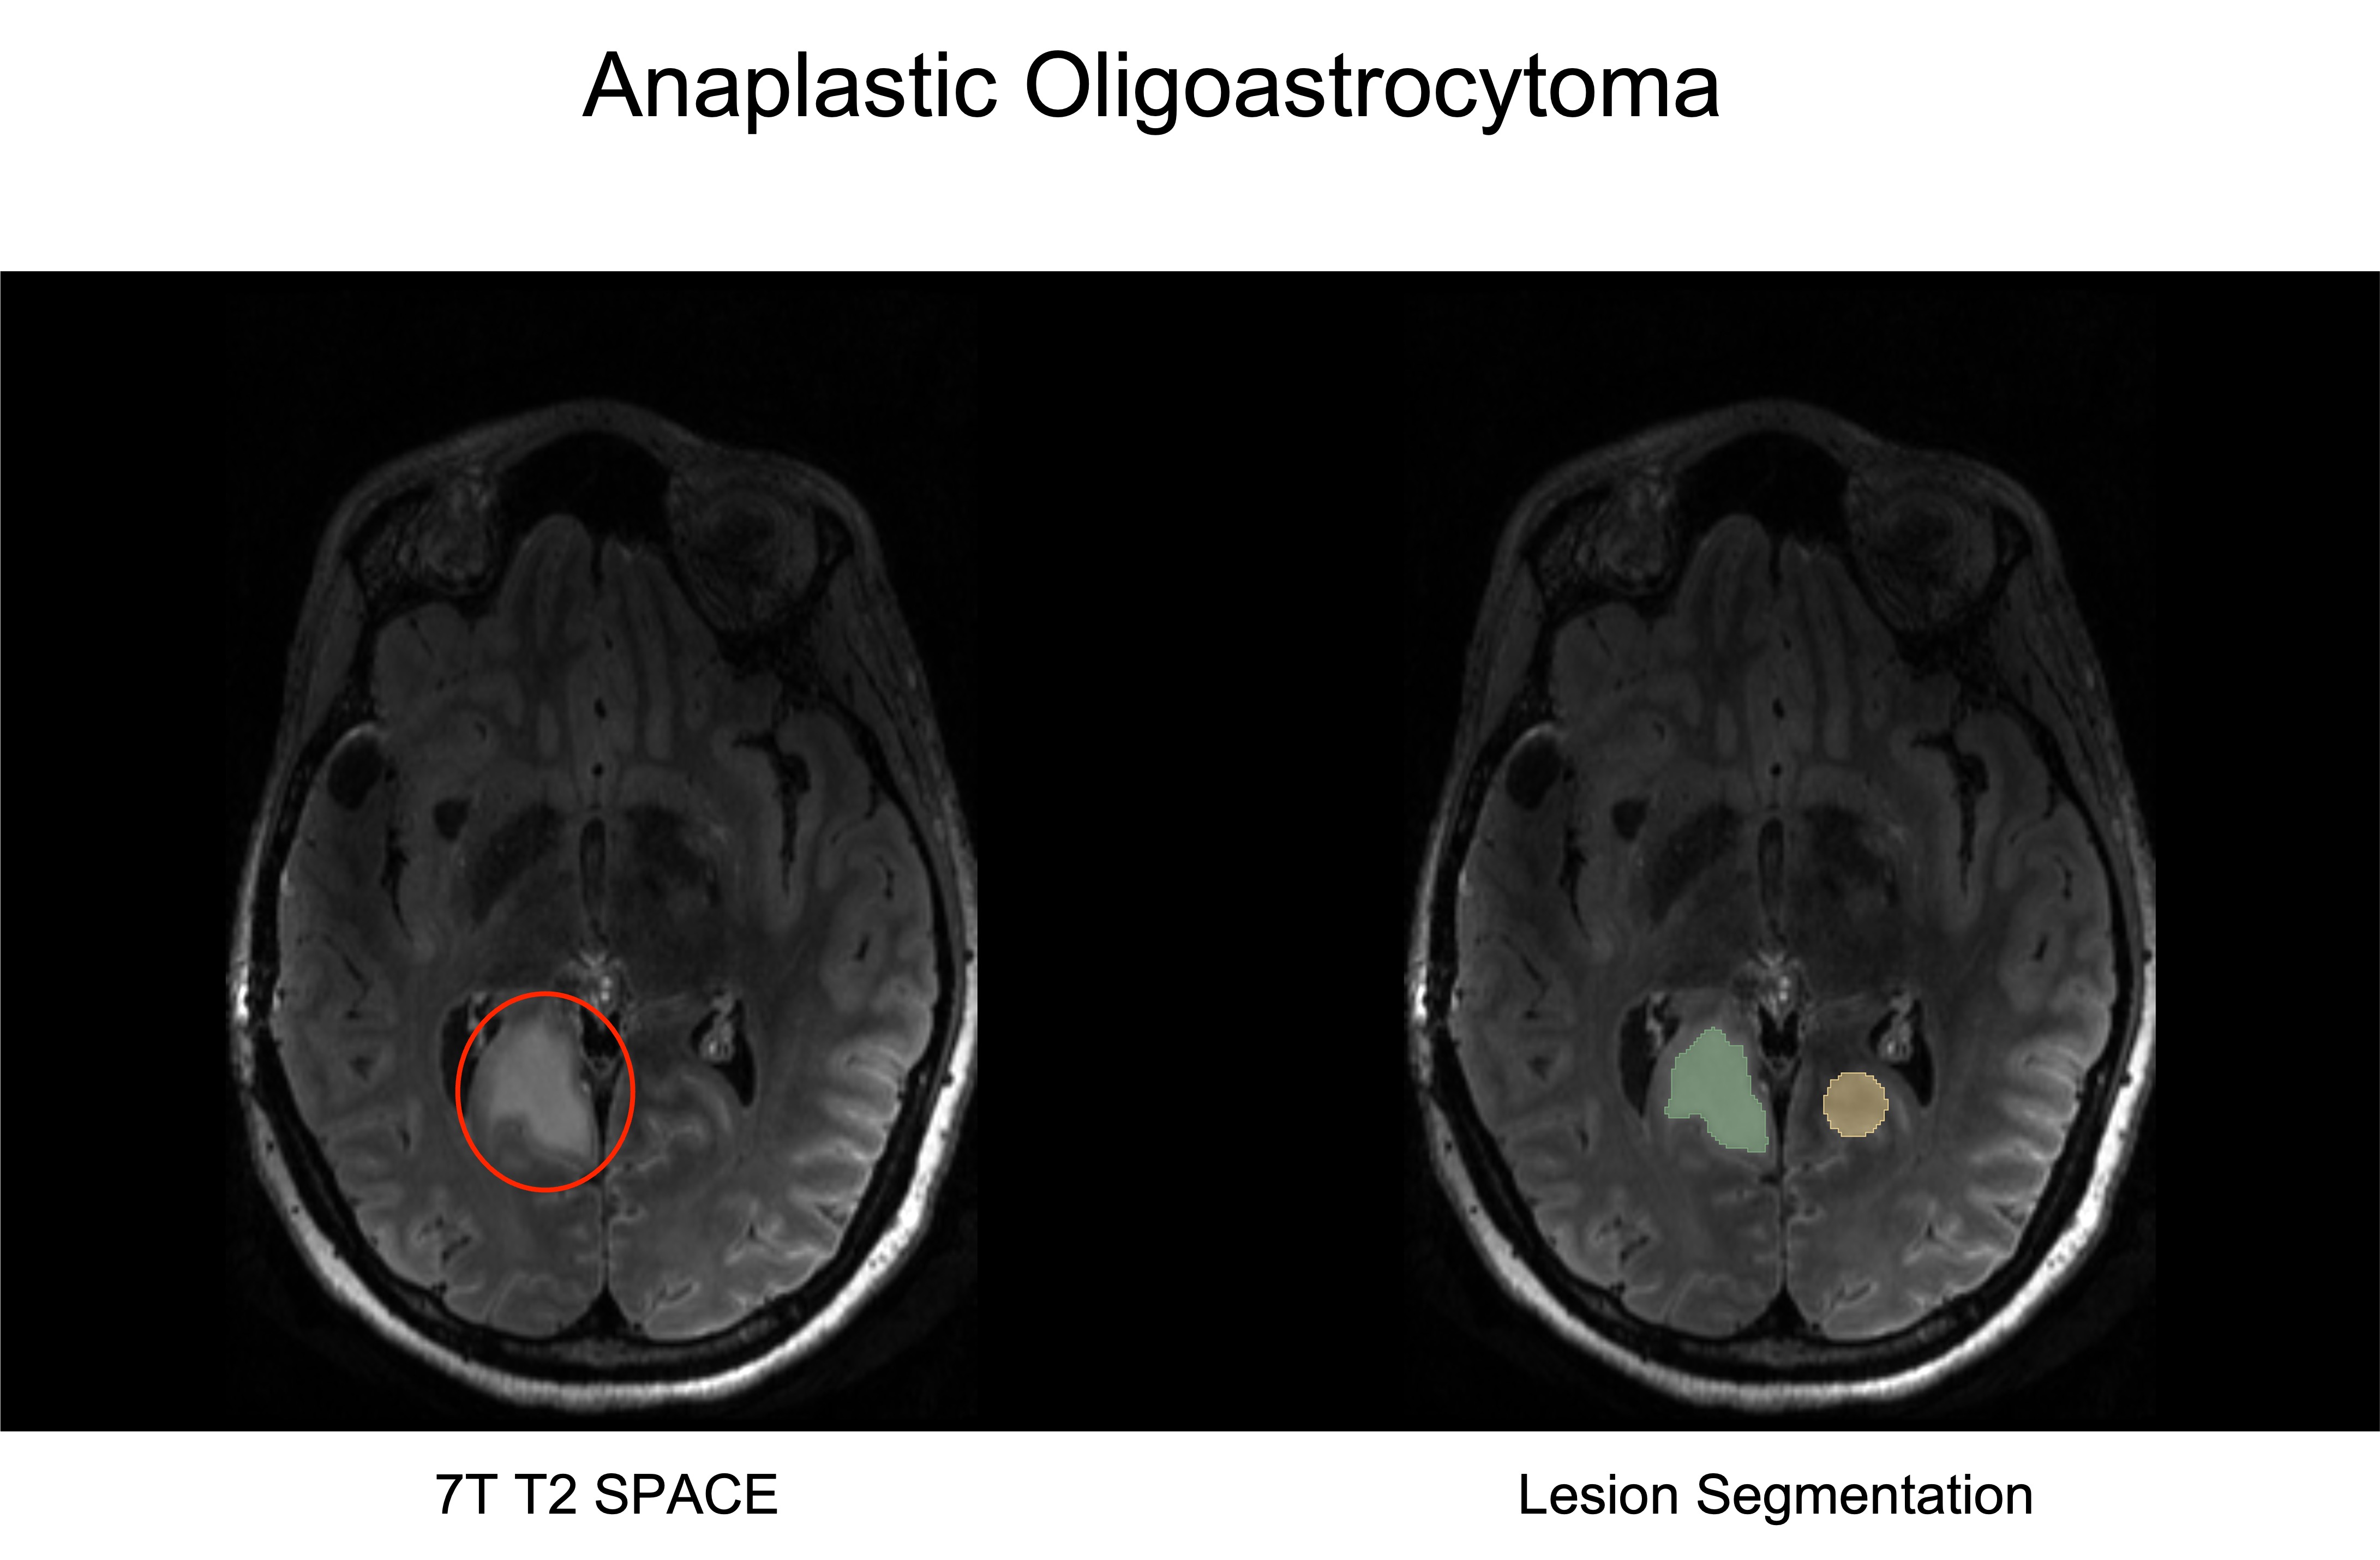
▶︎ To obtain the anatomy information for the tumor lesion, T2 SPACE images were acquired using the Nova 7T 32ch receive coil (Nova Medical, Inc) with the following parameters: TI/TR/TE: 2.5 s / 9 ms / 0.3 ms, 0.7 mm iso-cubic voxel resolution. Tumor segmentation and sodium images were co-registered with T2 SPACE image using 3D Slicer.
▶︎ Tumor lesion and contralateral control sodium concentration ratios were calculated using the right eyeball as a reference value.
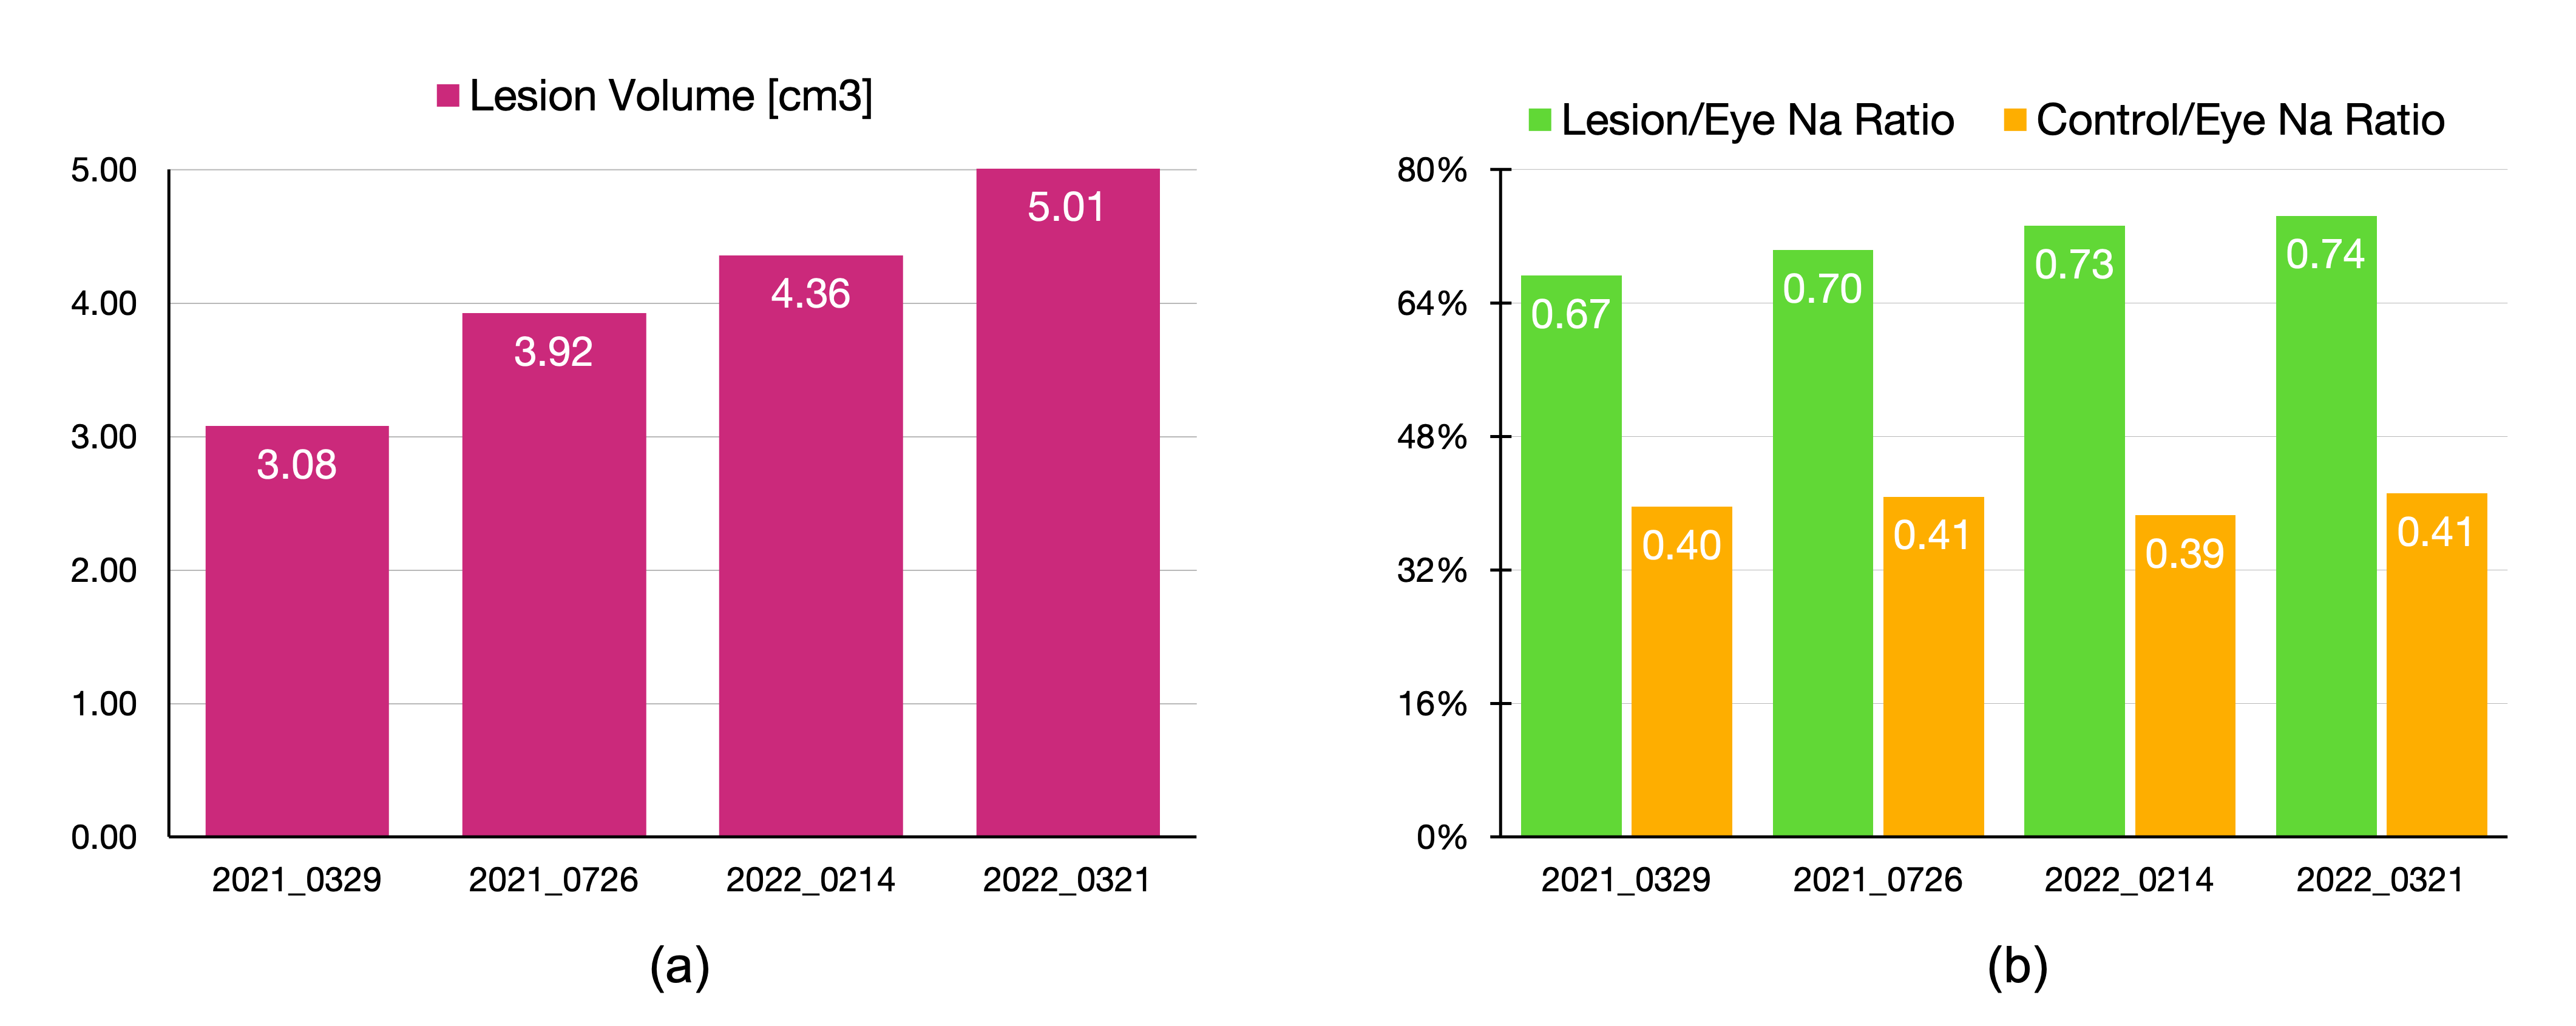
▶︎ A sodium report was then created with the anatomic and sodium images overlayed with the segmented region of interest and control region. ROI volume and sodium concentration value for both the lesion and control are then displayed for each time point as a bar graph.
Results
A 33yo female with an anaplastic oligoastrocytoma underwent four sodium scans during the one-year monitoring period (baseline, 3m, 6m, 11m, 12m) for suspected recurrence. Tumor lesion showed hyper-intensity on T2 contrast image (Figure 1). The tumor lesion volume increased from 3.08 to 5.01 cm3 and the sodium concentration ratio showed a gradually increasing trend from 0.67 to 0.74 while the control ratio remained at ~0.40 for all time points (Figure 2). Due to the increase in tumor size supported by the increased sodium concentration ratio, a decision was made for the patient to undergo resection surgery.
Conclusion
The quantitative sodium report provides essential cellular viability information for longitudinal assessment of tumor changes and can be used to support patient management and treatment/surgical planning.
Acknowledgements
Training in Image Guidance, Precision Diagnosis and Therapy” NIH T32 Fellowship (T32 EB025823) in the Department of Radiology at Brigham and Women’s Hospital.References
1. Current Clinical Brain Tumor Imaging. Villanueva-Meyer JE, Mabray MC, Cha S. Neurosurgery 2017 Sep 1;81(3):397-415. doi: 10.1093/neuros/nyx103.
2. Residual tumor volume, cell volume fraction and tumor cell kill during fractionated chemoradiation therapy of human glioblastoma using quantitative sodium MR imaging. Thulborn KR, Lu A, Atkinson IC, et al. Clin Cancer Res 2018;25:clincanres.2079.2018.
3. Tissue sodium concentration in human brain tumors as measured with 23Na MR imaging. Ouwerkerk R, Bleich KB, Gillen JS, Pomper MG, Bottomley PA. Radiology 2003;227:529–37.
4. A uniformity correction method to reduce scan time for 7T sodium imaging of brain tumors. Kim SH, Merugumala S, Lin A, J Neuroimaging. 2022; 1– 8. https://doi.org/10.1111/jon.13041
Figures