2320
DCE-MRI in Distinguishing Solitary Brain Metastasis from Glioblastoma: Evaluation of Multiple Pharmacokinetic Models1Radiology, Qilu Hospital of Shandong University, Jinan, China, 2GE Healthcare, Beijing, China
Synopsis
Keywords: Tumors, DSC & DCE Perfusion
This study aimed to explore performances of parameters derived from DCE-MRI with multiple pharmacokinetic models regarding this differential diagnosis, as well as overall performances of models. Eighty-eight patients with suspected GBM and SBM underwent DCE-MRI in this study. Peritumoral vp from shutter-speed model achieved the best single-parameter’s performance. Additionally, shutter-speed model achieved the highest overall separating performance. Shutter-speed is the recommended DCE-MRI pharmacokinetic model for differential diagnosis between GBM and SBM.
Introduction
Differential diagnosis between glioblastoma (GBM) and solitary brain metastasis (SBM) has been a long-standing neuroradiological challenge in clinical practice1. Since neurosurgical intervention planning and prognosis are quite different between the two entities, it is always preferable to distinguish GBM from SBM before resorting to neurosurgical intervention2.Dynamic contrast-enhanced MRI (DCE-MRI) has been used for the differential diagnosis between GBM and SBM3. We aimed to explore performances of parameters derived from DCE-MRI with multiple pharmacokinetic models regarding this differential diagnosis, as well as the overall performances of models.
Materials and methods
SubjectsFrom August 2018 to July 2021, eighty-eight patients (mean age: 57.4±13.4 years, male/female: 50/38) with suspected GBM and SBM underwent DCE-MRI in this observational study. The diagnosis of GBM and SBM was based on the 2021 World Health Organization Classification of Tumors of the Central Nervous System. Written informed consent was obtained from each patient. All the experiments were performed in accordance with the ethical standards established in the 1964 Declaration of Helsinki and its later amendments.
MRI Imaging
All the patients were scanned with 3.0-T MR scanner (GE Medical Systems, DISCOVERY MR750W), in a supine position, using a transmit/receive quadrature 20-channel head-and-neck coil, and the imaging protocol was the same for all patients. The detailed protocols of T1 Mapping and DCE-MRI are displayed in Table 1. The contrast agent, 0.1 mmol (Gd-DTPA) per kg body weight, was administered in 7 seconds, followed by a 15-mL saline flush with an injection velocity of 2.0 mL/s.
Data analysis
Five pharmacokinetic models were used to generate 13 types of DCE-MRI parametric maps. The contrast agent extravasation rate constant (Ktrans) and fractional volume of the extravascular extracellular space (ve) from the Tofts model; Ktrans, ve and vascular plasma space (vp) from the extended Tofts model; Ktrans and vp from the Patlak model; Ktrans, vp, ve from the two-compartment exchange model (2CXM). Ktrans, vp and ve from the shutter speed model. We firstly explored their true consistency across models. The differences in these parameters in the peritumoral region and in enhanced GBM and SBM tumors were computed separately. Second, the differences and distinguishing performance of all types of DCE-MRI parametric maps from different pharmacokinetic models between GBM and SBM was analyzed, within both enhanced tumor and peritumoral region. Last, the overall performance of each model containing its statistically different parameters was explored.
Statistical analysis
The intraclass correlation coefficient (ICC) was used to analyze the consistency of one parameter from different pharmacokinetic models. The area under the receiving operating curve (AUC) was used to test the distinguishing performance of each parameter. Machine learning models with 5-fold cross-validation were trained to explore the overall performance of each pharmacokinetic model. A two-sided p value <0.05 was considered to indicate a statistically significant difference. Statistical analysis was performed using MATLAB software (version 2021a, Mathwork, Inc., Natick, MA, USA).
Results
Our results show that the consistency of Ktrans, ve and vp was poor in both GBM (peritumoral: ICC=0.06-0.3; tumoral: ICC=0.2-0.4) and SBM (peritumoral: ICC=0.1-0.74; tumoral: ICC=0.38-0.51). ve in the peritumoral region of GBM showed poor consistency (ICC, 0.06 [-0.01, 0.17]). Ktrans in the peritumoral region of BM had the best consistency (ICC, 0.74 [0.63, 0.83]). The illustrative example of Ktrans across various models in GBM is shown in Figure 1.Peritumoral vascular plasma space (vp) from extended Tofts, Patlak, shutter-speed (p=0.001-0.003) and peritumoral fractional volume of the extravascular extracellular space (ve) from Tofts, extended Tofts, 2CXM (p=0.001-0.029) were found to be statistically different between the two groups, among which peritumoral vp from shutter-speed model achieved the best single parameter’s performance {AUC=0.76 (95%CI: 0.64-0.88), specificity=0.76, sensitivity=0.74}. The detailed results are summarized in Table 2. The shutter-speed model achieved the highest overall separating performance {AUC=0.85 (95%CI: 0.74-0.92), sensitivity=0.88, specificity=0.65}. The detailed results are shown in Table 3.
Discussion and Conclusions
In this study, we comprehensively compared the performance of different pharmacokinetic models of DCE-MRI regarding the differential diagnosis between GBM and SBM. Our results first demonstrated that the shutter-speed model achieved the highest single and overall performance for differential diagnosis.Peritumoral pb from shutter-speed might be the best DCE-MRI parameter and shutter-speed be the recommended DCE-MRI pharmacokinetic model for differential diagnosis between GBM and SBM.
Acknowledgements
No acknowledgement found.References
1. Barajas RF, Cha S. Metastasis in Adult Brain Tumors. Neuroimaging Clin N Am. 2016;26(4):601-620. doi:10.1016/j.nic.2016.06.008.
2. Jiang R, Du FZ, He C, Gu M, Ke ZW, Li JH. The Value of Diffusion Tensor Imaging in Differentiating High-Grade Gliomas from Brain Metastases: A Systematic Review and Meta-Analysis. Jung RE, ed. PLoS ONE. 2014;9(11):e112550. doi:10.1371/journal.pone.0112550.
3. Jung BC, Arevalo-Perez J, Lyo JK, et al. Comparison of Glioblastomas and Brain Metastases using Dynamic Contrast-Enhanced Perfusion MRI: Comparison of Glioblastomas and Brain. J Neuroimaging. 2016;26(2):240-246. doi:10.1111/jon.12281.
Figures
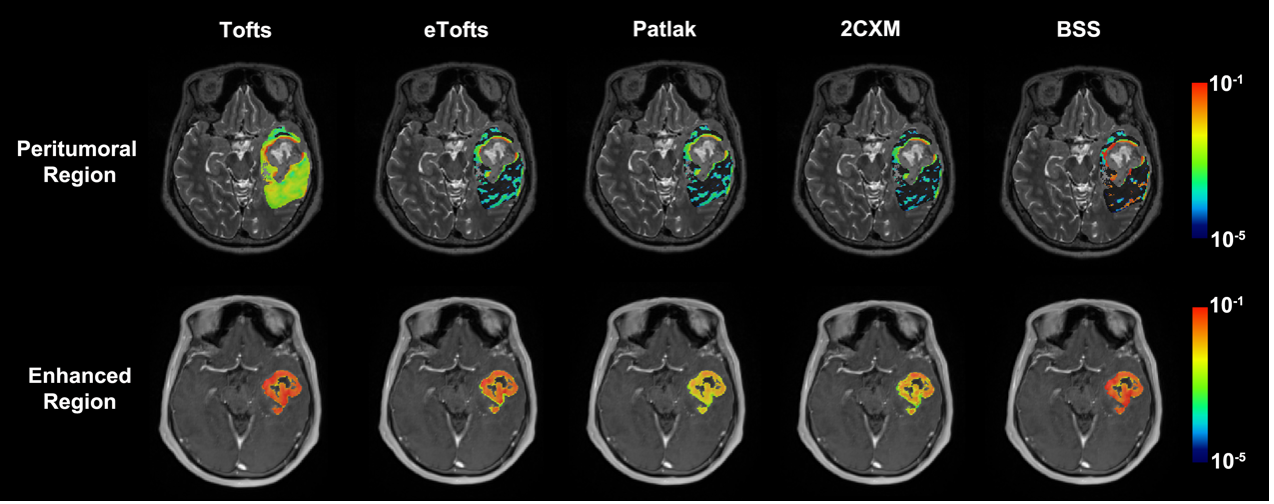
Figure 1. The illustrative example of Ktrans across various models in GBM.
The mean Ktrans values derived from the Tofts, eTofts, Patlak, 2CXM and SS models in the peritumoral region were 3.4×10⁻³, 7.8×10⁻⁴, 7.2×10⁻⁴, 6.6×10⁻⁴ and 1.2×10⁻³, respectively, and the coefficient of variation was 86.1%. Those in the enhanced region were 0.09, 0.05, 0.01, 0.03 and 0.07, respectively, and the coefficient of variation was 63.3%.
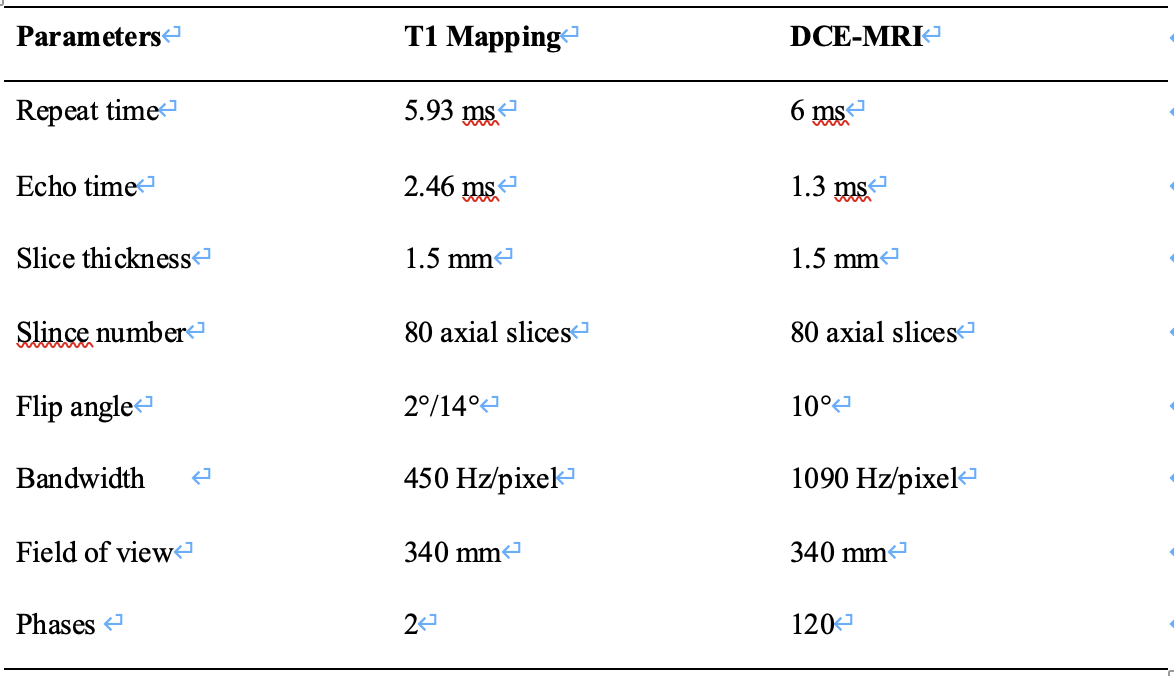
Table 1. Detailed parameters of T1 Mapping and DCE-MRI.
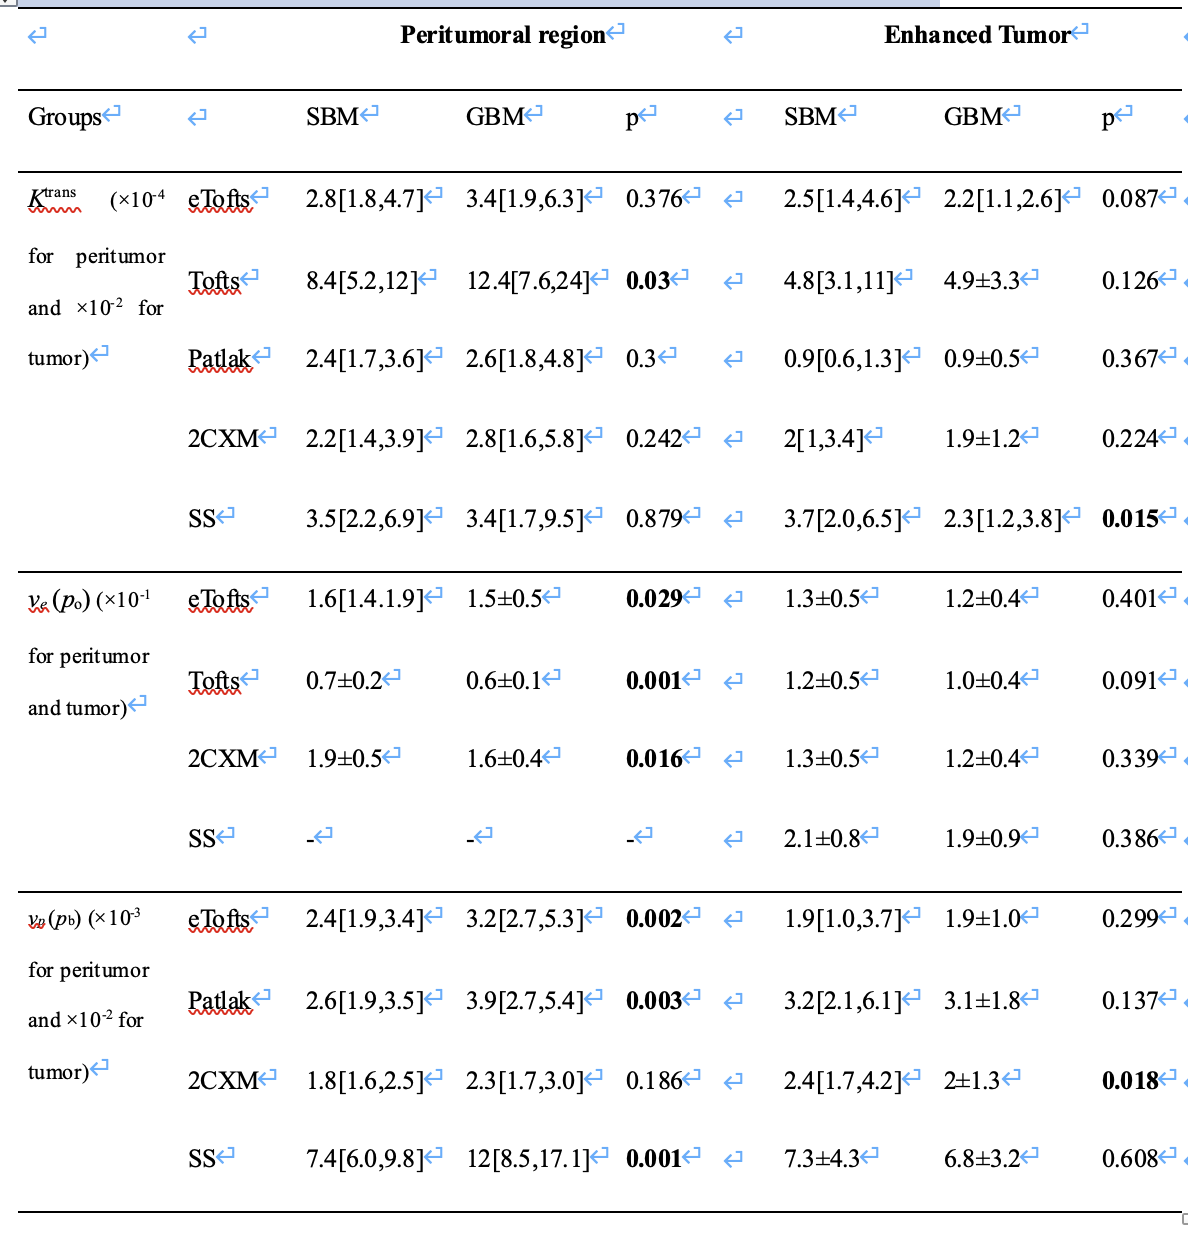
Table 2. The summarized results of the comparison of parameters between groups.
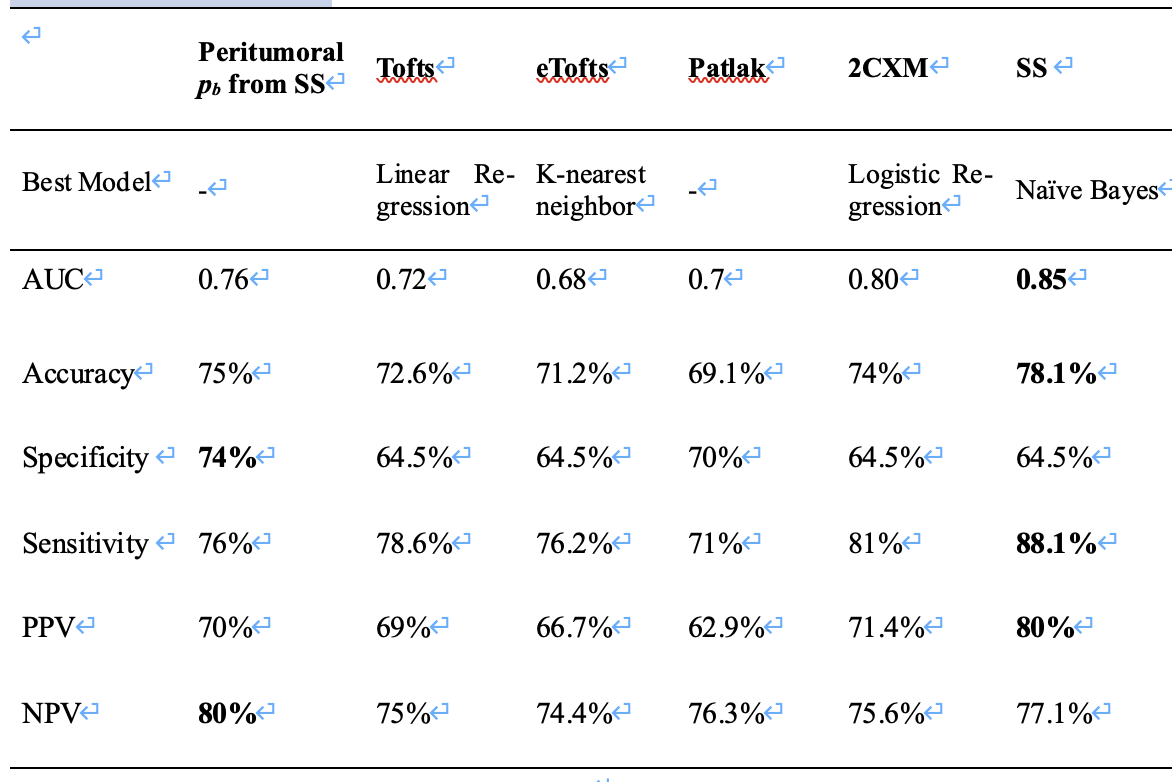
Table 3. Performance of peritumoral pb and pharmacokinetic models in the differential diagnosis between GBM and SBM.