2319
Correlation of T1- to T2-weighted signal intensity ratio with T1- and T2-relaxation time and IDH mutation status in glioma1Neurosurgery, Asahikawa Medical University, Asahikawa, Japan, 2Neurosurgery, Osaka University Graduate School of Medicine, Suita, Japan, 3Diagnostic Radiology, Osaka International Cancer Institute, Osaka, Japan, 4Neurosurgery, Hanwa Memorial Hospital, Osaka, Japan, 5Neurosurgery, Japanese Red Cross Kitami Hospital, Kitami, Japan, 6Neurosugery, Moriyama Hospital, Asahikawa, Japan, 7Biomedical Research and Innovation, Institute for Clinical Research, National Hospital Organization Osaka National Hospital, Osaka, Japan, 8Diagnostic Pathology, Asahikawa Medical University, Asahikawa, Japan, 9Neurosugery, Osaka International Cancer Institute, Osaka, Japan
Synopsis
Keywords: Tumors, Radiomics
The current study aimed to test whether the ratio of T1-weighted to T2-weighted signal intensity (rT1/T2) derived from conventional MRI could act as a surrogate relaxation time predictive of IDH mutation status in histologically lower-grade gliomas. The findings showed that rT1/T2 strongly correlates with T1- and T2-relaxation times in histologically LrGGs. The mean value of rT1/T2 was able to discriminate IDHwt and IDHmt tumors in two domestic cohorts, with statistical significance. However, this result was not validated in the original TCIA/TCGA cohort due to the wide variety of imaging characteristics in the cohort.INTRODUCTION
The presence of IDH mutation for lower-grade gliomas (LrGG) has been known to be a better prognostic indicator compared to the absence of IDH mutation. Previous our study showed IDH-negative LrGG presented noticeably short T1- and T2-relaxation time1. However, this has not yet been incorporated into routine imaging protocols as it requires additional scan time. The ratio of T1WI to T2WI signal intensity (rT1/T2) on MR imaging has been a quantitative imaging surrogate developed for myelin integrity in the brain2, 3 and could potentially be used as an imaging surrogate for tissue relaxation time. The aim of the present study was to test the hypothesis that rT1/T2 is predictive of IDH mutation status in histologically LrGGs.METHODS
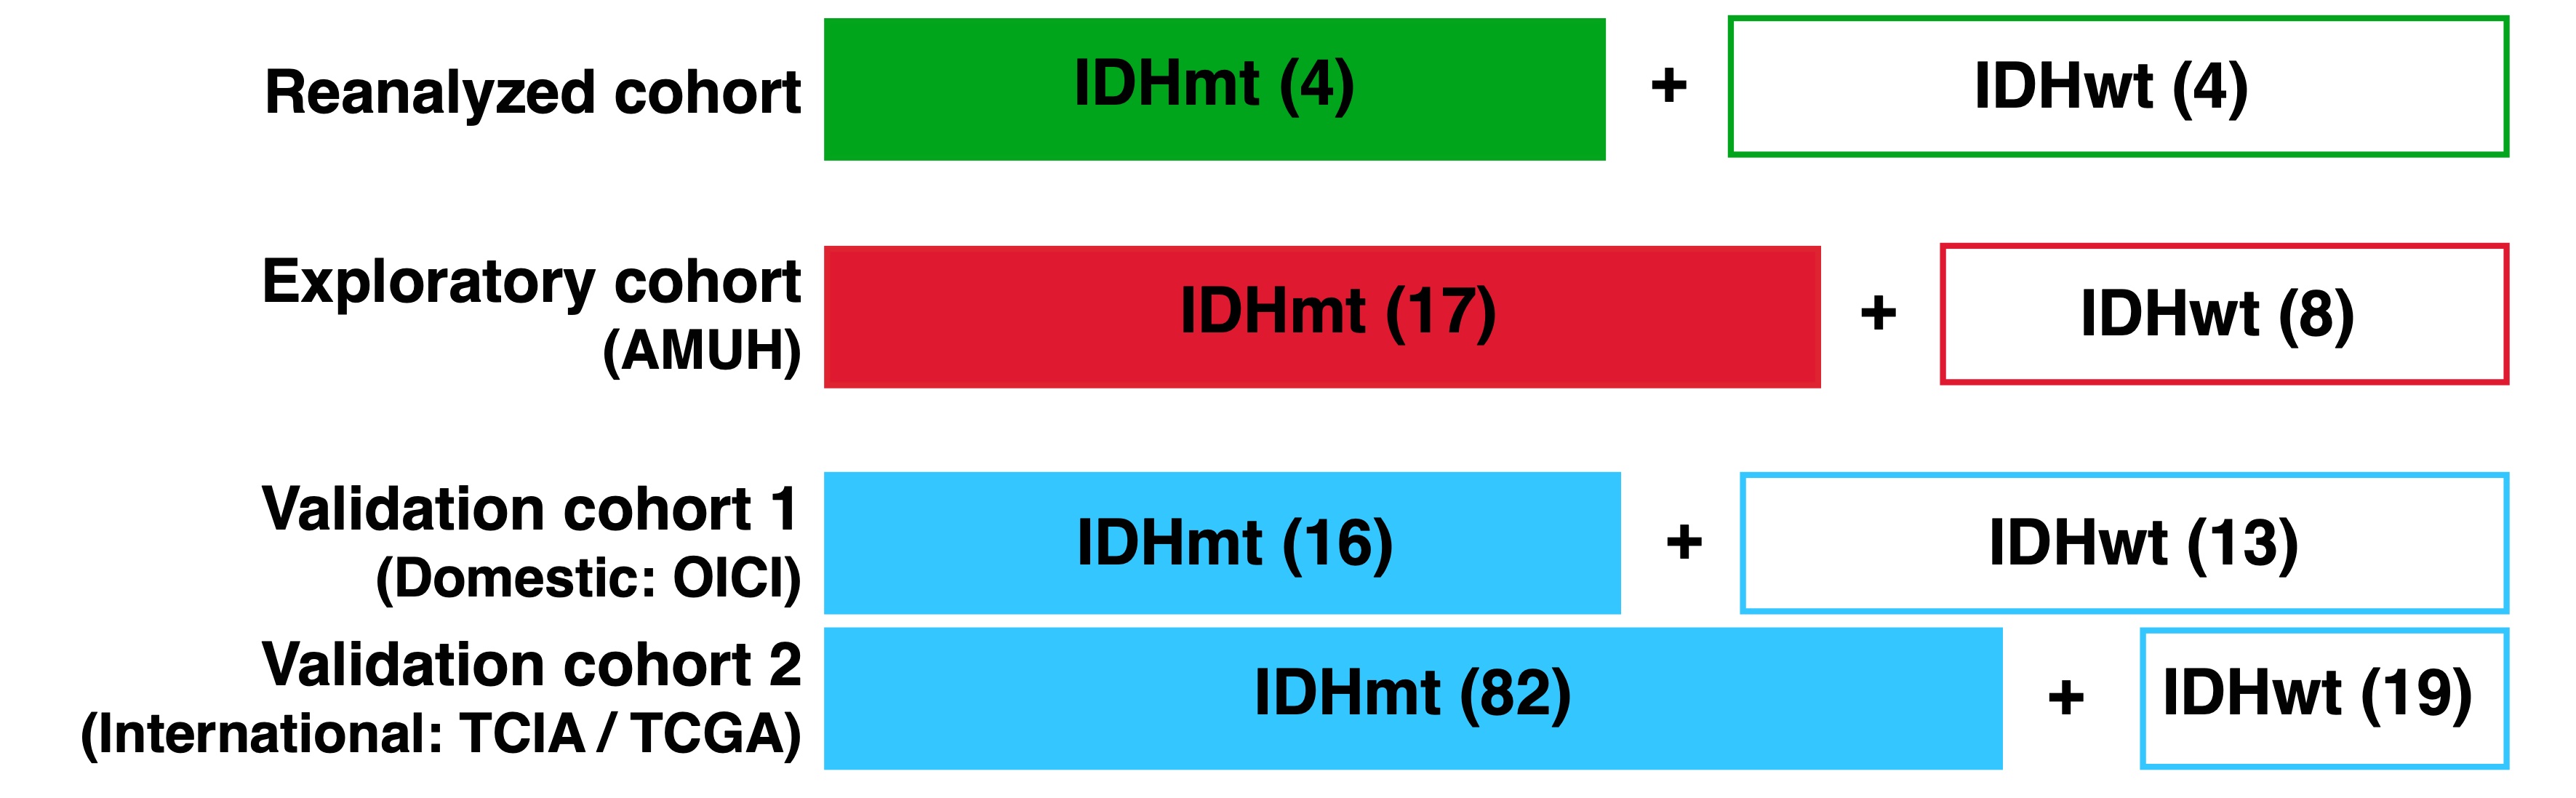
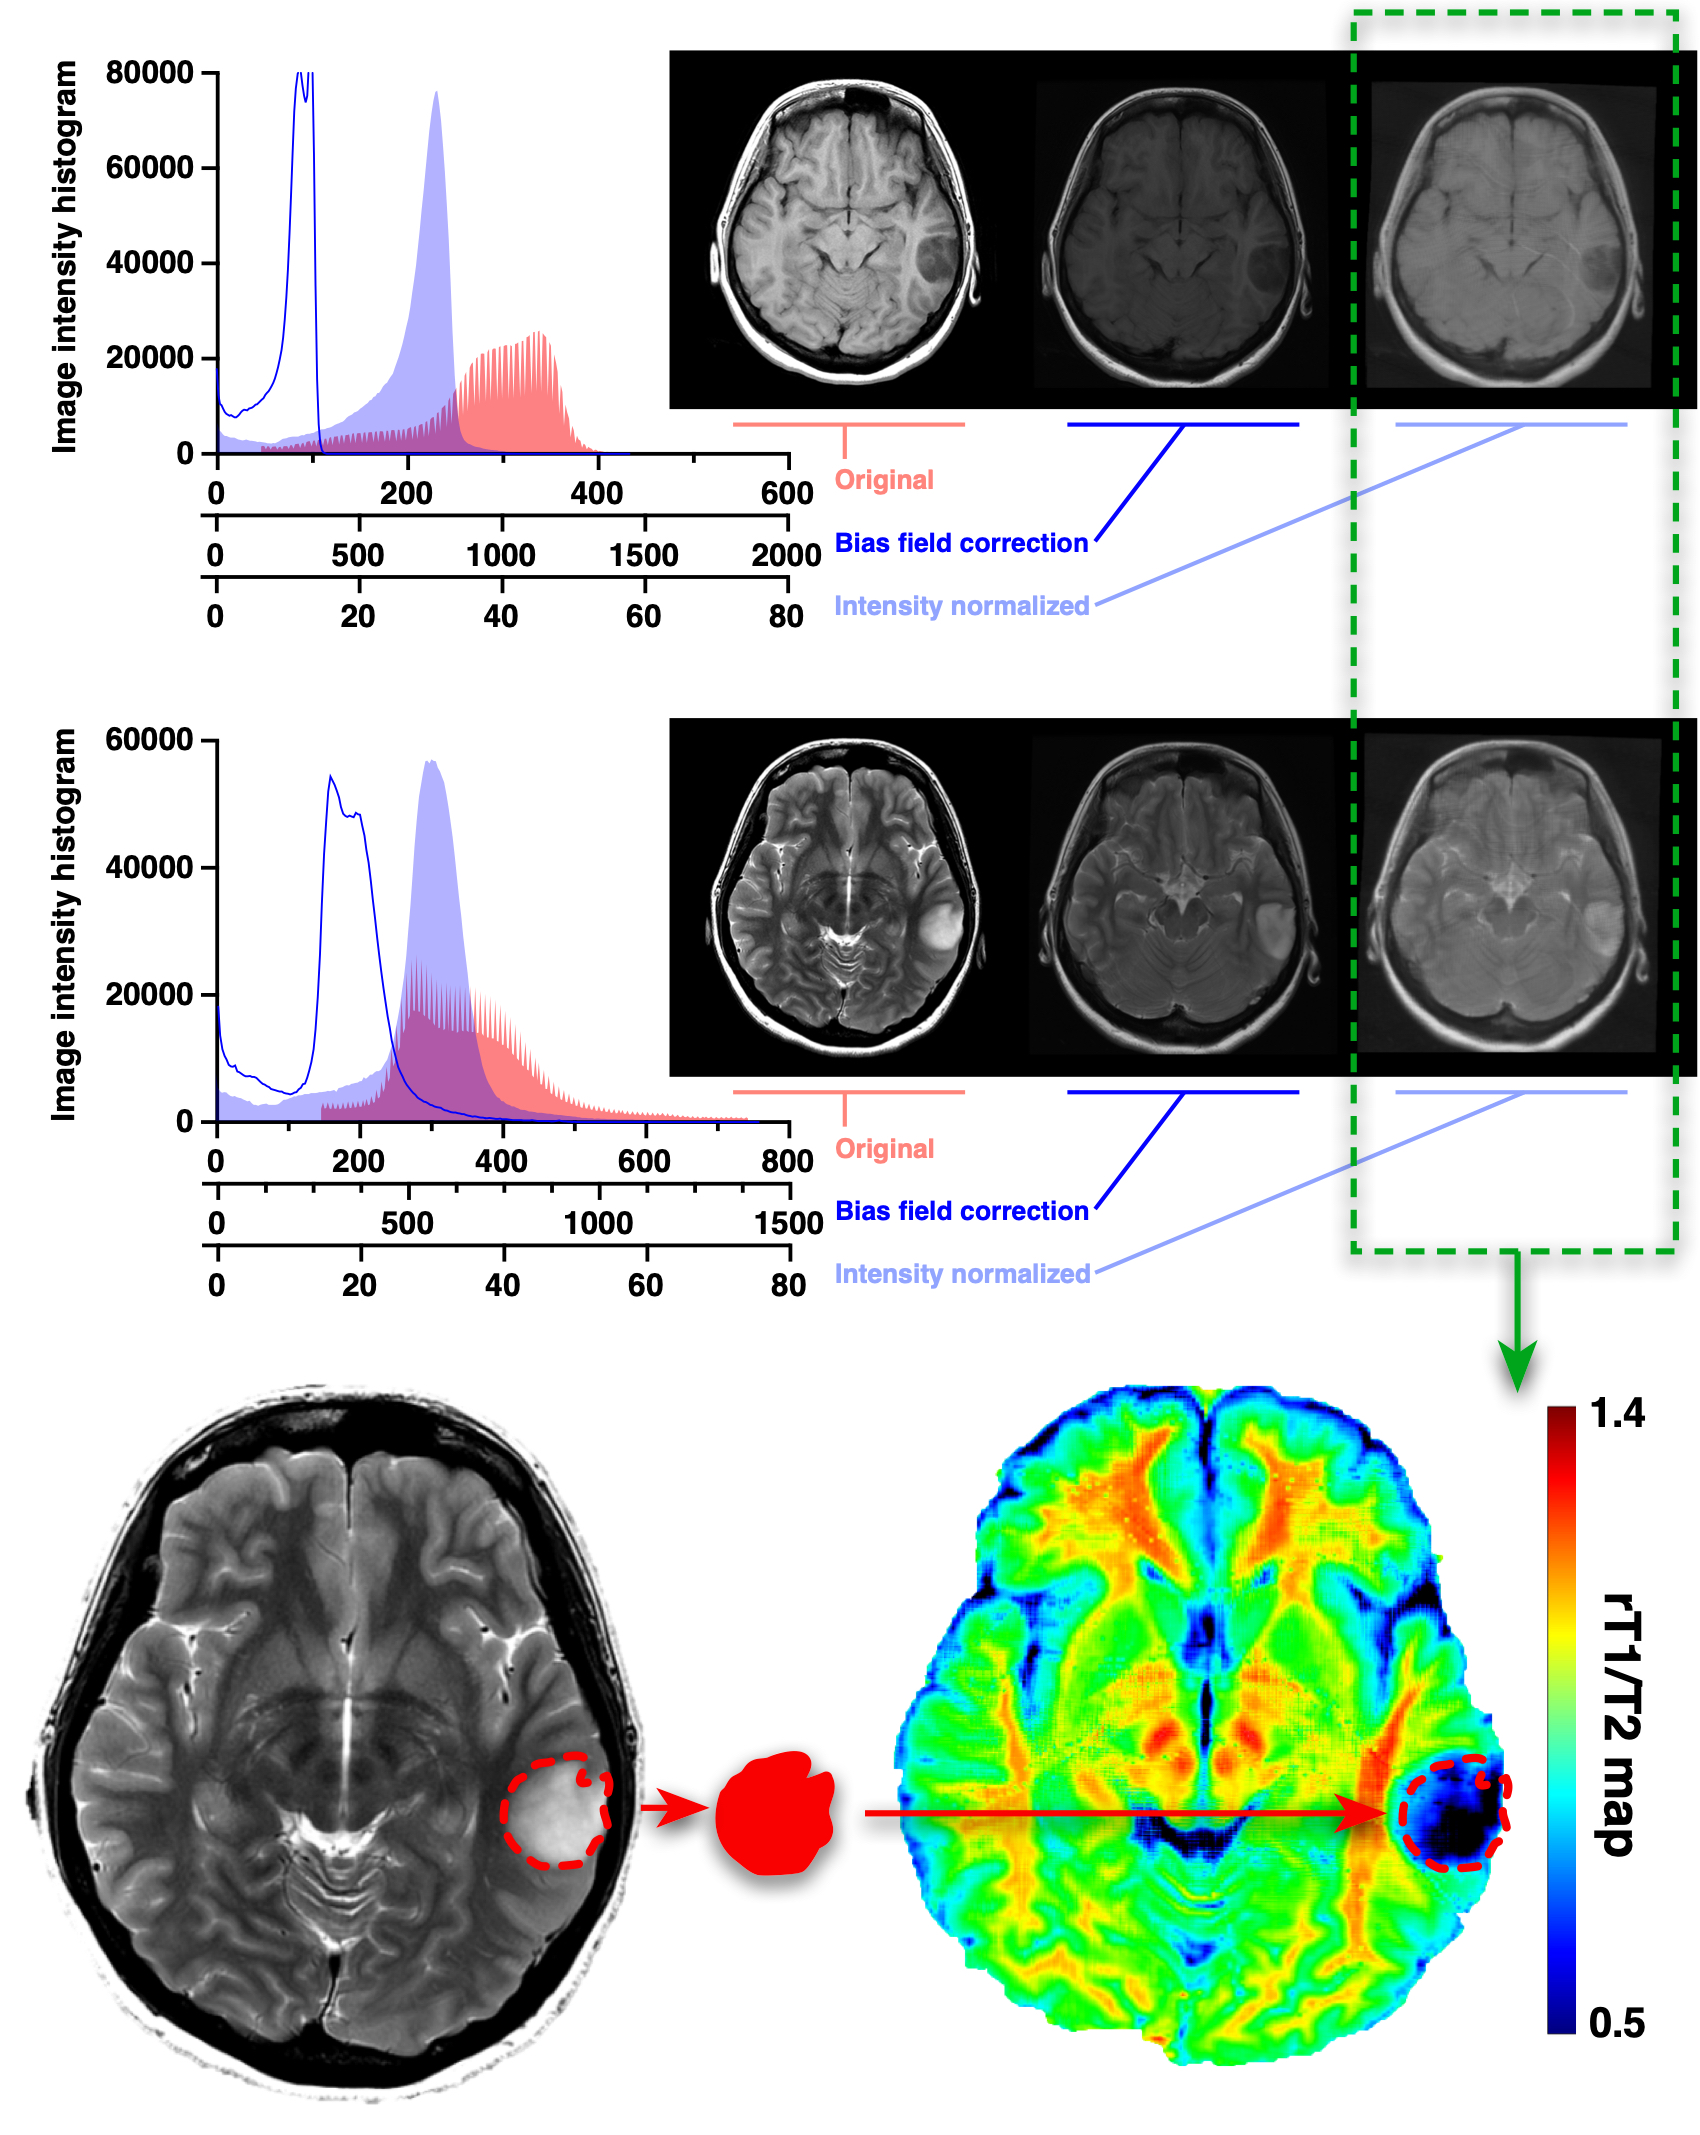
We first reanalyzed previously published T1- and T2-relaxometry data of histologically LrGGs1 and compared these T1- and T2-relaxometry data with rT1/T2 (Figure 1). The technical details have been reported previously.We then prepared a new set of three cohorts and conducted a two-stage study (Figure 1). The first cohort (exploratory cohort) comprised 25 histologically and molecularly confirmed histologically LrGGs (IDHwt: 8, IDHmt: 17) treated at Asahikawa Medical University Hospital (AMUH) to investigate the ideal cut-off of mrT1/T2 for detecting mutant. The second and third cohorts were used as validation cohorts using the cut-off of the exploratory cohort. Validation cohort 1 comprised 29 patients (IDHwt: 13, IDHmt: 16) from the Osaka International Cancer Institute (OICI) and validation cohort 2 comprised 101 patients (IDHwt: 19, IDHmt: 82) from the Cancer Imaging Archive (TCIA) / Cancer Genome Atlas (TCGA) low- grade glioma collection dataset.
T1-weighted images were co-registered to T2-weighted images, and rT1/T2 images were calculated from T1- and T2-weighted images using a recommended signal correction3. Voxels-of-interests (VOIs) were manually segmented and defined based on high intensity area on T2-weighted image including pathological lesions. rT1/T2 was created according to VOI on rT1/T2 images, and mean rT1/T2 (mrT1/T2) was calculated. The relationship between the mrT1/T2 and the IDH mutation status was investigated by Mann-Whitney U test and ROC curve analysis.
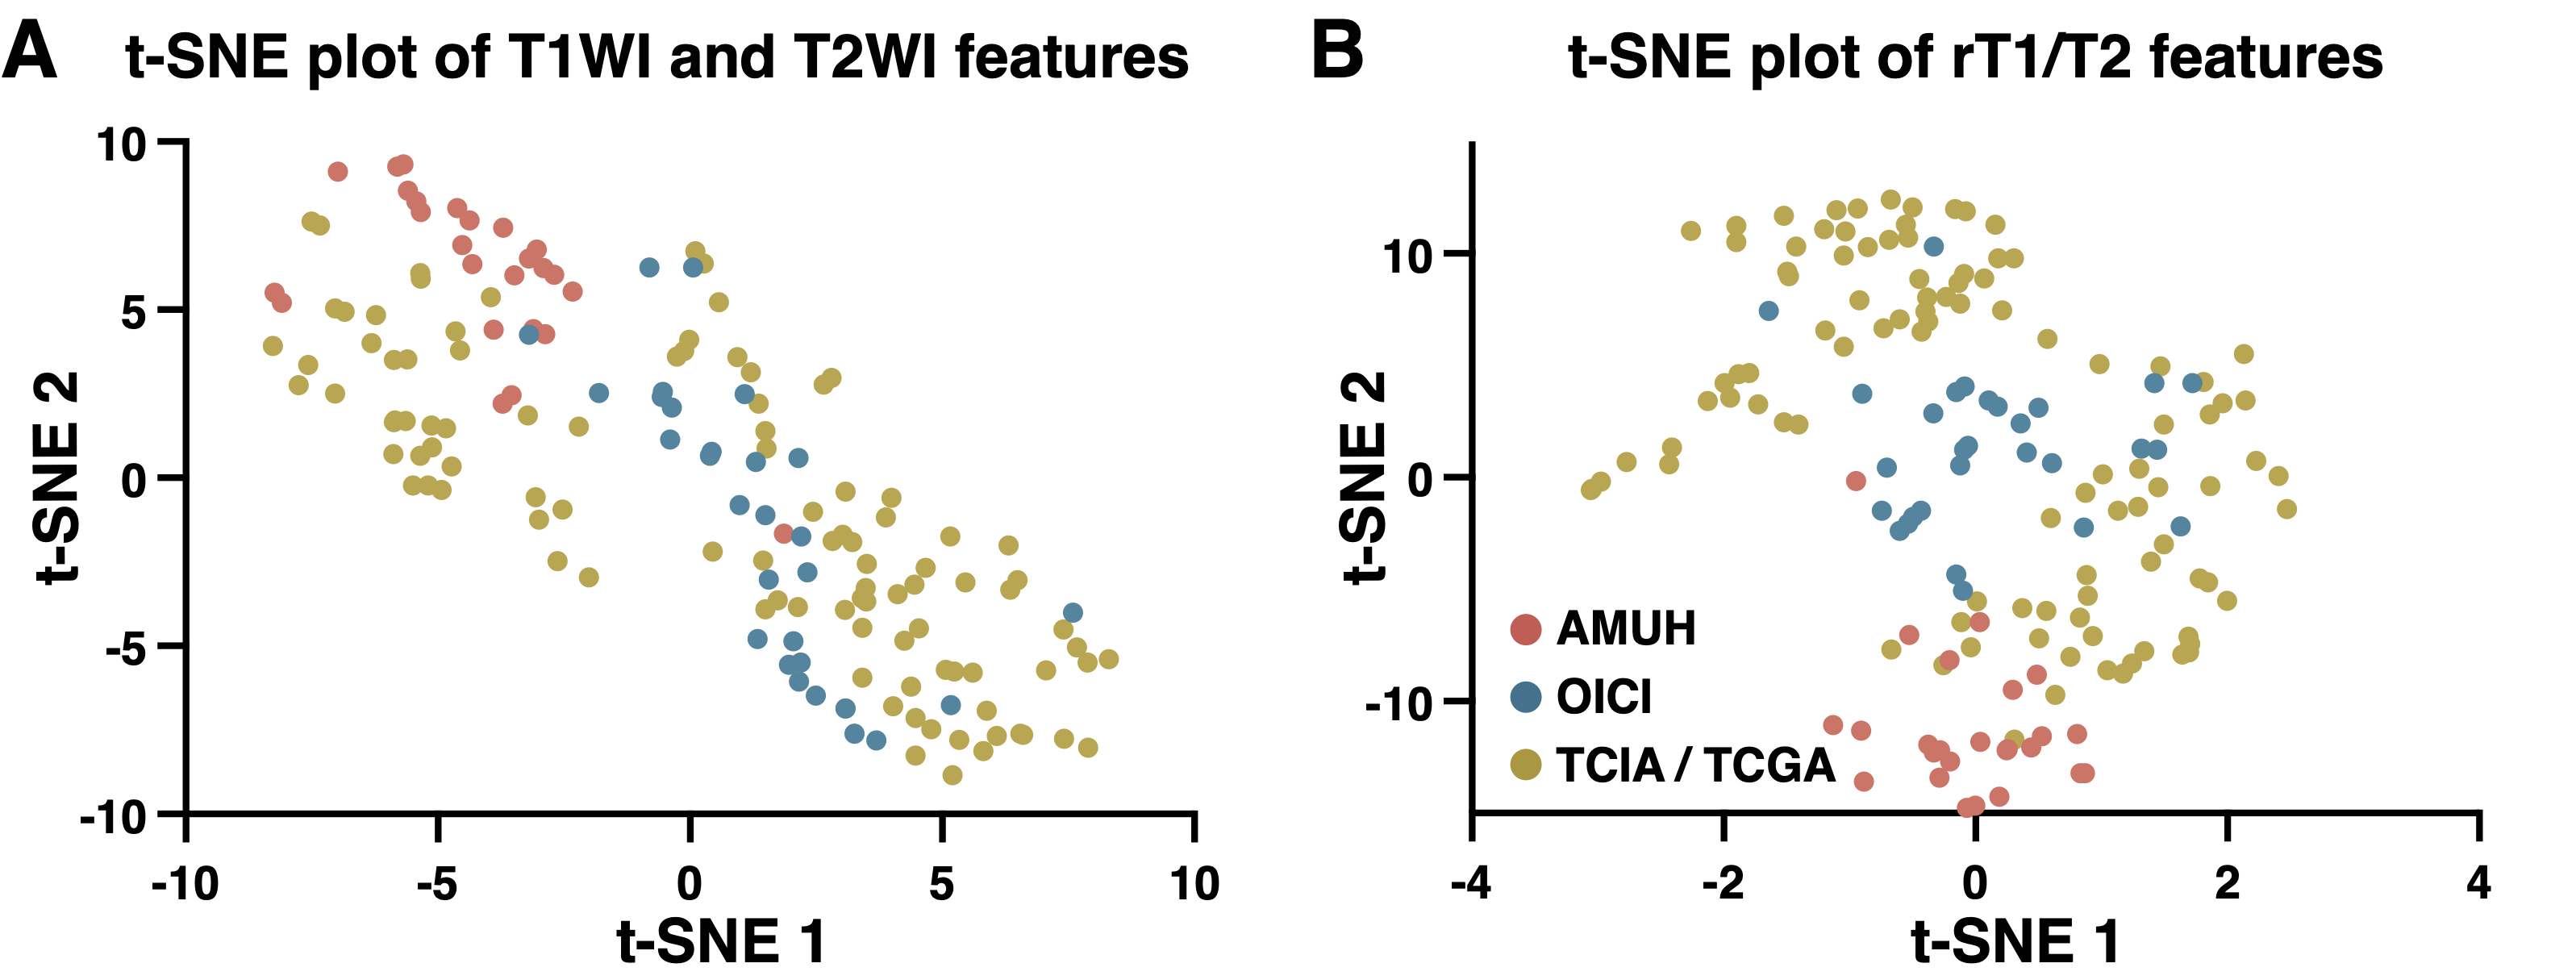
Image features were extracted from T1WI and T2WI according to the method described previously4. t-Distributed Stochastic Neighbor Embedding (t-SNE) analysis was used to investigate the difference in MRI qualities and characteristics among the three cohorts.
RESULTS
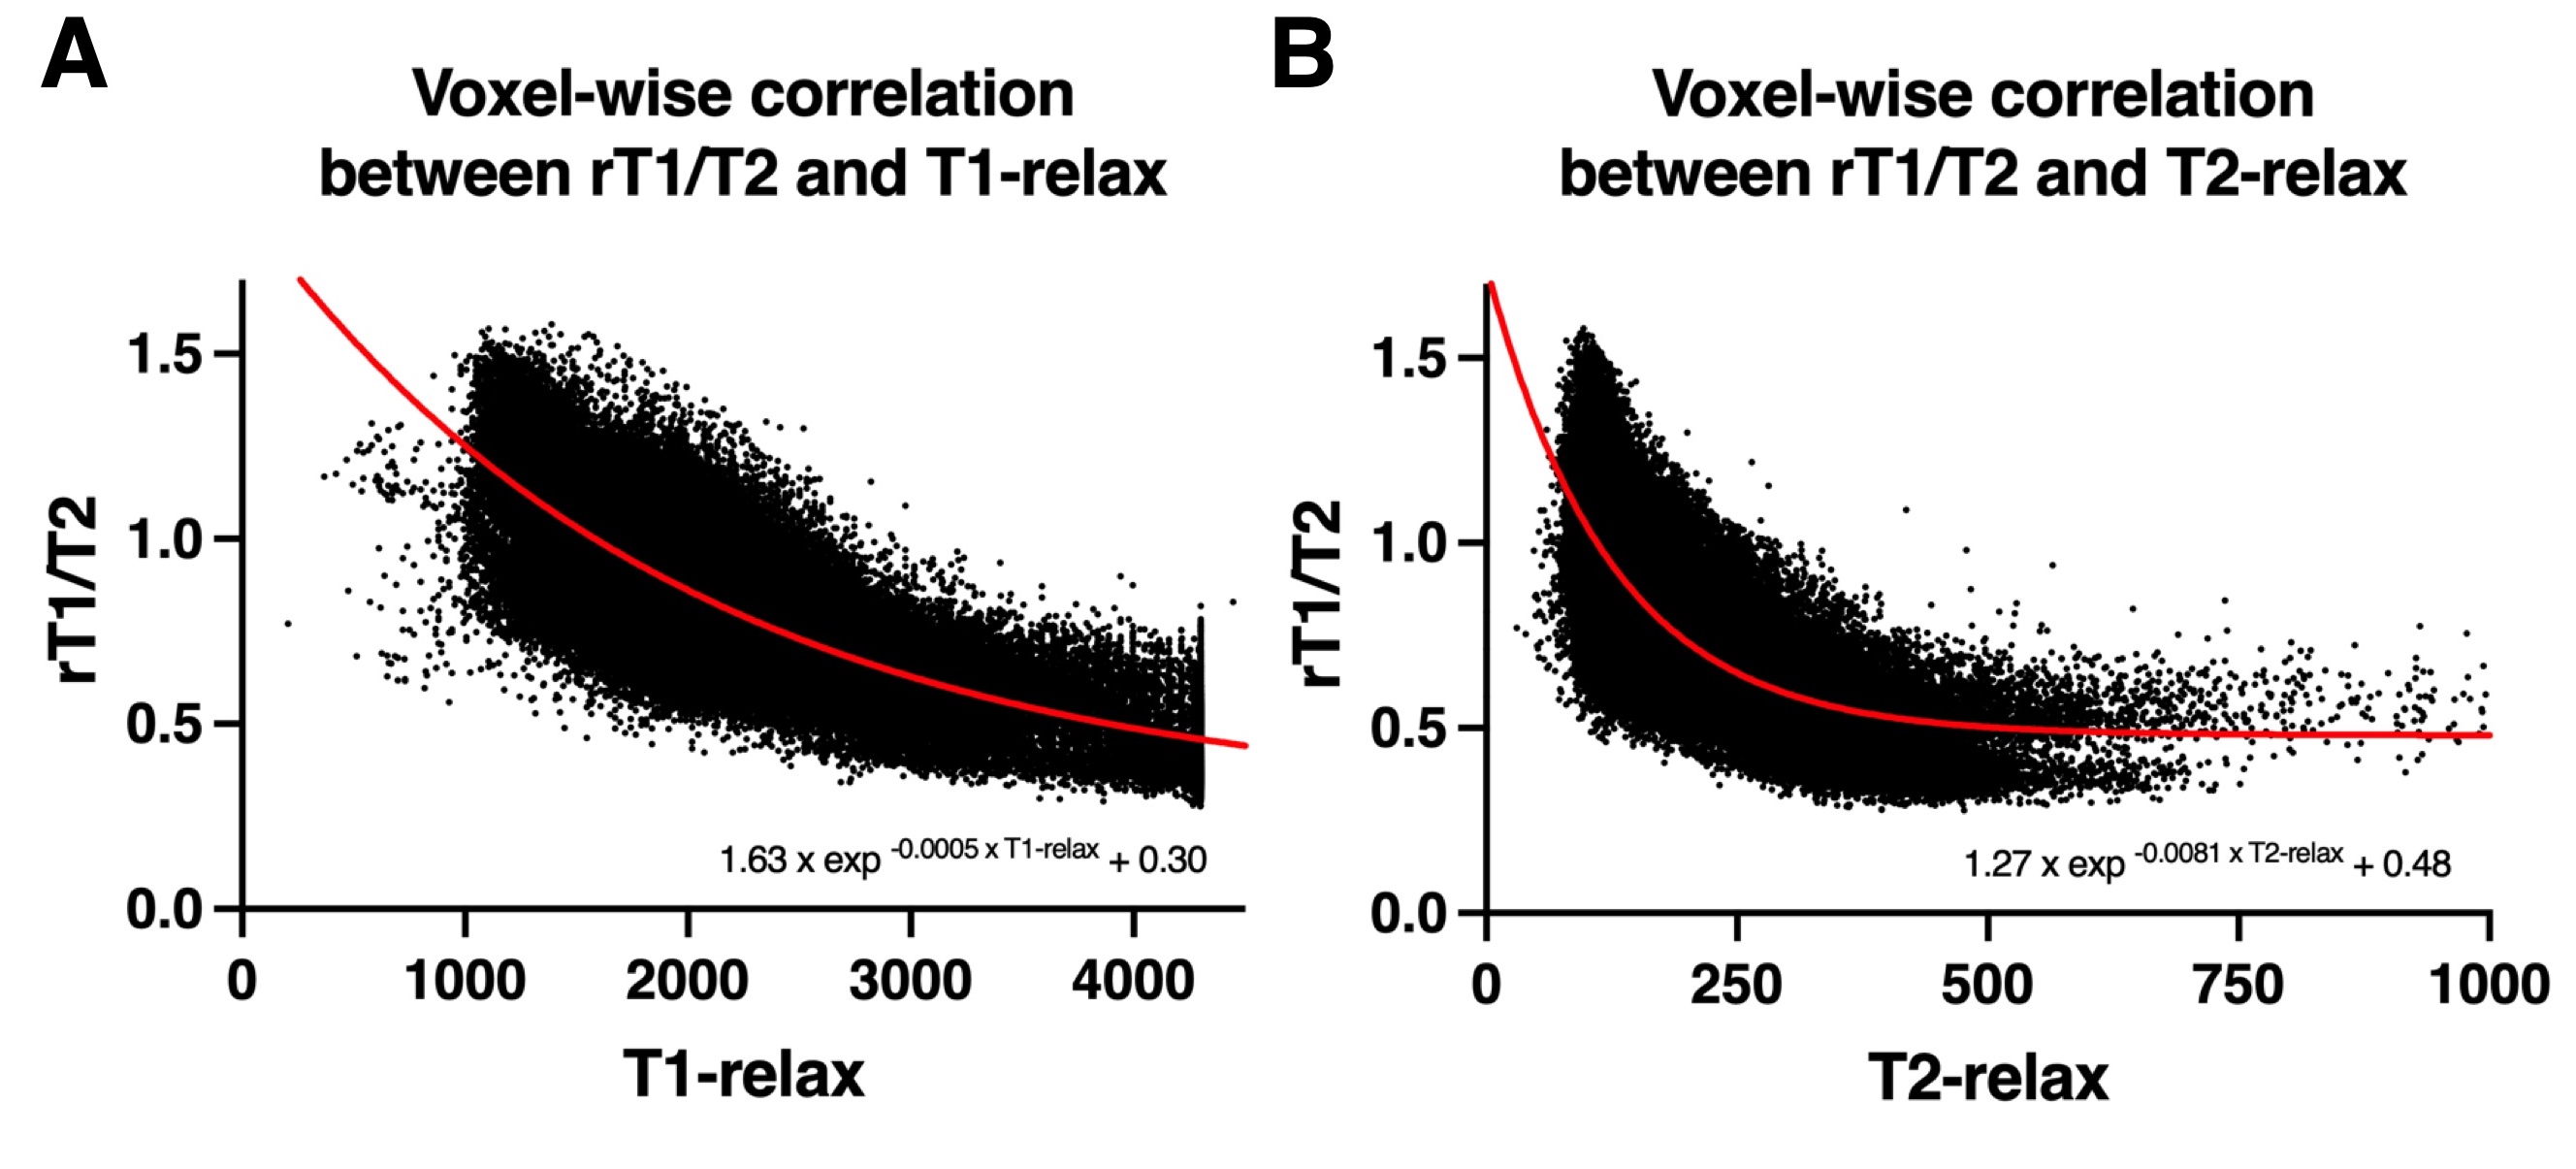
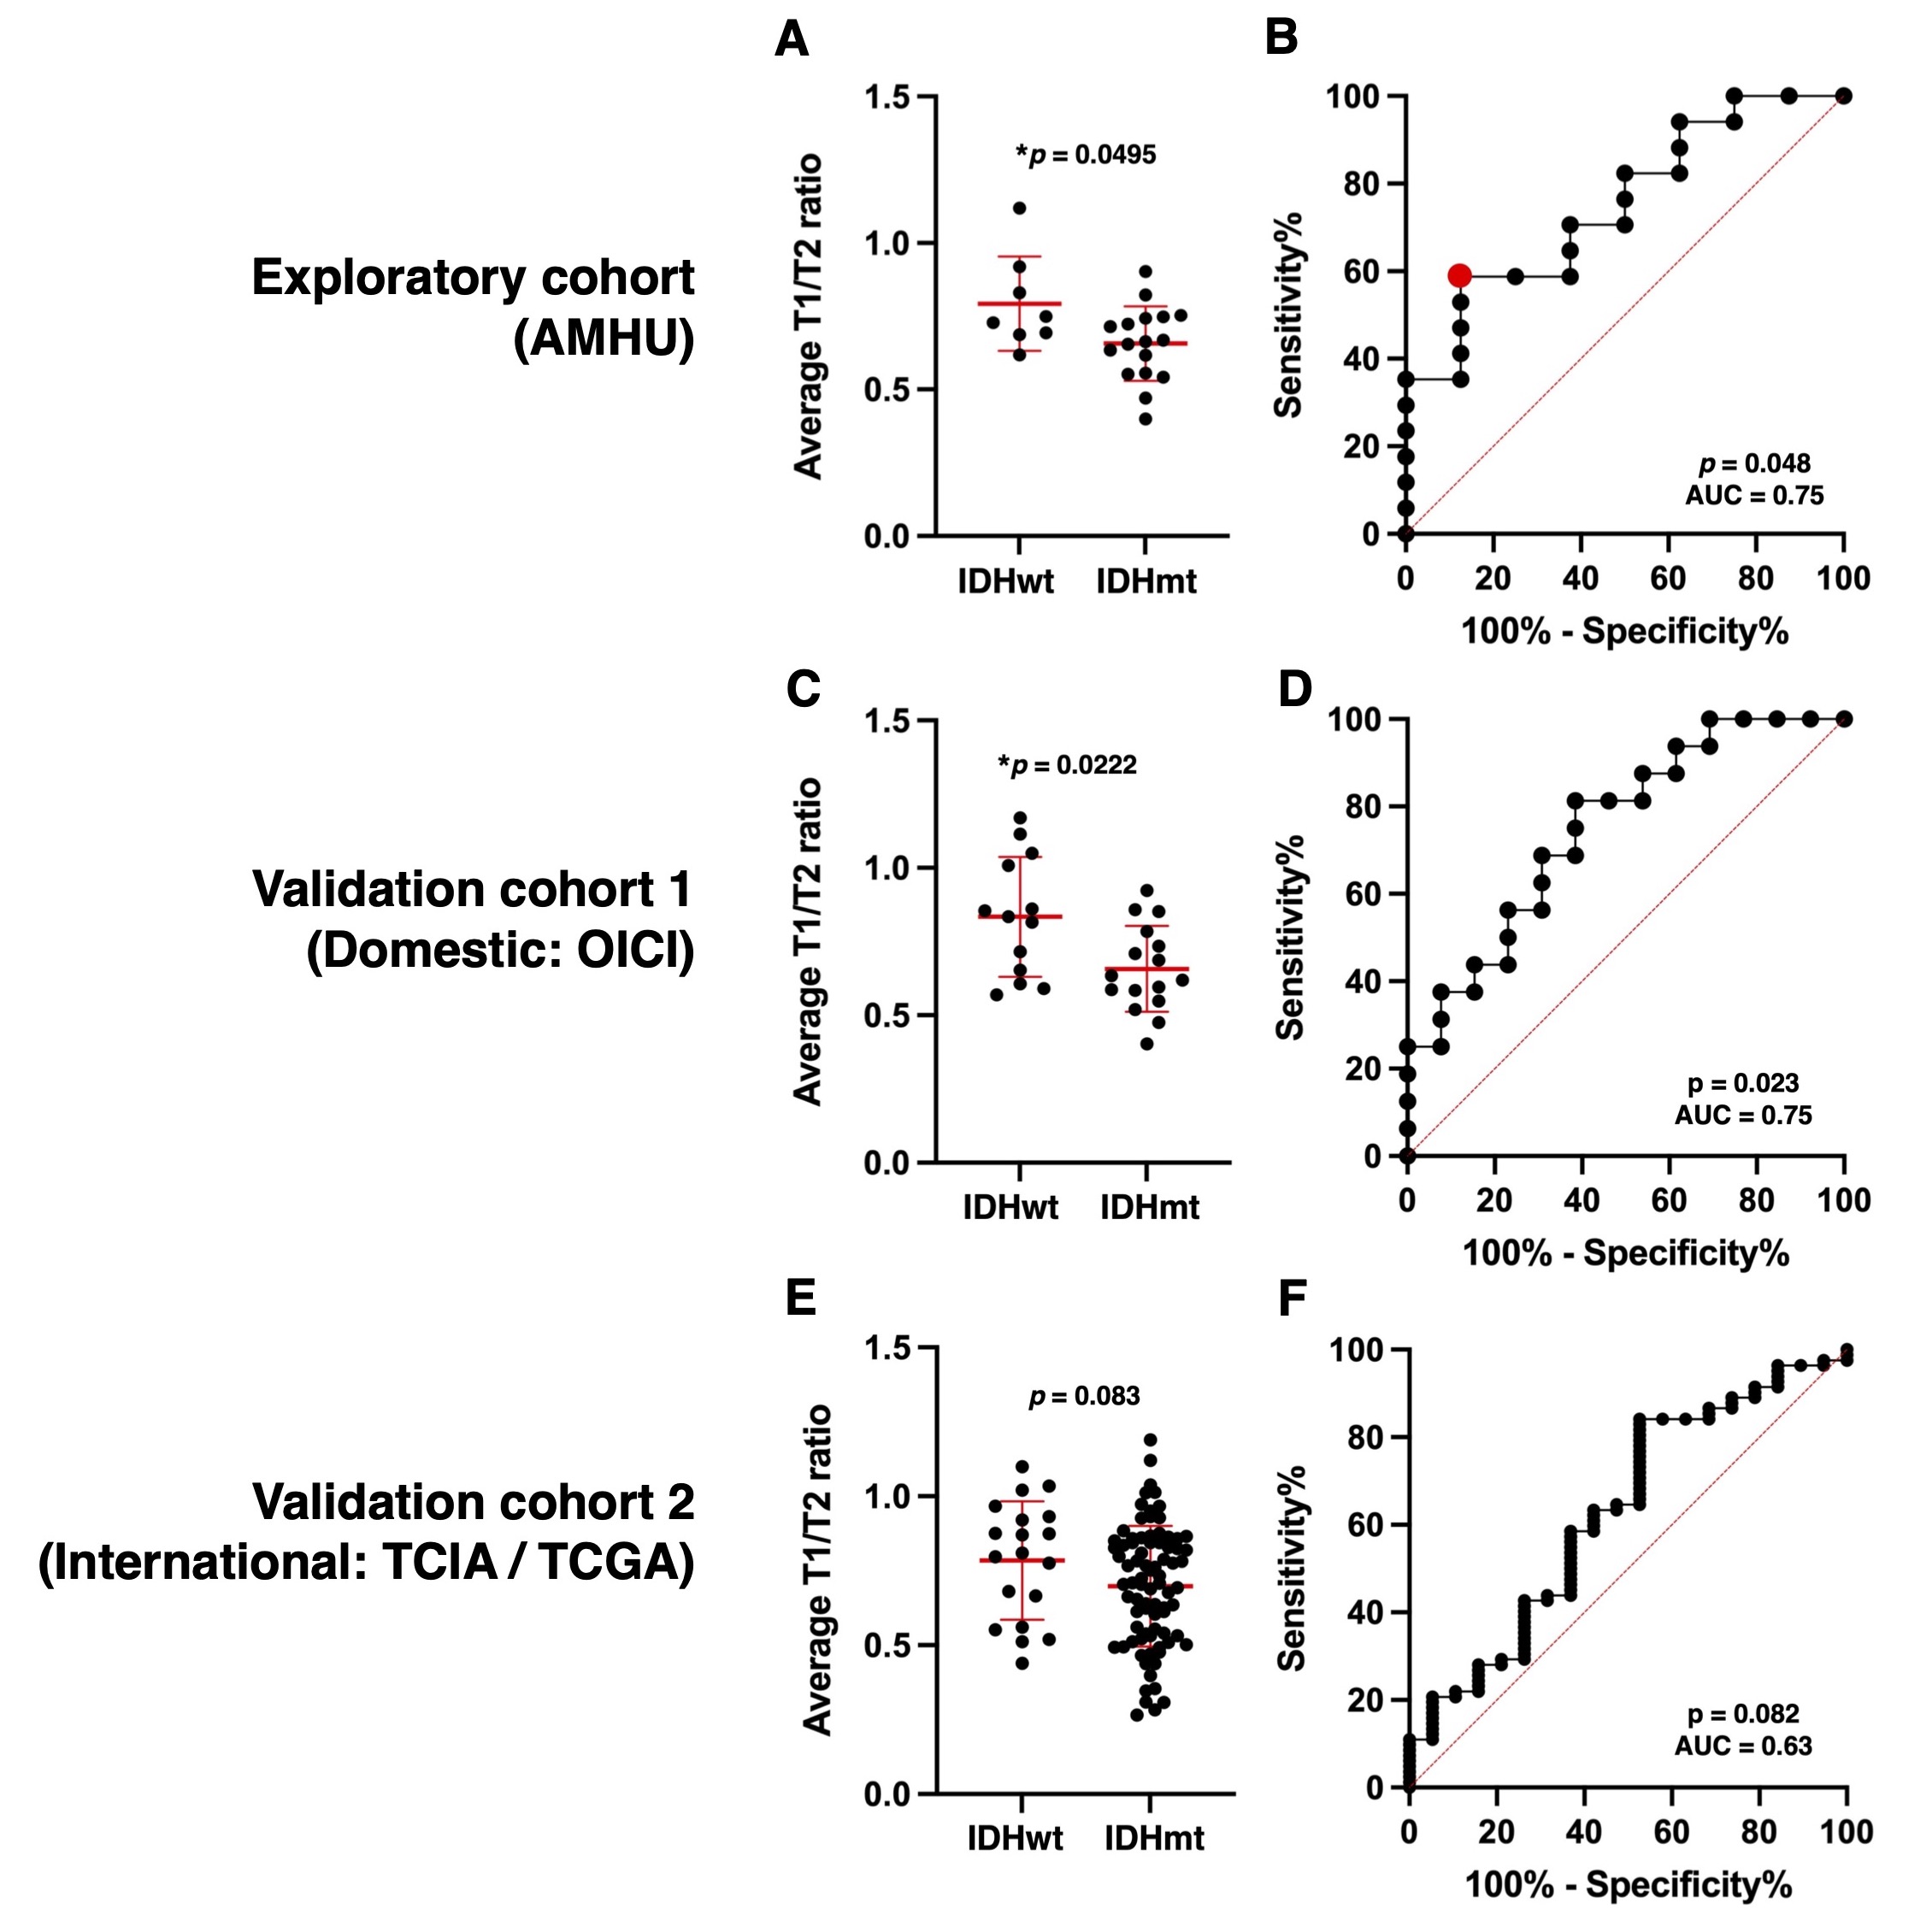
Correlation between relaxometry and rT1/T2: Reanalyzed cohort Voxel-wise analysis was performed for 114,465 voxels in total. T1- and T2-relax exhibited strong exponential correlations with rT1/T2 (rT1/T2 = 1.63exp−0.0005T1-relax + 0.30 and rT1/T2 = 1.27exp−0.0081T2-relax + 0.48; R2 = 0.64 and 0.59, respectively) (Figure 3)Exploratory cohort (AMUH): The difference of mrT1/T2 between two groups (IDH negative vs IDH positive) was statistically significant (p = 0.0495 < 0.05) (Figure 4A). Moreover, ROC curve analysis showed the ideal cut-off for detecting mutant IDH was mrT1/T2 < 0.666 ~ 0.677, with a sensitivity of 58.8% and a specificity of 87.5% (AUC = 0.75, p = 0.048) (Figure 4B).
Validation cohort 1 (Domestic: OICI), Validation cohort 2 (International: TICA/TCGA): The OICI cohort validated a statistically significant difference in mrT1/T2 between IDHwt and IDHmt tumors (median value = 0.83 vs. 0.63, p = 0.02) (Figure 4C) but no significant difference in TCIA validation cohort (p = 0.08) (Figure 4E). Regarding ROC analysis, the result was further validated by the OICI validation cohort (AUC = 0.75, p = 0.02) with the sensitivity of 56.3% and the specificity of 69.2% (Figure 4D). On the other hand, the sensitivity was 42.9% and the specificity was 73.7 % for the TCIA validation cohort (AUC = 0.63, p = 0.08) (Figure 4F).
Impact of original image characteristics: t-SNE analysis of the original T1WI and T2WI revealed clusters of image features in the exploratory cohort (the AMUH cohort) and the validation cohort (the OICI cohort), whereas those in the validation cohort 2 (the TCIA/TCGA cohort) were scattered across both the t-SNE1 and t-SNE axes (Figure 5A). Reconstruction of rT1/T2 from T1WI and T2WI resulted in more dense clustering of all data points (Figure 5B), bringing data points of the AMUH and OICI cohorts closer. However, data points obtained from the TCIA/TCGA cohort remained scattered compared to the two domestic cohorts.
DISCUSSION
The results obtained in the two domestic cohorts supported the hypothesis that rT1/T2 could be usable for the presurgical determination of IDH mutation status in histologically LrGGs, without performing direct measurement of the tissue relaxation properties. However, the results obtained in the domestic cohorts (validation cohort 1) were not reproduced in the TCIA/TCGA cohort (validation cohort 2). This discrepancy is due to the diversity of imaging features in the TCIA/TCGA cohort than in the domestic cohorts. Therefore, to use rT1/T2 for predicting IDH mutation status, it might be necessary to use a preset MRI acquisition protocol or an institution-dependent cut-off value.CONCLUSION
The findings of the present study showed that rT1/T2 strongly correlates with T1- and T2-relaxation times in histologically LrGGs. The mean value of rT1/T2 was able to discriminate IDHwt and IDHmt tumors in two domestic cohorts, with statistical significance. However, this result was not validated in the original TCIA/TCGA cohort due to the wide variety of imaging characteristics in the cohort.Acknowledgements
This research was funded by the Japan Society for the Promotion of Science (Nos. 19K09526, 22K09200), the Japan Agency for Medical Research and Development (Japan Cancer Research Project, Nos. 19188187 and 21459042), the Takeda Science Foundation, the MSD Life Science Foundation, and the Okawa Foundation for Information and Telecommunications. All scientific grants were for Manabu Kinoshita.References
1. Kinoshita M, Uchikoshi M, Sakai M, Kanemura Y, Kishima H, Nakanishi K. T2-FLAIR Mismatch Sign Is Caused by Long T1 and T2 of IDH-mutant, 1p19q Non-codeleted Astrocytoma. Magn Reson Med Sci. 2021 Mar 1;20(1):119-123.
2. Glasser MF, Van Essen DC. Mapping human cortical areas in vivo based on myelin content as revealed by T1- and T2-weighted MRI. J Neurosci. 2011 Aug 10;31(32):11597-616.
3. Ganzetti M, Wenderoth N, Mantini D. Whole brain myelin mapping using T1- and T2-weighted MR imaging data. Front Hum Neurosci. 2014 Sep 2;8:671.
4. Sasaki T, Kinoshita M, Fujita K, Fukai J, Hayashi N, Uematsu Y, Okita Y, Nonaka M, Moriuchi S, Uda T, Tsuyuguchi N, Arita H, Mori K, Ishibashi K, Takano K, Nishida N, Shofuda T, Yoshioka E, Kanematsu D, Kodama Y, Mano M, Nakao N, Kanemura Y. Radiomics and MGMT promoter methylation for prognostication of newly diagnosed glioblastoma. Sci Rep. 2019 Oct 8;9(1):14435.
Figures