2318
Differentiation of tumor-infiltrated edema and pure vasogenic edema in patients with brain tumors by using a fractional order calculus model1Department of Radiology, Sun Yat-Sen Memorial Hospital, Sun Yat-Sen University, Guangzhou, China, 2MR Scientific Marketing, Siemens Healthineers Ltd, Guangzhou, China
Synopsis
Keywords: Tumors, Diffusion/other diffusion imaging techniques
A fractional order calculus model (FROC) holds promise in differentiating tumor-infiltrated edema from pure vasogenic edema of brain tumors. This study used a q-space Cartesian grid sampling scheme, diffusion spectrum imaging, in patients with high-grade gliomas, meningiomas and brain metastases to generate FROC-based parameters, including D, β and μ. The μ showed the best individual parameter performance in differentiating tumor-infiltrated edema from pure vasogenic edema.Introduction
Peritumoral edema is the region of tissue surrounding the T2 signal intensity abnormality, composed of edema with or without tumor cell infiltration.1 The peritumoral edema of high-grade gliomas (HGGs) is often infiltrated with tumor cells, so-called tumor-infiltrated edema. Comparatively, peritumoral edema of meningioma and brain metastases (BrMs) is often considered pure vasogenic edema.2,3 As an advanced diffusion model, the fractional order calculus model (FROC) could generate diffusion parameters to probe the tissue microstructure and diffusion heterogeneity, providing new insight into peritumoral edema.4 Thus, the purpose of this study was to determine the feasibility of using FROC parameters to differentiate tumor-infiltrated edema from pure vasogenic edema.Methods
Forty patients with brain tumors accompanied by peritumoral edema were included in this study. Among the forty patients, ten had HGGs, fifteen had meningiomas, and fifteen had BrMs. All images were acquired with a 3.0 T MR scanner (MAGNETOM Skyra, Siemens Healthcare, Erlangen, Germany), including T2-weighted images, contrast-enhanced T1-weighted images, and diffusion spectrum images. Specifically, before the injection of contrast medium, the diffusion-weighted (DW) data were acquired in the axial plane using diffusion spectrum imaging sequence, a q-space Cartesian grid sampling procedure, with 99 diffusion gradient directions and ten b-values (0, 350, 650, 1000, 1350, 1650, 1700, 2000, 2700 and 3000 s/mm2). The MRI protocol was as follows: repetition time (TR), 6000 ms; echo time (TE), 109 ms; field of view (FOV), 220 × 220 mm2; slice thickness: 40 mm; matrix size, 110 × 110; acquisition time, 10:32 min. All DW data were calculated using the software (BoDiLab) developed in-house based on the open-resource tool DIPY (Diffusion Imaging in Python, http://nipy.org/dipy). The diffusion coefficient D (in square millimeters/second), fractional order derivative in space β, and a spatial parameter μ (in micrometers) maps were generated using the fractional order calculus model. For each case, a region of interest (ROI) contained the largest area of high T2 signal intensity by visual inspection. The ROIs were copied to all parametric diffusion maps to calculate corresponding average values. An independent-sample t test was used to analyze the differences between tumor-infiltrated edema (peritumoral edema of HGGs) and pure vasogenic edema (peritumoral edema of meningiomas and BrMs). Differences in all FROC parameters of HGGs, meningiomas and BrMs were compared by using the one-way ANOVA with LSD test for multiple comparisons. The diagnostic effectiveness of FROC parameters was evaluated by receiver operating characteristic (ROC) curve analysis and areas under the curve (AUCs).Results
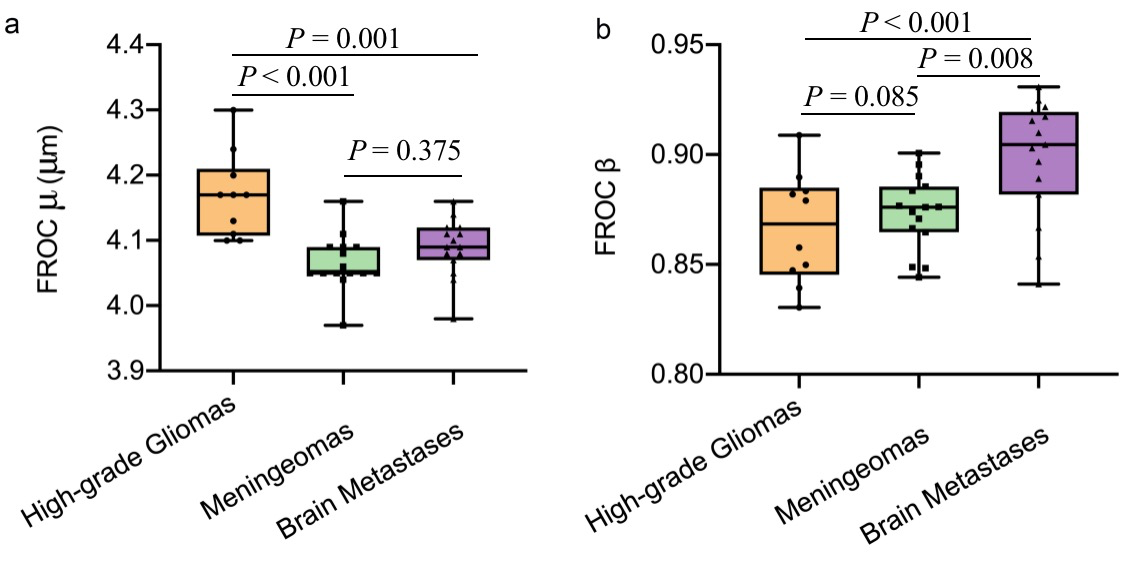
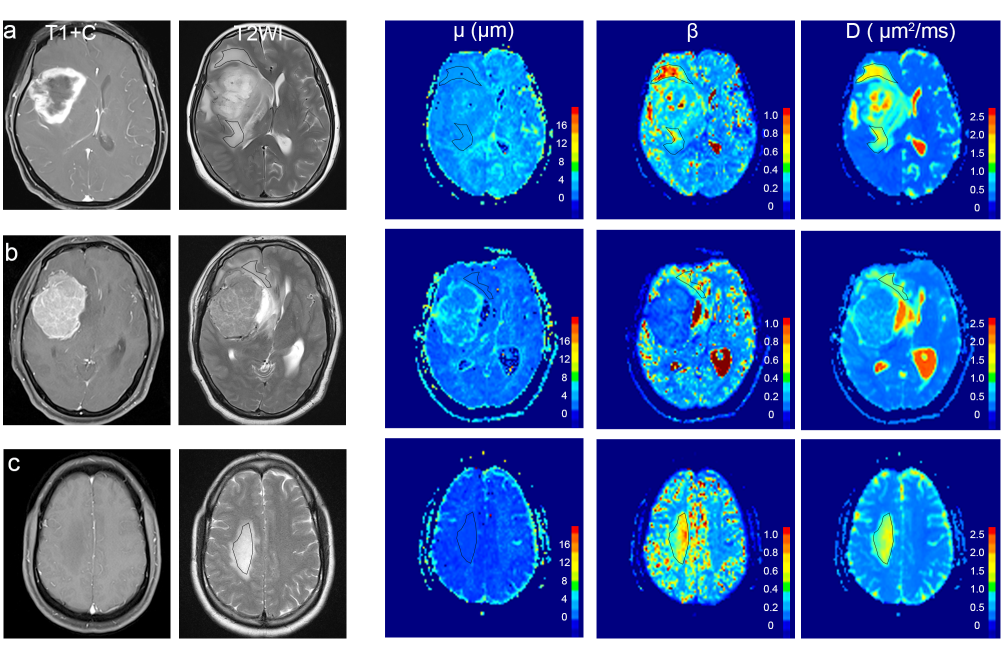
Table 1 shows the detailed FROC parameters of tumor-infiltrated edema (peritumoral edema of HGGs) and pure vasogenic edema (peritumoral edema of meningiomas and BrMs). The μ was significantly higher for tumor-infiltrated edema than for pure vasogenic edema (P < 0.001). The β was significantly lower for tumor-infiltrated edema than for pure vasogenic edema (P = 0.001). No significant differences were found in D between the two groups (P > 0.05). Specifically, the μ of peritumoral edema of HGGs was significantly higher than that of meningiomas and BrMs (P < 0.001, P = 0.001, respectively); meanwhile, there was no significant difference between meningiomas and BrMs (P = 0.375) (Figure 1a). Moreover, the β of peritumoral edema of HGGs exhibited significantly lower than that of BrMs (P < 0.001), the β of peritumoral edema of meningiomas and BrMs showed significant differences (P = 0.008 ), while no significant differences were found in β between HGGs and meningiomas (P =0.085) (Figure 1b). Three representative cases are shown in Figure 2. ROC analyses showed that μ had the highest AUC (0.891) for differentiating tumor-infiltrated edema from pure vasogenic edema, while the AUCs for β and D were 0.803, 0.650, respectively (Figure 3).Discussion and Conclusion
Our results demonstrate the feasibility of using FROC diffusion parameters to differentiate tumor-infiltrated edema and pure vasogenic edema. Previous studies showed that tissues with a smaller β value represented a more considerable degree of intravoxel heterogeneity.3 The lower β values in peritumoral edema of HGGs (Table 1 and Figure 1b) were consistent with the increased degree of tissue heterogeneity. The μ value, as a spatial parameter, has been used to measure the diffusion mean free length.5 In our study, μ differed significantly between tumor-infiltrated edema (HGGs) and vasogenic edema (BrMs or meningiomas) and provided the best individual parameter performance in differentiating the regions of edema when compared with the other diffusion parameters.Acknowledgements
No acknowledgement found.References
1. Lu S, Ahn D, Johnson G, Law M, Zagzag D, Grossman RI. Diffusion-tensor MR imaging of intracranial neoplasia and associated peritumoral edema: introduction of the tumor infiltration index. Radiology. 2004 Jul;232(1):221-8.2.
2. Min ZG, Niu C, Rana N, Ji HM, Zhang M. Differentiation of pure vasogenic edema and tumor-infiltrated edema in patients with peritumoral edema by analyzing the relationship of axial and radial diffusivities on 3.0T MRI. Clin Neurol Neurosurg. 2013 Aug;115(8):1366-70.3.
3. Sternberg EJ, Lipton ML, Burns J. Utility of diffusion tensor imaging in evaluation of the peritumoral region in patients with primary and metastatic brain tumors. AJNR Am J Neuroradiol. 2014 Mar;35(3):439-44.4.
4. Sui Y, Xiong Y, Jiang J, Karaman MM, Xie KL, Zhu W, Zhou XJ. Differentiation of Low- and High-Grade Gliomas Using High b-Value Diffusion Imaging with a Non-Gaussian Diffusion Model. AJNR Am J Neuroradiol. 2016 Sep;37(9):1643-9.5.
5. Karaman MM, Tang L, Li Z, Sun Y, Li JZ, Zhou XJ. In vivo assessment of Lauren classification for gastric adenocarcinoma using diffusion MRI with a fractional order calculus model. Eur Radiol. 2021 Aug;31(8):5659-5668.
Figures