2317
A robust MRSI protocol to investigate glutamatergic mechanisms in glioma1Institute of Neuroradiology, University Hospital Frankfurt, Goethe University, Frankfurt am Main, Germany, 2University Cancer Center Frankfurt (UCT), Frankfurt am Main, Germany, 3Frankfurt Cancer Institute (FCI), Frankfurt am Main, Germany, 4German Cancer Research Center (DKFZ) Heidelberg, Germany and German Cancer Consortium (DKTK), Partner Site Frankfurt/Mainz, Frankfurt am Main, Germany, 5Dr. Senckenberg Institute of Neurooncology, University Hospital Frankfurt, Goethe University, Frankfurt am Main, Germany, 6Department of Neurosurgery, University Hospital Frankfurt, Goethe University, Frankfurt am Main, Germany
Synopsis
Keywords: Tumors, Spectroscopy
Glutamate metabolism plays a significant role in glioma invasion and growth and may lead to glioma-associated epileptic discharges and excitotoxicity. In in vivo MR spectroscopy, the molecular similarity of glutamate and glutamine results in overlapped, hence indistinguishable, spectral peaks and hinders their quantification. Here, we propose the use of J-modulation at optimum echo time for accurate and separate quantification of glutamate and glutamine. To study the reproducibility of this approach, in vivo MRSI sLASER measurement at 120 ms echo time was evaluated in three healthy subjects in two separate sessions, and the findings are reported.
Introduction
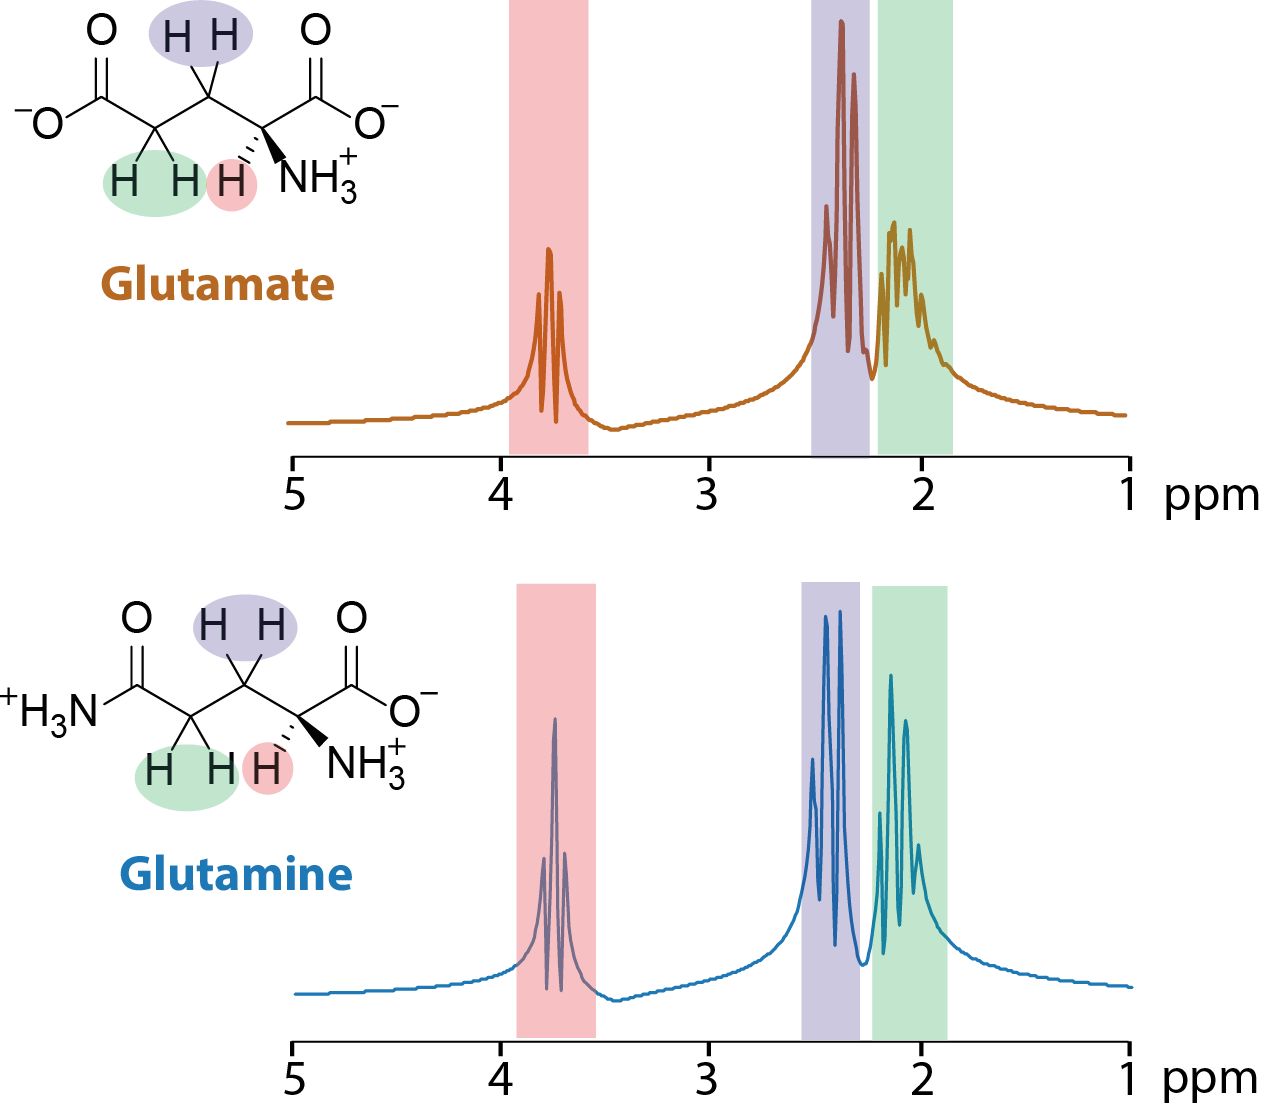
Diffuse gliomas comprise a group of primary brain tumors characterized by local as well as distant infiltration of brain tissue.1 A key metabolite promoting glioma infiltration and growth is glutamate (Glu) which serves as a neurotransmitter as well as an energy source and building block for biomolecules.2 Extracellular Glu levels in the glioma microenvironment are up to 100-times higher than in normal brain tissue, stimulating glioma cell proliferation and infiltration.2-4 In addition, they may lead to glioma-associated epileptic discharges and excitotoxicity.5-6In in vivo MR spectroscopy, short echo times (TE) are commonly used to detect metabolites with strong coupling such as glutamate. However, the molecular structure similarity of Glu and glutamine (Gln) results in overlapped, hence indistinguishable, spectral peaks (Figure 1).7 Therefore, the sum of Glu and Gln, often referred to as Glx in the literature, has been quantified in most studies, especially when performed at 3 T. In addition, tumor spectra exhibit elevated macromolecular (MM) signals at short TE resulting in an a priori unknown baseline modulation which hampers the quantification of Glu.8 Here we propose the use of longer TE to reduce the MM signal while aiming at the optimum TE to provide distinguishable spectral patterns of Glu and Gln by taking advantage of the J-modulation.
Methods
Data acquisition was performed on a clinical whole-body 3T MR Scanner using a 20 channel 1H head coil. For the phantom studies, a bottle containing phosphate-buffered saline with 20mM Glu, 20mM Gln, and 10mM Cr (pH = 7.1) was prepared. 1H spectra of the phantom were acquired using an MRSI sLASER sequence with various TE (100-140 ms) (see other parameters below). A brain-mimicking-phantom was prepared with 3 mM choline, 10 mM creatine (Cr), 10 mM Glu, 5 mM Gln, 3mM glutathione (GSH), 2 mM GABA, 7.5 mM myo-inositol (m-ino), 5mM lactate (Lac), and 12.5 mM N-acetyl-aspartate (NAA) in phosphate-buffered saline (pH = 7.2). 1H spectra of the phantom were acquired using an MRSI sLASER sequence at TE= 40 and 120 ms.Three healthy participants (mean age=30.3±0.6 years) were recruited. The scanning protocol included the following sequences: a T2 weighted turbo spin echo (TSE) in the axial plane (2.5 min), a 3D T1-weighted gradient echo (4 min), as well as an MRSI sLASER (TR = 3 s; TE = 120ms; 2 kHz receiver bandwidth; 2048 data points; 3 averages, 10 min). In healthy volunteers, the spectroscopic region of interest (ROI) was placed in the frontal-parietal lobes, with 32x32 matrix size at 200x200 mm2 field of view and 20 mm slice thickness. Each participant completed two sessions with a short break (approximately 15 minutes) between sessions. During the break, the participant left the scanner. Differences in Glu/Gln levels between the two scan sessions were assessed via one-way ANOVA with main effect of sequence (significance set at p<0.05). Reproducibility between sessions was assessed via mean coefficient of variation (in %) and Bland-Altman analysis.
Spectral simulations were performed with NMRScope implemented in jMRUI calculating a 2048-point free induction decay at 2000 Hz spectral width. Basis sets (NAA, Cho, Cr, Glu, Gln, GSH, GABA, and Lac) were created for various echo times. Analysis of the spectra was also done with jMRUI using the QUEST (Quantitation Based on Quantum Estimation) algorithm.
Results
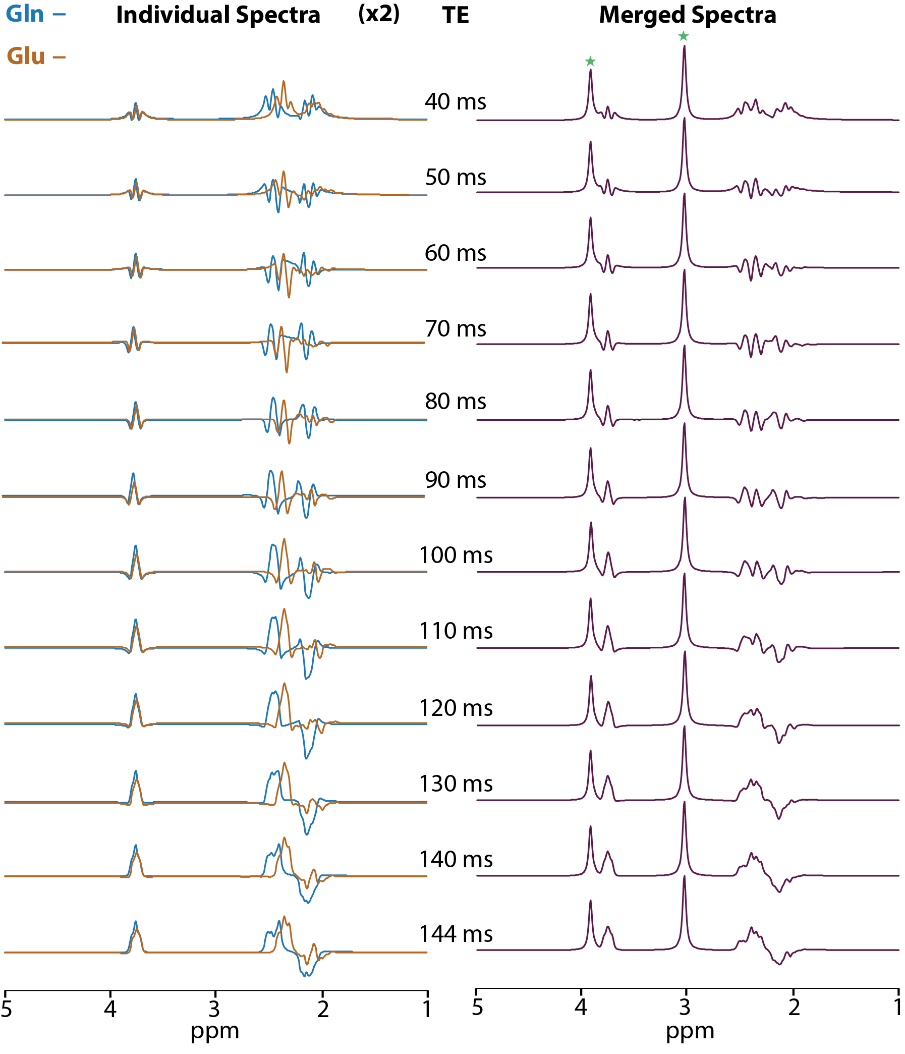
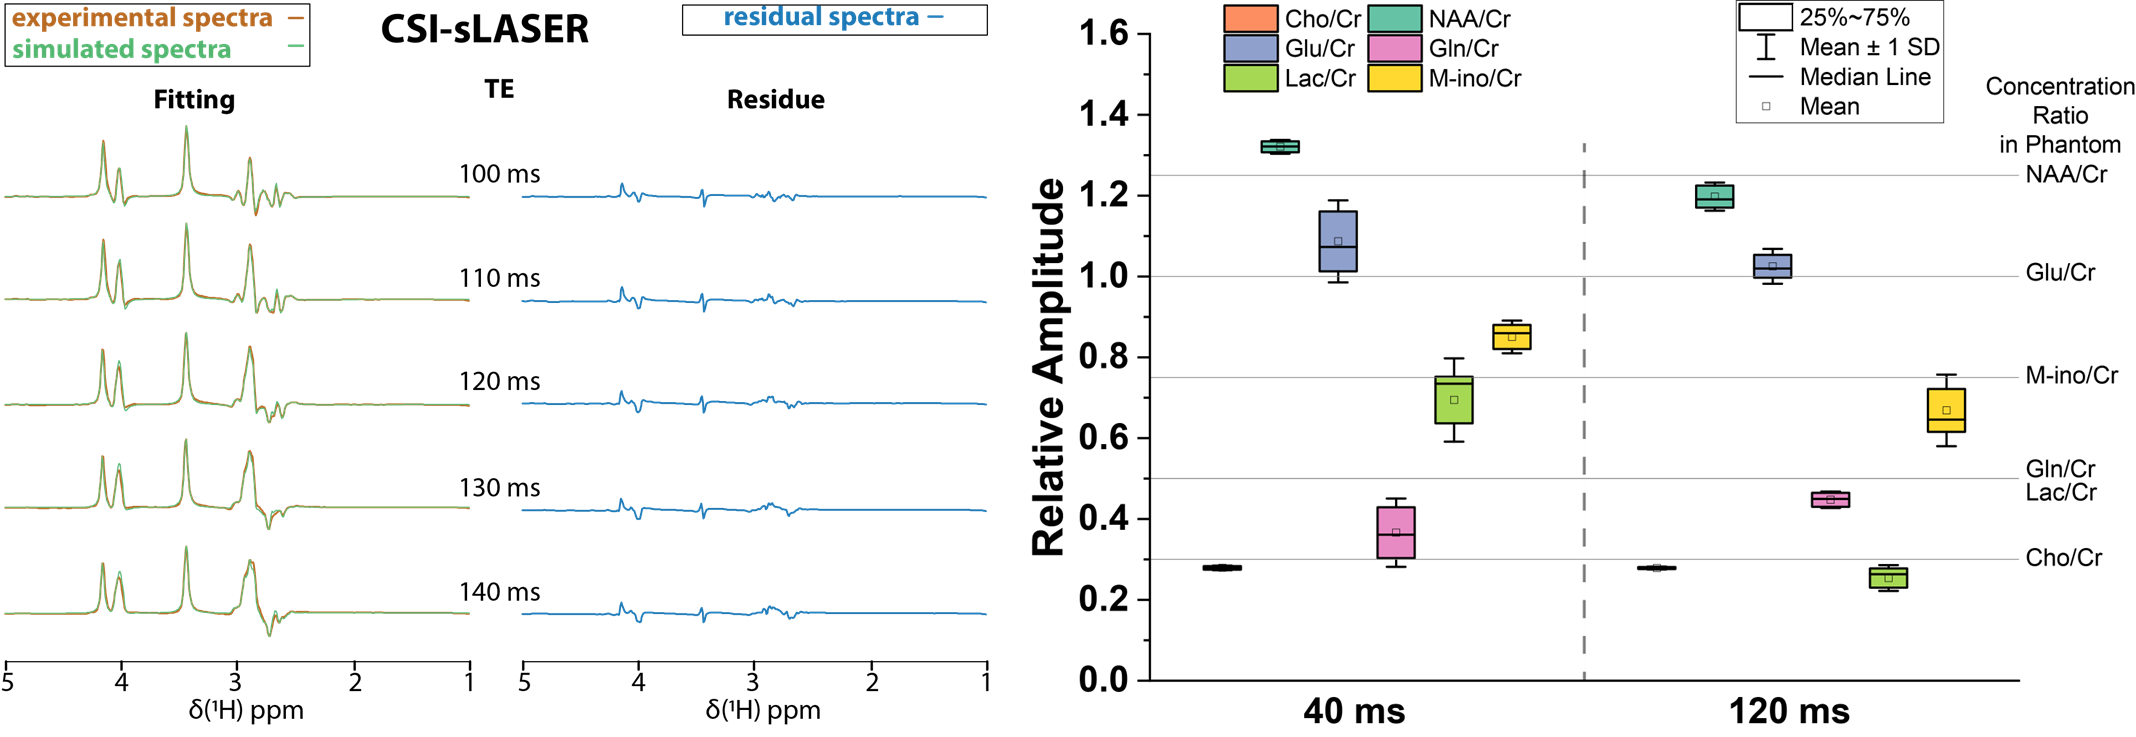
The simulated spectra of Glu and Gln for various TE values showed that signal dephasing under J-evaluation results in distinguishable spectral patterns for Glu and Gln (Figure 2). Specifically, at 120 ms, the spectral pattern from Gln between 2 and 2.5 ppm consists of in-phase and anti-phase signals while the anti-phase signal is missing in Glu. The presence of such distinct patterns holds great promise for a separate Glu/Gln quantification using a spectral fitting approach.To investigate the accuracy of Glu/Gln quantification, Glu/Gln/Cr phantom experiments were performed. As presented in Figure 3 on the left panel, a good visual agreement between phantom measurements and simulations is observed with minimal residual spectra. This was confirmed in the brain-mimicking-phantom measurements, which show a lower variability of Glu and Gln quantification using 120 ms echo time compared to 40 ms while allowing to quantify other metabolites (NAA, Cho, Lac) as well (Figure 3, right panel). Correction for T2 relaxation of metabolites during long echo time revealed mean values which matched the concentrations in the phantom.
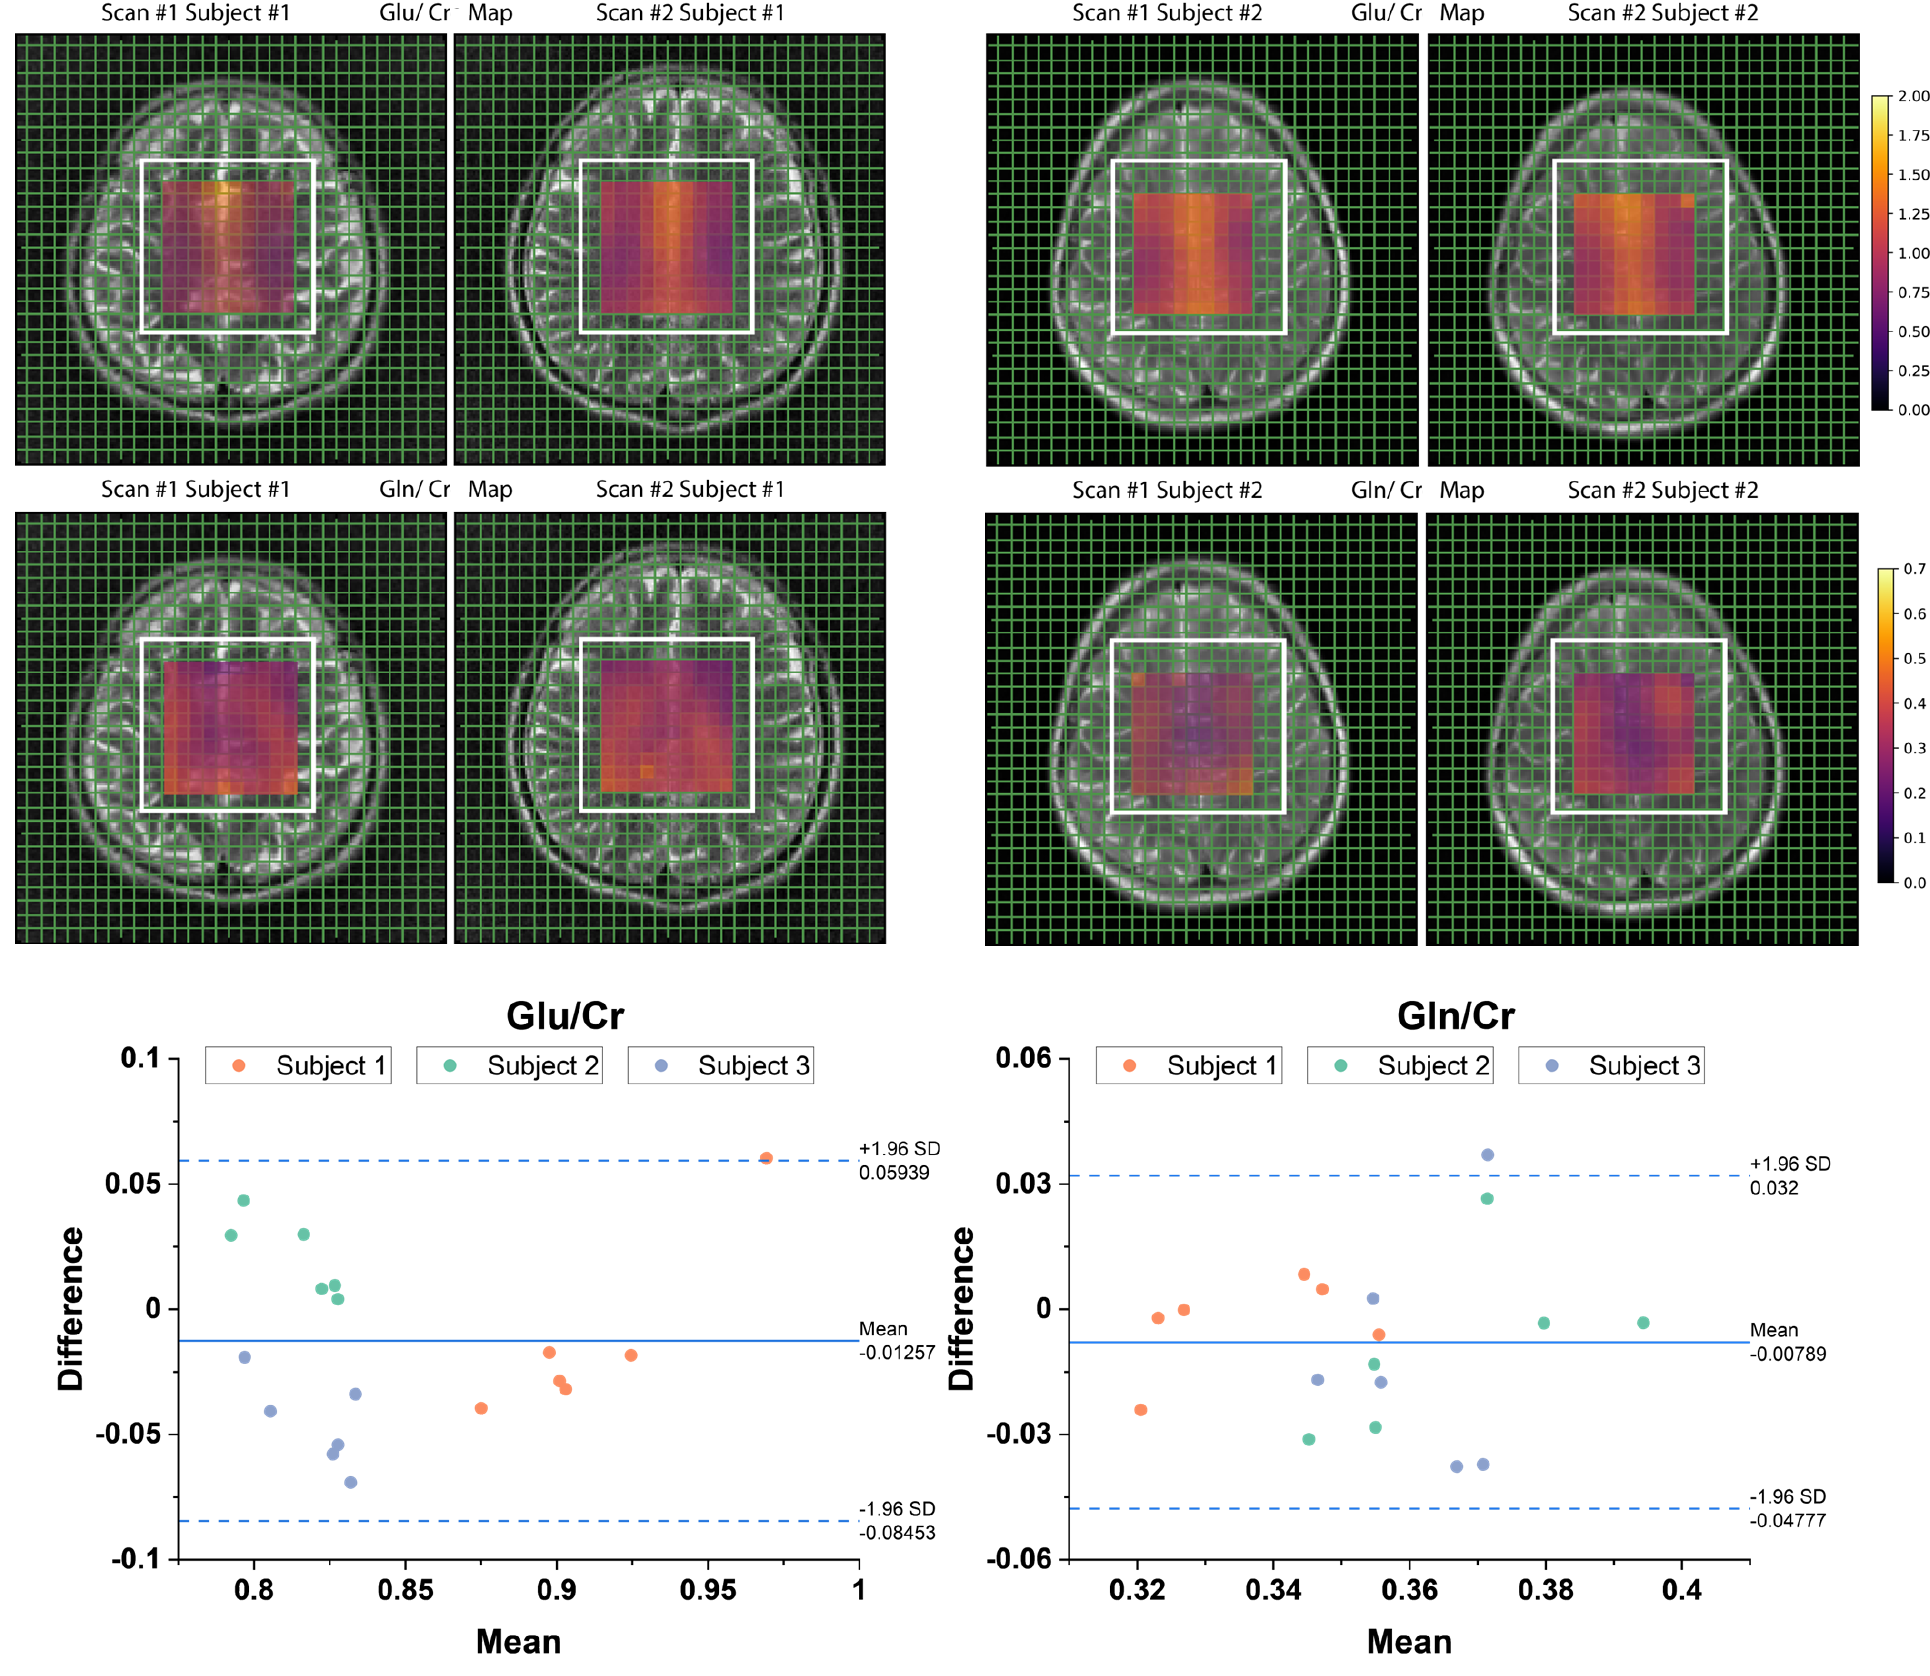
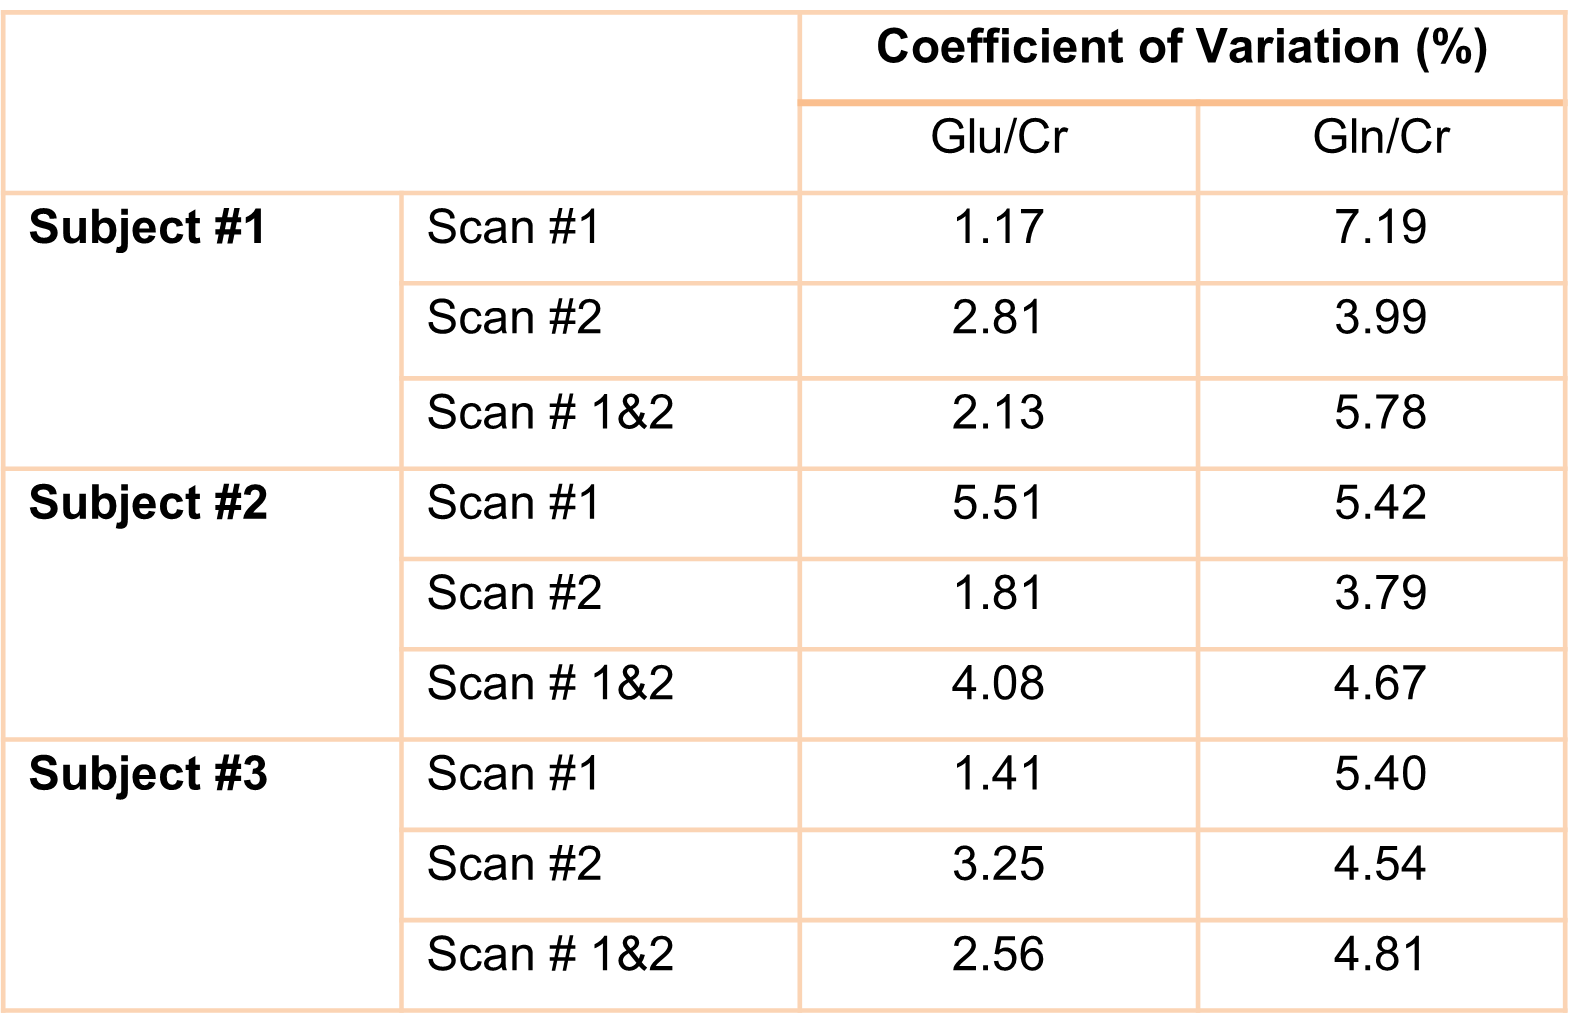
To study the repeatability of this approach, in vivo MRSI sLASER measurement at TE of 120 ms was evaluated in three healthy subjects in two sessions each. While there was no significant difference between the scan and re-scan sessions, similar patterns were observed in Glu/Cr and Gln/Cr maps (Figure 4). Additionally, overall low coefficients of variation (<10%) were obtained within each scan and between scan and re-scan showing the low variability of Glu/Cr and Gln/Cr values between measurements (Table 1).
Discussion
This study shows the potential of long-echo time to distinguish and quantify Glu and Gln metabolites which are particularly important to investigate glioma-induced epilepsy. Even though further evaluations are required, the presented results confirm the use of J-modulation in long echo time (120 ms) might allow to distinguish overlapping peaks based on the specific evolved spectral patterns.Acknowledgements
KJW and SA were funded by the Mildred Scheel Career Center Frankfurt (Deutsche Krebshilfe).References
1. Demuth, T. & Berens, M. E. Molecular Mechanisms of Glioma Cell Migration and Invasion. J Neurooncol 70, 217–228 (2004).
2. Karmur, B. S. et al. Blood-Brain Barrier Disruption in Neuro-Oncology: Strategies, Failures, and Challenges to Overcome. Front. Oncol. 10, 563840 (2020).
3. Takano, T. et al. Glutamate release promotes growth of malignant gliomas. Nat Med 7, 1010–1015 (2001).
4. Ishiuchi, S. et al. Ca2+-Permeable AMPA Receptors Regulate Growth of Human Glioblastoma via Akt Activation. Journal of Neuroscience 27, 7987–8001 (2007).
5. Buckingham, S. C. et al. Glutamate release by primary brain tumors induces epileptic activity. Nat Med 17, 1269–1274 (2011).
6. Yuen, T. I. et al. Glutamate is associated with a higher risk of seizures in patients with gliomas. Neurology 79, 883–889 (2012).
7. Ramadan, S., et al. Glutamate and glutamine: a review of in vivo MRS in the human brain. NMR in biomedicine 26, 1630–1646 (2013).
8. Gajdošík, M., et al. Hippocampal single-voxel MR spectroscopy with a long echo time at 3 T using semi-LASER sequence. NMR in biomedicine 34, e4538 (2021).
Figures