2316
Functional mapping in gliomas: a comparison between presurgical resting-state fMRI and intraoperative Direct Electrical Stimulation
Manuela Moretto1, Beatrice Federica Luciani1, Francesca Saviola1, Stefano Tambalo1, Luca Zigiotto2,3, Donna Gift Cabalo1,4, Luciano Annicchiarico2,3, Martina Venturini2,3, Silvio Sarubbo2,3, and Jorge Jovicich1
1Center for Mind/Brain Sciences (CIMeC), University of Trento, Trento, Italy, 2Department of Neuroscience, Division of Neurosurgery, S.Chiara Hospital, APSS Trento, Trento, Italy, 3Structural and Functional Connectivity Lab, S.Chiara Hospital, APSS Trento, Trento, Italy, 4Multimodal Imaging and Connectome Analysis Laboratory, McConnell Brain Imaging Centre, Montreal Neurological Institute and Hospital, McGill University, Montreal, QC, Canada
1Center for Mind/Brain Sciences (CIMeC), University of Trento, Trento, Italy, 2Department of Neuroscience, Division of Neurosurgery, S.Chiara Hospital, APSS Trento, Trento, Italy, 3Structural and Functional Connectivity Lab, S.Chiara Hospital, APSS Trento, Trento, Italy, 4Multimodal Imaging and Connectome Analysis Laboratory, McConnell Brain Imaging Centre, Montreal Neurological Institute and Hospital, McGill University, Montreal, QC, Canada
Synopsis
Keywords: Tumors, fMRI (resting state), Brain Connectivity
Resting-state functional MRI (rs-fMRI) has been proposed as a non-invasive technique for the presurgical mapping of functional networks, in contrast to intraoperative Direct Electrical Stimulation (DES) mapping. While previous studies have investigated the agreement between a predefined DES atlas and resting-state networks in low-grade glioma patients, here we exploit patient-specific DES points and the ReStNeuMap tool to investigate the agreement between sensorimotor, language and speech-articulation networks in a cohort of high- and low-grade glioma patients. We found a good overlap between ReStNeuMap-derived networks and DES points, while low spatial similarity between networks and functional connectivity maps derived from DES.Introduction
The major goal in brain tumor surgical planning is to preserve eloquent regions and structural connections while removing most of the tumoral tissue1. Intraoperative Direct Electrical Stimulation (DES) is the gold-standard to identify eloquent regions for preventing damages to functional areas underlying major cognitive functions2,3,4. However, only few cognitive domains and cortical sites can be tested with DES and their localization might be inaccurate given the influence of remote areas’ stimulation due to cortico-cortical connections5,6. Alternatively to DES mapping, information on the localization of functional networks can be derived preoperatively from non-invasive fMRI. Although task-based fMRI is the method of choice for presurgical mapping protocol7, in recent years rs-fMRI has shown potential to increase the translation of fMRI into the clinical routine7, since it does not require patient’s cooperation in performing specific tasks.In this context, ReStNeuMap, an open-access tool, has been developed8 and further improved9 to help clinicians with automatic preoperative mapping of resting-state networks.
In this study, by employing a cohort of glioma patients, we evaluate, at single patient-level, the spatial agreement between resting-state networks derived non-invasively from ReStNeuMap and functional networks derived from invasive DES mapping during brain surgery.
Methods
Presurgical data of 28 patients with high-grade glioma (HGG) or low-grade glioma (LGG) (Fig.1), who underwent awake surgery at the Department of Neurosurgery of Santa Chiara Hospital, Trento (Italy), were acquired at the Department of Radiology of Santa Chiara Hospital with a 1.5T GE Healthcare MRI scanner.The acquisition protocol included a 3D T1-weighted inversion recovery gradient echo image (TR=10.08ms, TE=4.28ms, voxel resolution=0.5x0.5x1mm3, FA=12°, FOV=264x264mm2) and rs-fMRI scans acquired with a 2D T2*-weighted gradient-echo echo-planar imaging sequence (TR=2600ms, TE=45ms, voxel resolution=4x4x4mm3, FA=87°, FOV=256×256mm2, acceleration factor ASSET=2).
Rs-fMRI raw data were processed with an improved version of the ReStNeuMap toolbox8,9 (Fig.2). In brief, after standard pre-processing, probabilistic independent component analysis (ICA) followed by functional atlas10 matching, using cross-correlation as metric to select the best IC, was performed. Thus, for each patient, ICs belonging to sensorimotor (SMN), language (LANG) and speech-articulation (SAN) networks were obtained.
DES coordinates were collected for each patient during awake surgery and projected onto a post-surgical T1w image. To compare DES coordinates with ReStNeuMap-derived ICs maps, DES coordinates were resampled in the rs-fMRI space. Patient-specific DES coordinates (Fig.1) were grouped into three functional domains: sensorimotor, language and speech-articulation.
Spherical ROIs with a 4mm radius and centered at each DES (DESROIs) coordinate were created. The normalized spatial overlap (range: [0-1]) between the ReStNeuMap-derived ICs belonging to SMN, LANG and SAN and the corresponding DESROI were computed at patient level as follows:
NORMALIZED OVERLAP=(ReStNeuMap-derived IC ⋂ DESROI)/(DESROI)
Moreover, for each patient, a spherical ROI of 10mm radius was placed in each DES coordinate. Functional connectivity (FC) map was then obtained by computing Pearson's correlation between the DESROI-time course and the time courses of all other voxels. DESROI derived-FC maps were then converted to z-maps using Fisher’s transformation and thresholded with a conservative threshold of 0.5. Finally, the Sorensen-DICE11 coefficient was computed to evaluate the spatial similarity between DESROI derived-FC maps and ReStNeuMap-derived ICs.
Results
Regarding ReStNeuMap functional atlas matching, we obtained an averaged cross-correlation across patients of 0.52 for the SMN, 0.56 for the LANG and 0.52 for the SAN.The normalized spatial overlap computed between ReStNeuMap-derived ICs and DESROIs resulted 0.61±0.32 for sensorimotor functional domain, 0.23±0.23 for language domain and 0.46±0.3 for speech-articulation domain (Fig.3). When we looked at the two groups of patients separately, we observed a slight increase in the averaged normalized overlap for LGG compared to HGG in sensorimotor and speech-articulation domains. However, no statistically significant differences between LGG and HGG were found.
The DICE coefficient computed between DESROI derived-FC maps and ReStNeuMap-derived ICs resulted 0.29±0.18 for sensorimotor functional domain, 0.06±0.03 for language domain and 0.23±0.17 for speech-articulation domain (Fig.4).
Discussion
The spatial agreement between rs-fMRI networks detected pre-surgically and intraoperative DESROIs was greater for sensorimotor and speech-articulatory domains than for the language domain. This result is in line with a previous study of our group12 in which the coherence between DES points and ROIs from a predefined DES atlas13,14 was lower for anomia domain than for all other cognitive domains. Moreover, in our sample, language DES coordinates were collected only for 9 patients out of 28.Regarding the connectivity analysis, we obtained low DICE values, especially for language DES. One possible explanation is that, while DESROI derived-FC maps are representative of the entire language network, ReStNeuMap-derived ICs might represent subcomponents of the entire network, which is also subject to IC splitting.
Conclusion
Employing 28 glioma patients and 80 DES points, we demonstrate good spatial agreement between cortical regions of eloquent areas defined invasively (using DES during awake surgery) and presurgical intrinsic functional networks (sensorimotor, language and speech-articulation) identified non-invasively with ReStNeuMap. The results need extended validation on larger samples, but support the use of intrinsic connectivity mapping for presurgical mapping in both HGG and LGG patients to guide brain surgery, especially when awake surgery is not possible.Acknowledgements
This project was supported by the Autonomous Province of Trento, Italy (Project: "NeuSurPlan and integrated approach to neurosurgery planning based on multimodal data"), the Fondazione Paolina Lucarelli Irion, Rovereto (Trento), Italy, and the Dipartimento di Eccellenza project 2018-2022 (Italian Ministry of Education, University and Research).
This work was supported by the project "Towards a reliable artificial intelligence to support decisions" (AI@TN: A proposal from the Trentino Research and Innovation System), financed by the Autonomous Province of Trento, Italy.
References
- Ghinda DC, Wu J-S, Duncan NW, Northoff G. How much is enough—Can resting state fMRI provide a demarcation for neurosurgical resection in glioma? Neuroscience & Biobehavioral Reviews, 2018; 84, 245–261.
- Duffau H, Capelle L, Denvil D, Sichez N, Gatignol P, Taillandier L, van Effenterre R. Usefulness of intraoperative electrical subcortical mapping during surgery for low-grade gliomas located within eloquent brain regions: functional results in a consecutive series of 103 patients. Journal of neurosurgery, 2003; 98(4), 764-778.
- Pendleton C, Zaidi HA, Chaichana KL, Raza SM, Carson BS, Cohen-Gadol AA, Quinones-Hinojosa A. Harvey Cushing’s contributions to motor mapping: 1902–1912. 2012; Cortex, 48(1), 7–14.
- Sarubbo S, Le Bars E, Moritz-Gasser S, Duffau H. Complete recovery after surgical resection of left Wernicke's area in awake patient: a brain stimulation and functional MRI study. Neurosurgical review, 2012; 35(2), 287-292.
- Castellanos FX, Di Martino A, Craddock RC, Mehta AD, Milham MP. Clinical applications of the functional connectome. NeuroImage, 2013; 80, 527–540.
- Sinai A, Bowers CW, Crainiceanu CM, Boatman D, Gordon B, Lesser RP, Lenz FA, Crone NE. Electrocorticographic high gamma activity versus electrical cortical stimulation mapping of naming. Brain, 2015; 128(7), 1556–1570.
- Volz LJ, Kocher M, Lohmann P, Shah NJ, Fink GR, Galldiks N. Functional magnetic resonance imaging in glioma patients: from clinical applications to future perspectives. Q J Nucl Med Mol Imaging, 2018; 62(3):295-302.
- Zacà D, Jovicich J, Corsini F, Rozzanigo U, Chioffi F, Sarubbo S. ReStNeuMap: a tool for automatic extraction of resting-state functional MRI networks in neurosurgical practice. Journal of Neurosurgery JNS, 2019; 131(3), 764-771.
- Cabalo DG, Saviola F, Tambalo S, Luciani B., Zacà D, Zigiotto L, Sarubbo S, Jovicich J. Automated identification of key resting-state fMRI networks in preoperative glioma patients. Organization of Human Brain Mapping - Annual 2021 Meeting, Abstract 2673.
- Shirer WR, Ryali S, Rykhlevskaia E, Menon V, Greicius MD. Decoding Subject-Driven Cognitive States with Whole-Brain Connectivity Patterns. Cerebral Cortex, 2012; 22:158-165.
- Sørensen T. A method of establishing groups of equal amplitude in plant sociology based on similarity of species and its application to analyses of the vegetation on Danish commons. Kongelige Danske Videnskabernes Selskab, 1948; 5:1–34.
- Sarubbo S, Annicchiarico L, Corsini F, Zigiotto L, Herbet G, Moritz-Gasser S, Avesani P. Planning brain tumor resection using a probabilistic atlas of cortical and subcortical structures critical for functional processing: a proof of concept. Operative Neurosurgery, 2021; 20(3), E175-E183.
- Sarubbo S, Tate M, De Benedictis A, et al. A normalized dataset of 1821 cortical and subcortical functional responses collected during direct electrical stimulation in patients undergoing awake brain surgery. Data Brief, 2019; 28:104892.
- Sarubbo S, Tate M, De Benedictis A, Merler S, Moritz-Gasser S, Herbet G, et al: Mapping critical cortical hubs and white matter pathways by direct electrical stimulation: an original functional atlas of the human brain. Neuroimage, 2020; 205:116237.
Figures
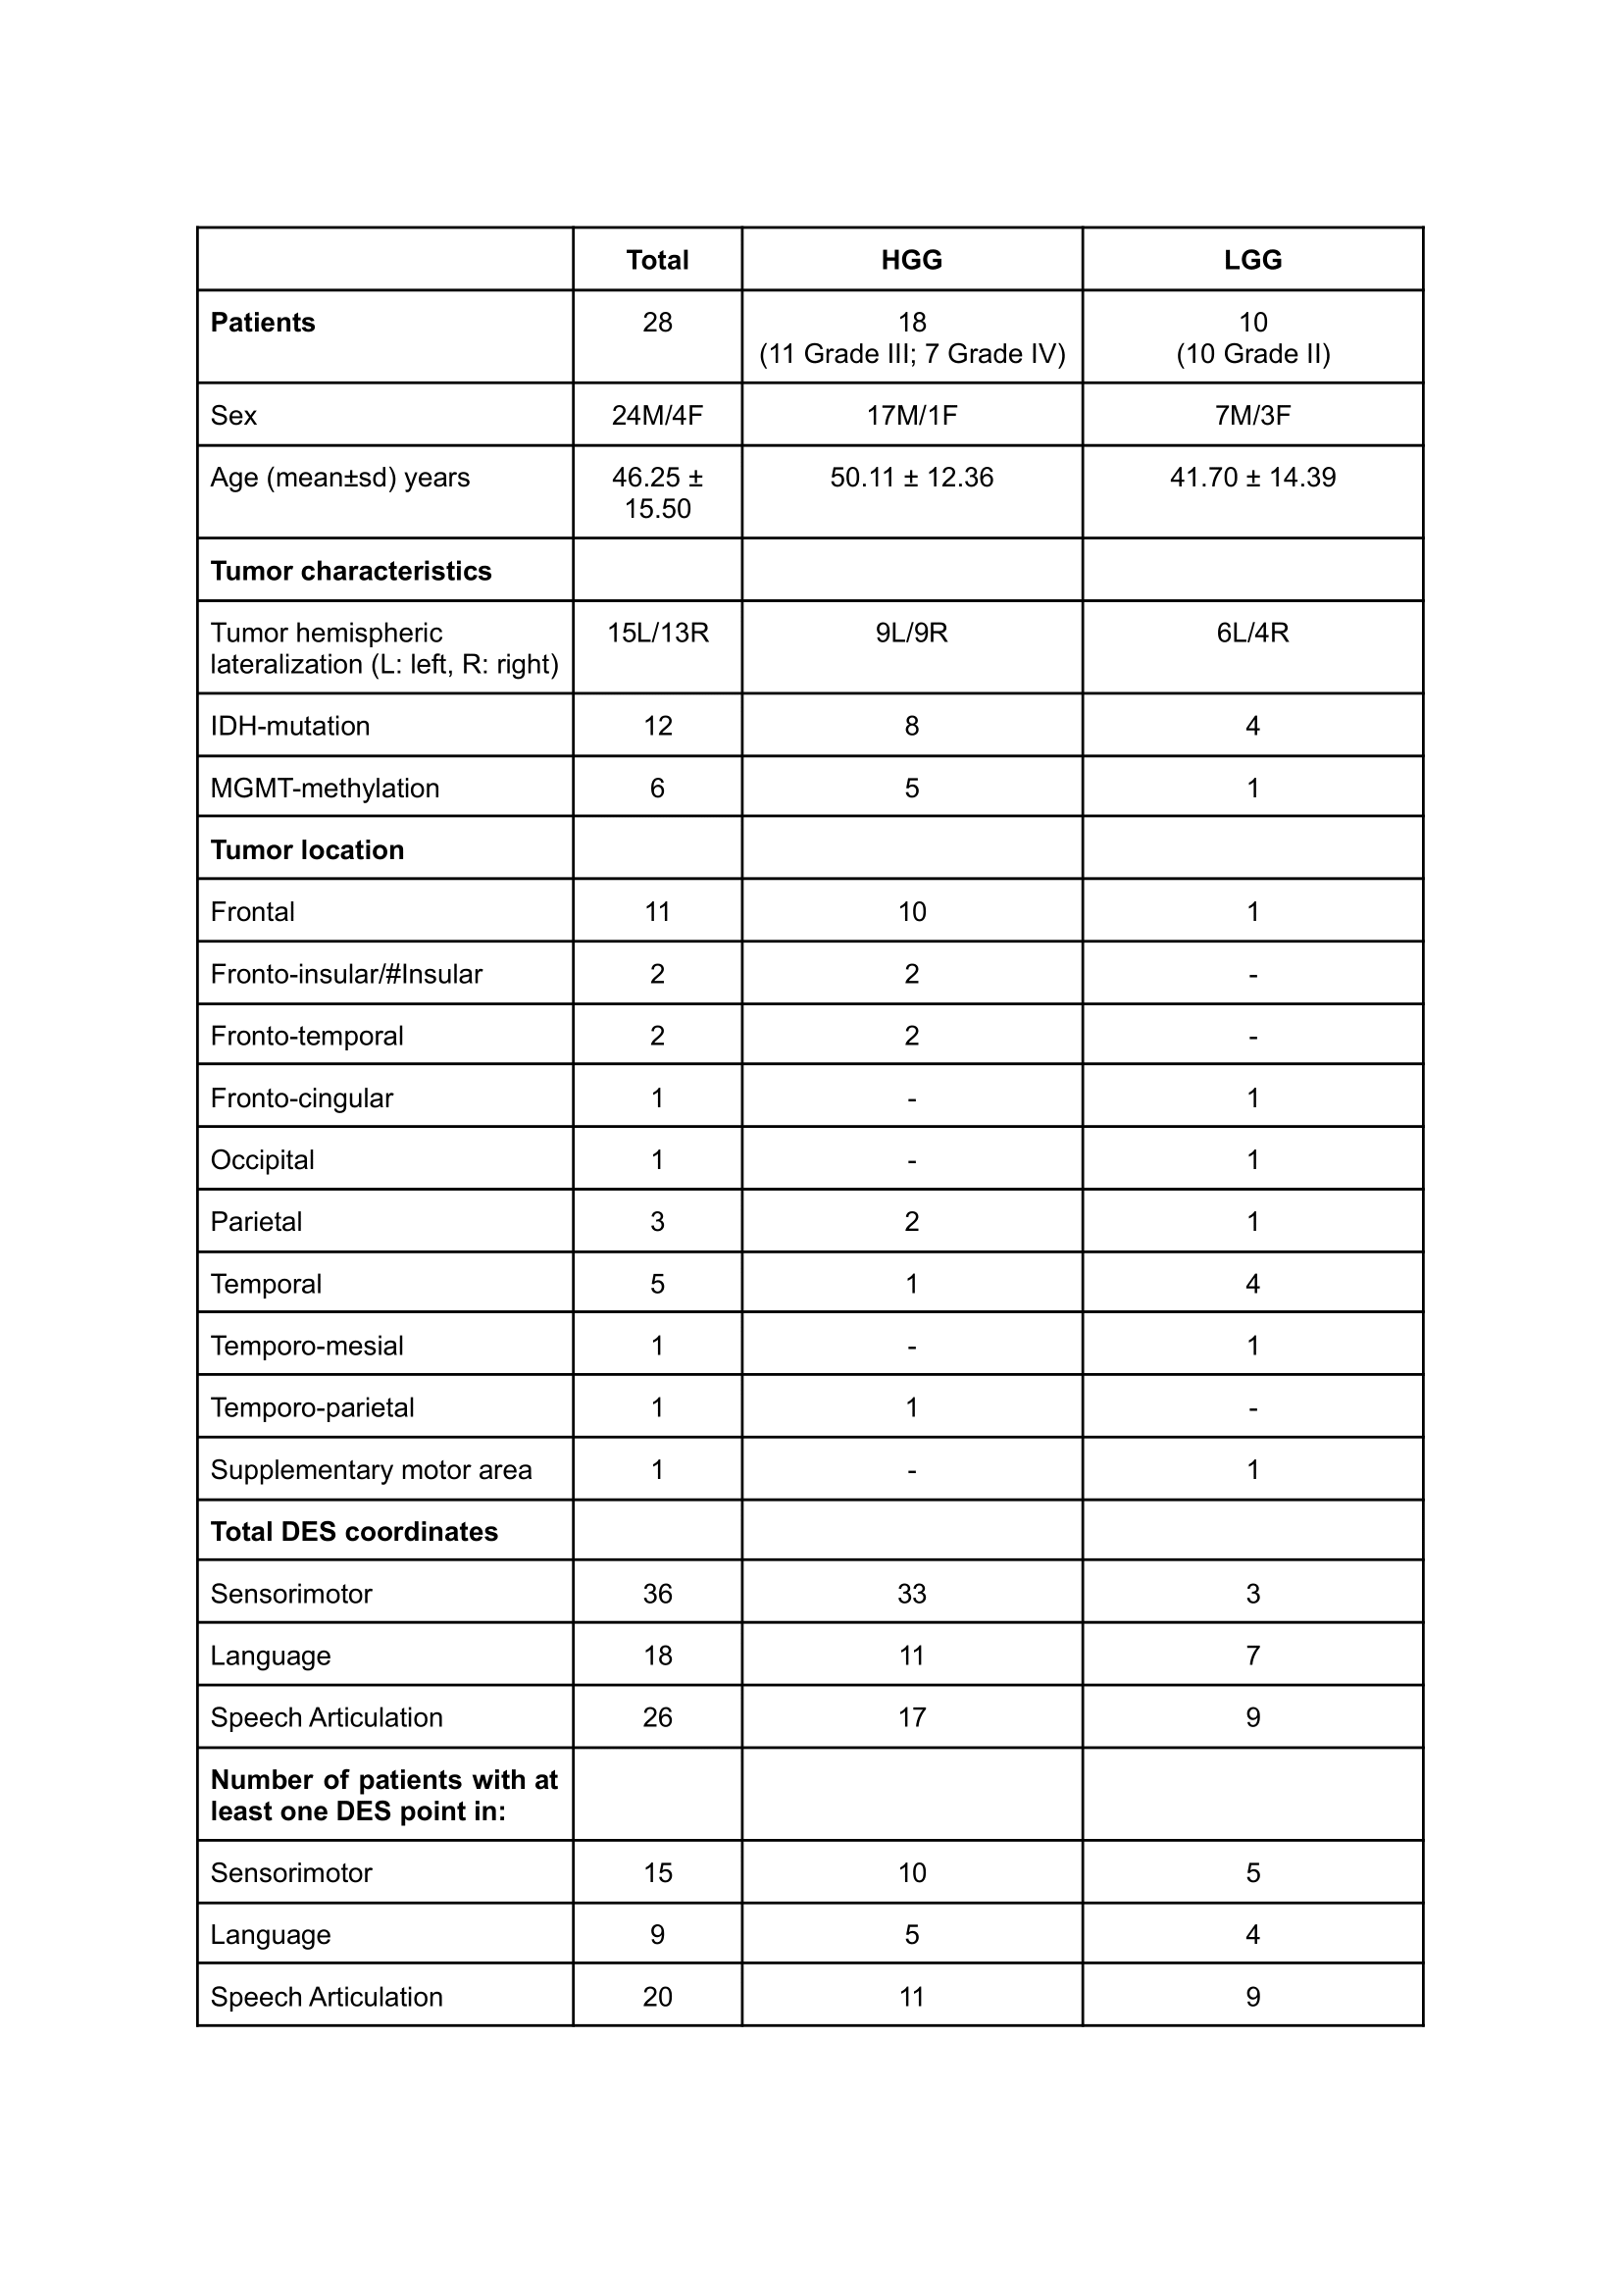
Demographic and clinical information of glioma patients included in this study, divided for high-grade gliomas (HGG) and low-grade gliomas (LGG).
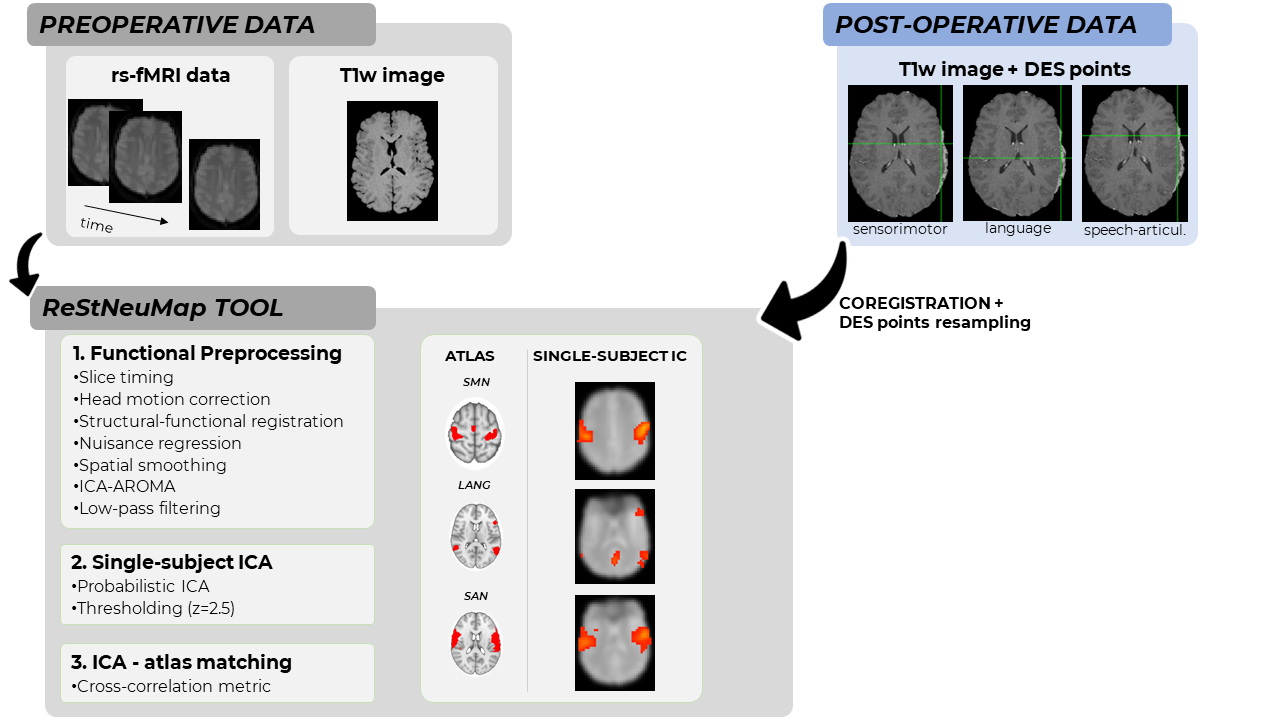
Schematic representation of the processing steps followed for this study.
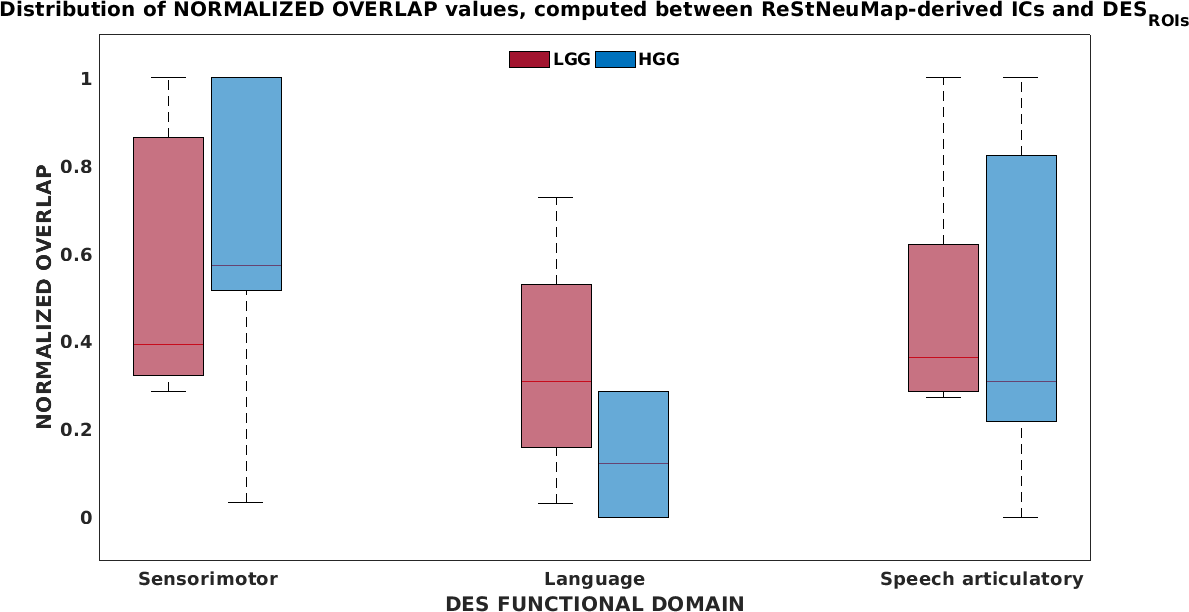
The distribution of the normalized overlap computed between ReStNeuMap-derived ICs and spherical ROIs centered at each DES coordinate (DESROIs) is reported in red for low-grade glioma (LGG) patients and in blue for high-grade glioma (HGG) patients. The solid line in each boxplot indicates the median.
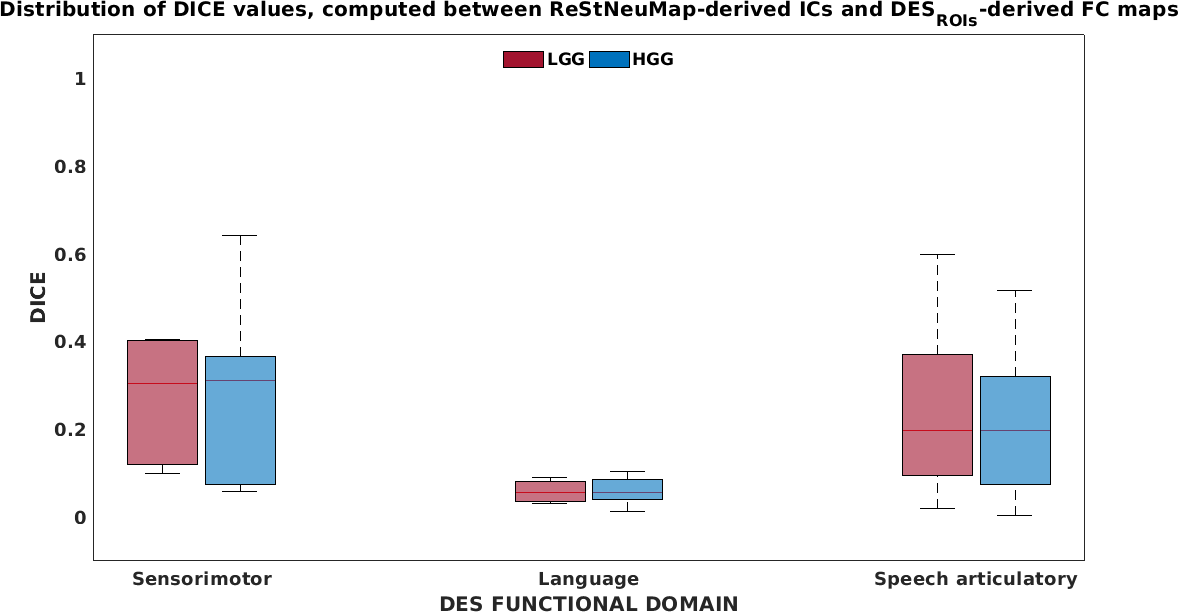
The distribution of the DICE coefficient computed between DESROI derived-FC maps and ReStNeuMap-derived ICs is reported in red for low-grade glioma (LGG) patients and in blue for high-grade glioma (HGG) patients. The solid line in each boxplot indicates the median.
DOI: https://doi.org/10.58530/2023/2316