2315
Relationship between electric conductivity, water content, and protein content in brain tumors1Philips Research Europe, Hamburg, Germany, 2Hokkaido University, Sapporo, Japan
Synopsis
Keywords: Tumors, Brain
Strong mutual relation is observed between tissue electrical conductivity, water content, and sodium concentration. However, it was recently reported that the relation between conductivity and water content might hold only for healthy tissue but be violated in tumors. It was furthermore reported that water content relates only to free sodium, while conductivity additionally relates also to sodium bound to proteins. A discrepancy between water content and conductivity might thus indicate protein concentration. The current study confirms this hypothesis by comparing the discrepancy between water content and conductivity with Amide Proton Transfer imaging as a marker of protein concentration.
Introduction
Tissue electrical conductivity, water content, and sodium concentration reveal a strong mutual relationship ("triangle of conductivity"). All these biomarkers can be mapped quantitatively and independently with MRI and can be compared to obtain additional diagnostic information. It was recently reported that the relation between conductivity and water content might hold only for healthy tissue but be violated in tumors 1. It was furthermore reported that water content relates only to free sodium, while conductivity additionally relates also to bound sodium, particularly sodium bound to proteins 2. A discrepancy between water-related conductivity and total conductivity could thus be an indicator of protein concentration, which is found particularly high in tumors. The current study evaluates this hypothesis by comparing the discrepancy between water-related conductivity and total conductivity with Amide Proton Transfer (APT) imaging 3 as a marker of protein concentration.Methods
To validate the approach, three meningioma patients of a study published earlier 4 were revisited. The patients were examined with a clinical 3T MR system (Achieva TX, Philips Medical Systems, Best, the Netherlands) performing a 3D SSFP sequence (TR/TE = 3.5 / 1.7 ms, flip angle = 25°, acquired voxel size = 1.3 × 1.2 × 1 mm3) and a 3D APT sequence (TR/TE = 8.3 / 5900 ms, acquired voxel size = 1.9 × 1.9 × 6 mm3, 9 saturation points with pulse strength 2 μT and duration 2 s). The phase of the SSFP image was used to derive electrical conductivity using “Electrical Properties Tomography” (EPT 4), and the magnitude of the SSFP images was used to estimate tissue water content 5. Water content maps were suitably scaled to obtain the water-related conductivity 6 and subtracted from the “total” conductivity measured by EPT, yielding a “normalized" conductivity to identify a potential discrepancy between these two quantities 1. A flow chart of this procedure is given in Fig.1.Previously published phantom results 7 were used to quantitatively relate normalized conductivity and APT signal (Fig. 2). Here, APT and EPT measurements have been performed on phantoms with different concentrations of proteins (represented by egg albumin), yielding an empirical conversion factor of q=0.115 m/S between APT signal and protein conductivity.
Results
Maps of total conductivity as measured with EPT, normalized conductivity, and APT are compared in Fig. 3 for the three patients examined. Normalized conductivity is close to zero in healthy appearing brain areas and larger than zero in pathological areas (please note the color scale narrower for normalized than for total conductivity maps in Fig. 3). Visual inspection reveals a congruence between normalized conductivity and APT-weighted images. The quantitative values of the normalized conductivity in the pathologic areas were of the order of 0.2-0.4 S/m. According to the conversion factor q derived from Fig. 2, this corresponds to an APT signal of 2.3-4.6 % in these areas, which is in line with the quantitative values measured. A larger artifact is visible in the normalized conductivity of patient 3, which might be explained by cardiac pulsation artefacts transferred to the CSF.Discussion and Conclusion
The results of this study confirm the hypothesis that differences in water-related conductivity and measured “total” conductivity arise from sodium bound to proteins, and thus indicate protein content similarly to APT maps. As the current study is based only on very few patients, a more systematic study shall further investigate the relation between normalized conductivity and APT. On one hand, the congruence between these two quantities would be of interest. The difference between these two quantities, on the other hand, might bear further information on protein configuration in tumors.Acknowledgements
The authors are very grateful that Stefano Mandija and Nico van den Berg shared their insights on water-EPT with them, which made this abstract possible.
References
1. Katscher U, Tha KK. Normalization of conductivity maps to support identification of pathologic areas. Proc. ISMRM 2022;30:3296.
2. Mandija S, de Bruin PW, Webb AG, et al. Investigating the relation between electrical conduction and tissue composition with proton and sodium MRI. Proc. ISMRM 2017;25:3639.
3. Zhou J, Zaiss M, Knutsson L, et al. Review and consensus recommendations on clinical APT-weighted imaging approaches at 3T: Application to brain tumors. Magn Reson Med. 2022;88(2):546-574.
4. Tha KK, Katscher U, Stehning C, et al., Electrical Conductivity Characteristics of Meningiomas: Noninvasive Assessment using Electric Properties Tomography. Proc. ISMRM 2015;23:4397.
5. Fatouros PP, Marmarou A, Kraft KA, et al. In vivo brain water determination by T1 measurements: effect of total water content, hydration fraction, and field strength, Magn Reson Med 1991;17(2):402-413.
6. Michel E et al., Electrical conductivity and permittivity maps of brain tissues derived from water content based on T1‐weighted acquisition. Magn Reson Med. 2017;77(3):1094-1103.
7. Tha KK, Katscher U, Kudo K, et al. Electric Properties Tomography: A New Tool for Noninvasive Measurement of Tissue Electrical Conductivity. Annual Meeting of RSNA. 2018; Chicago, USA, education exhibit.
Figures
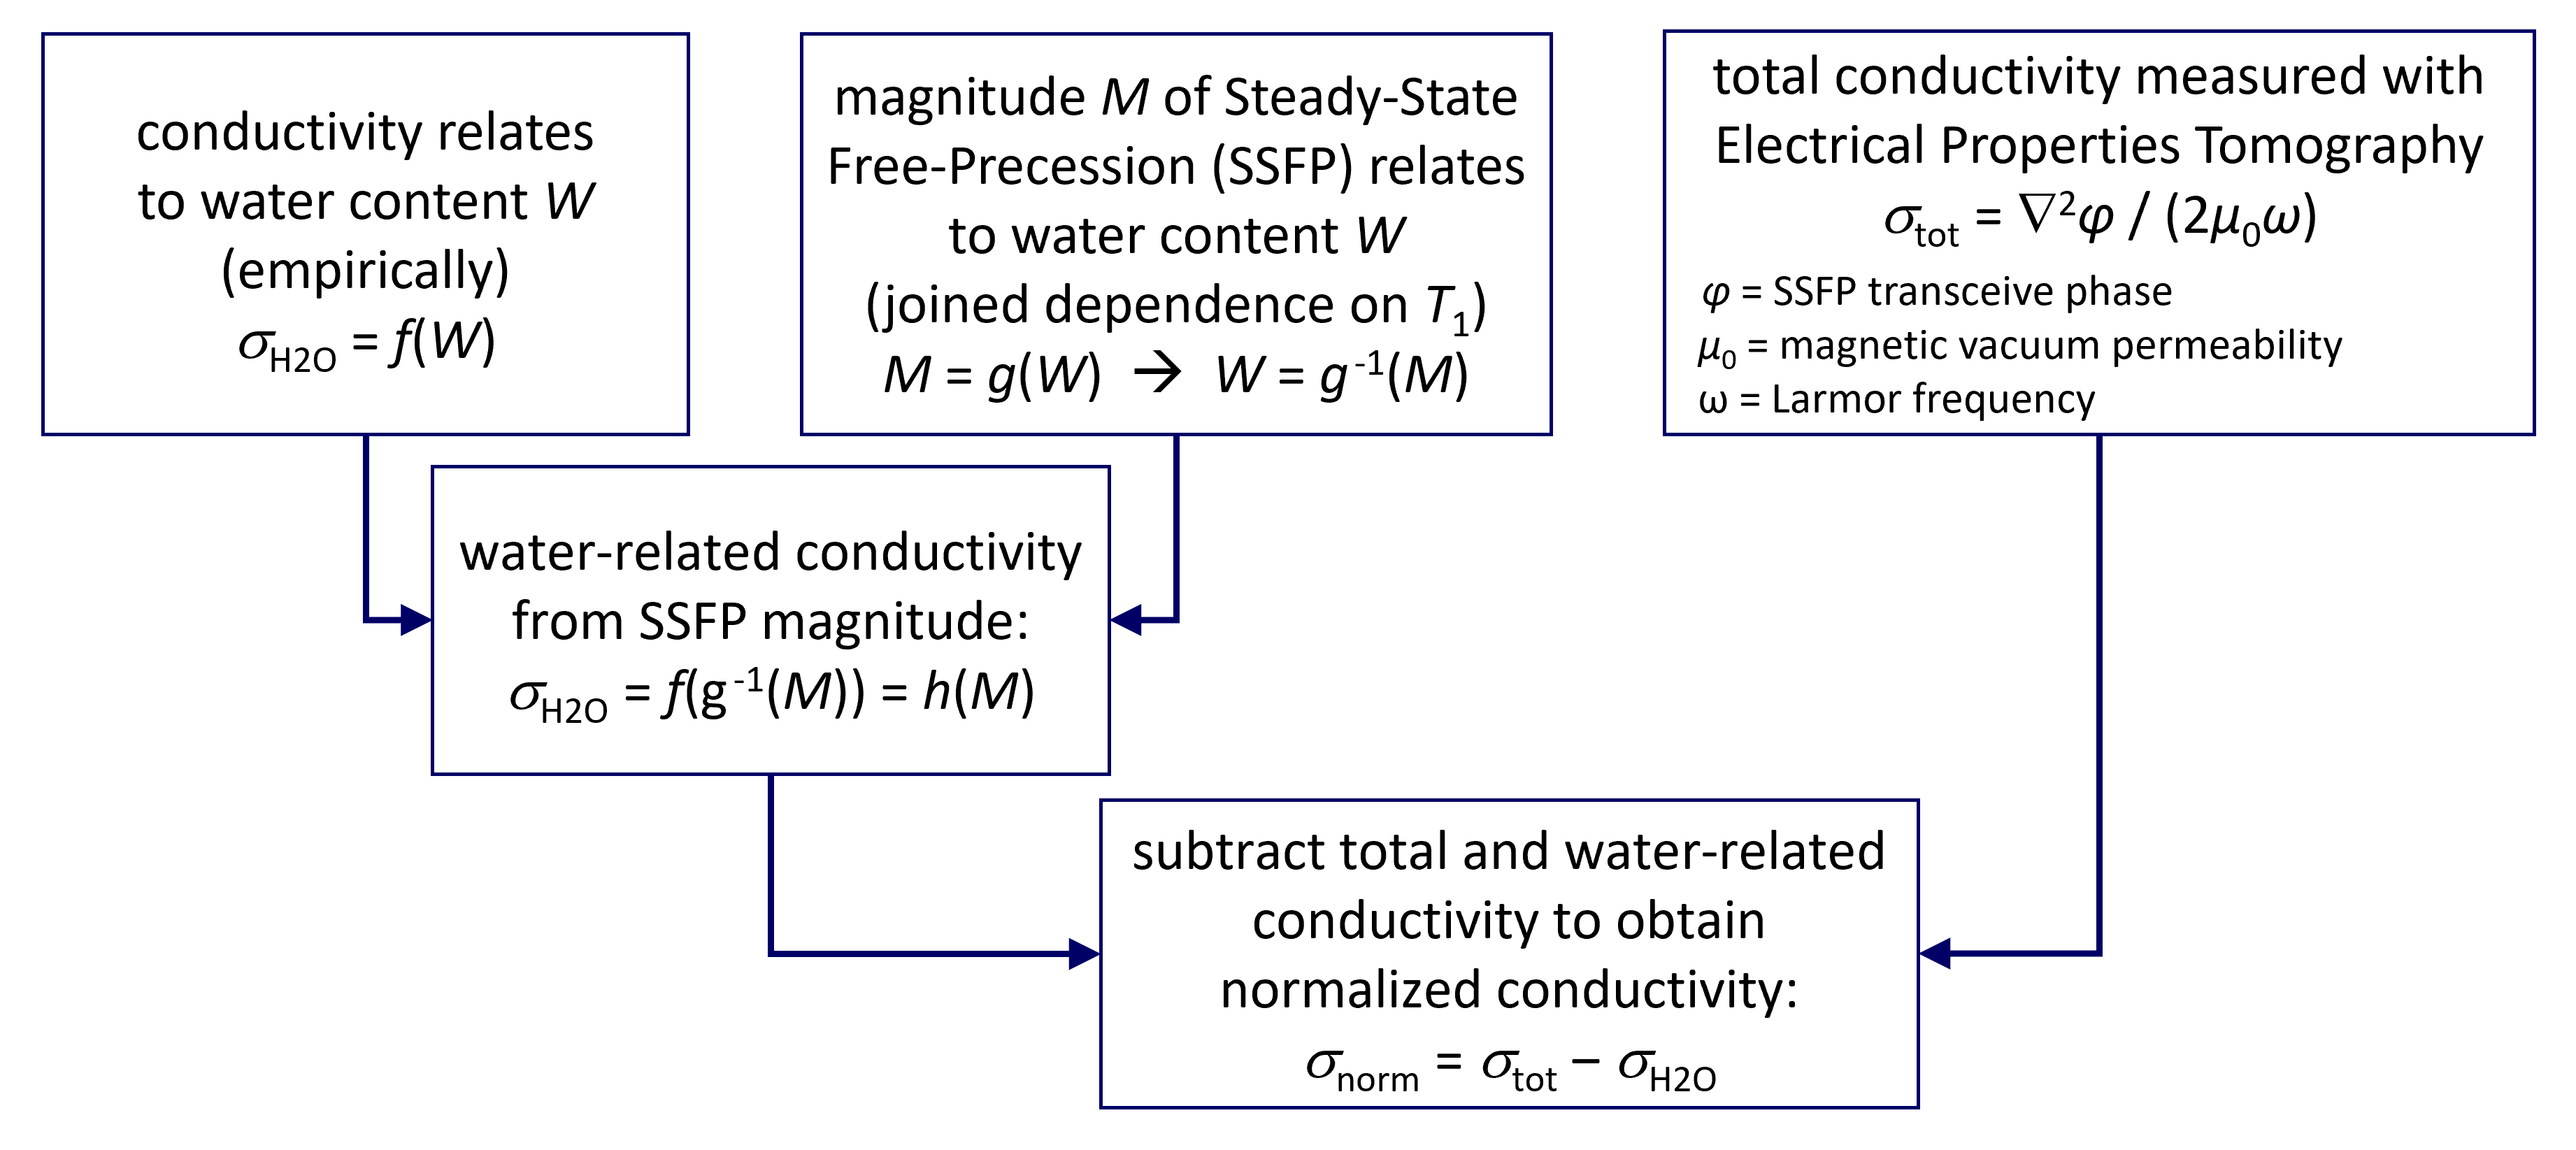
Fig. 1: Flow chart how to obtain normalized conductivity by subtracting water-related conductivity (estimated from SSFP magnitude) from total conductivity (derived from SSFP phase).
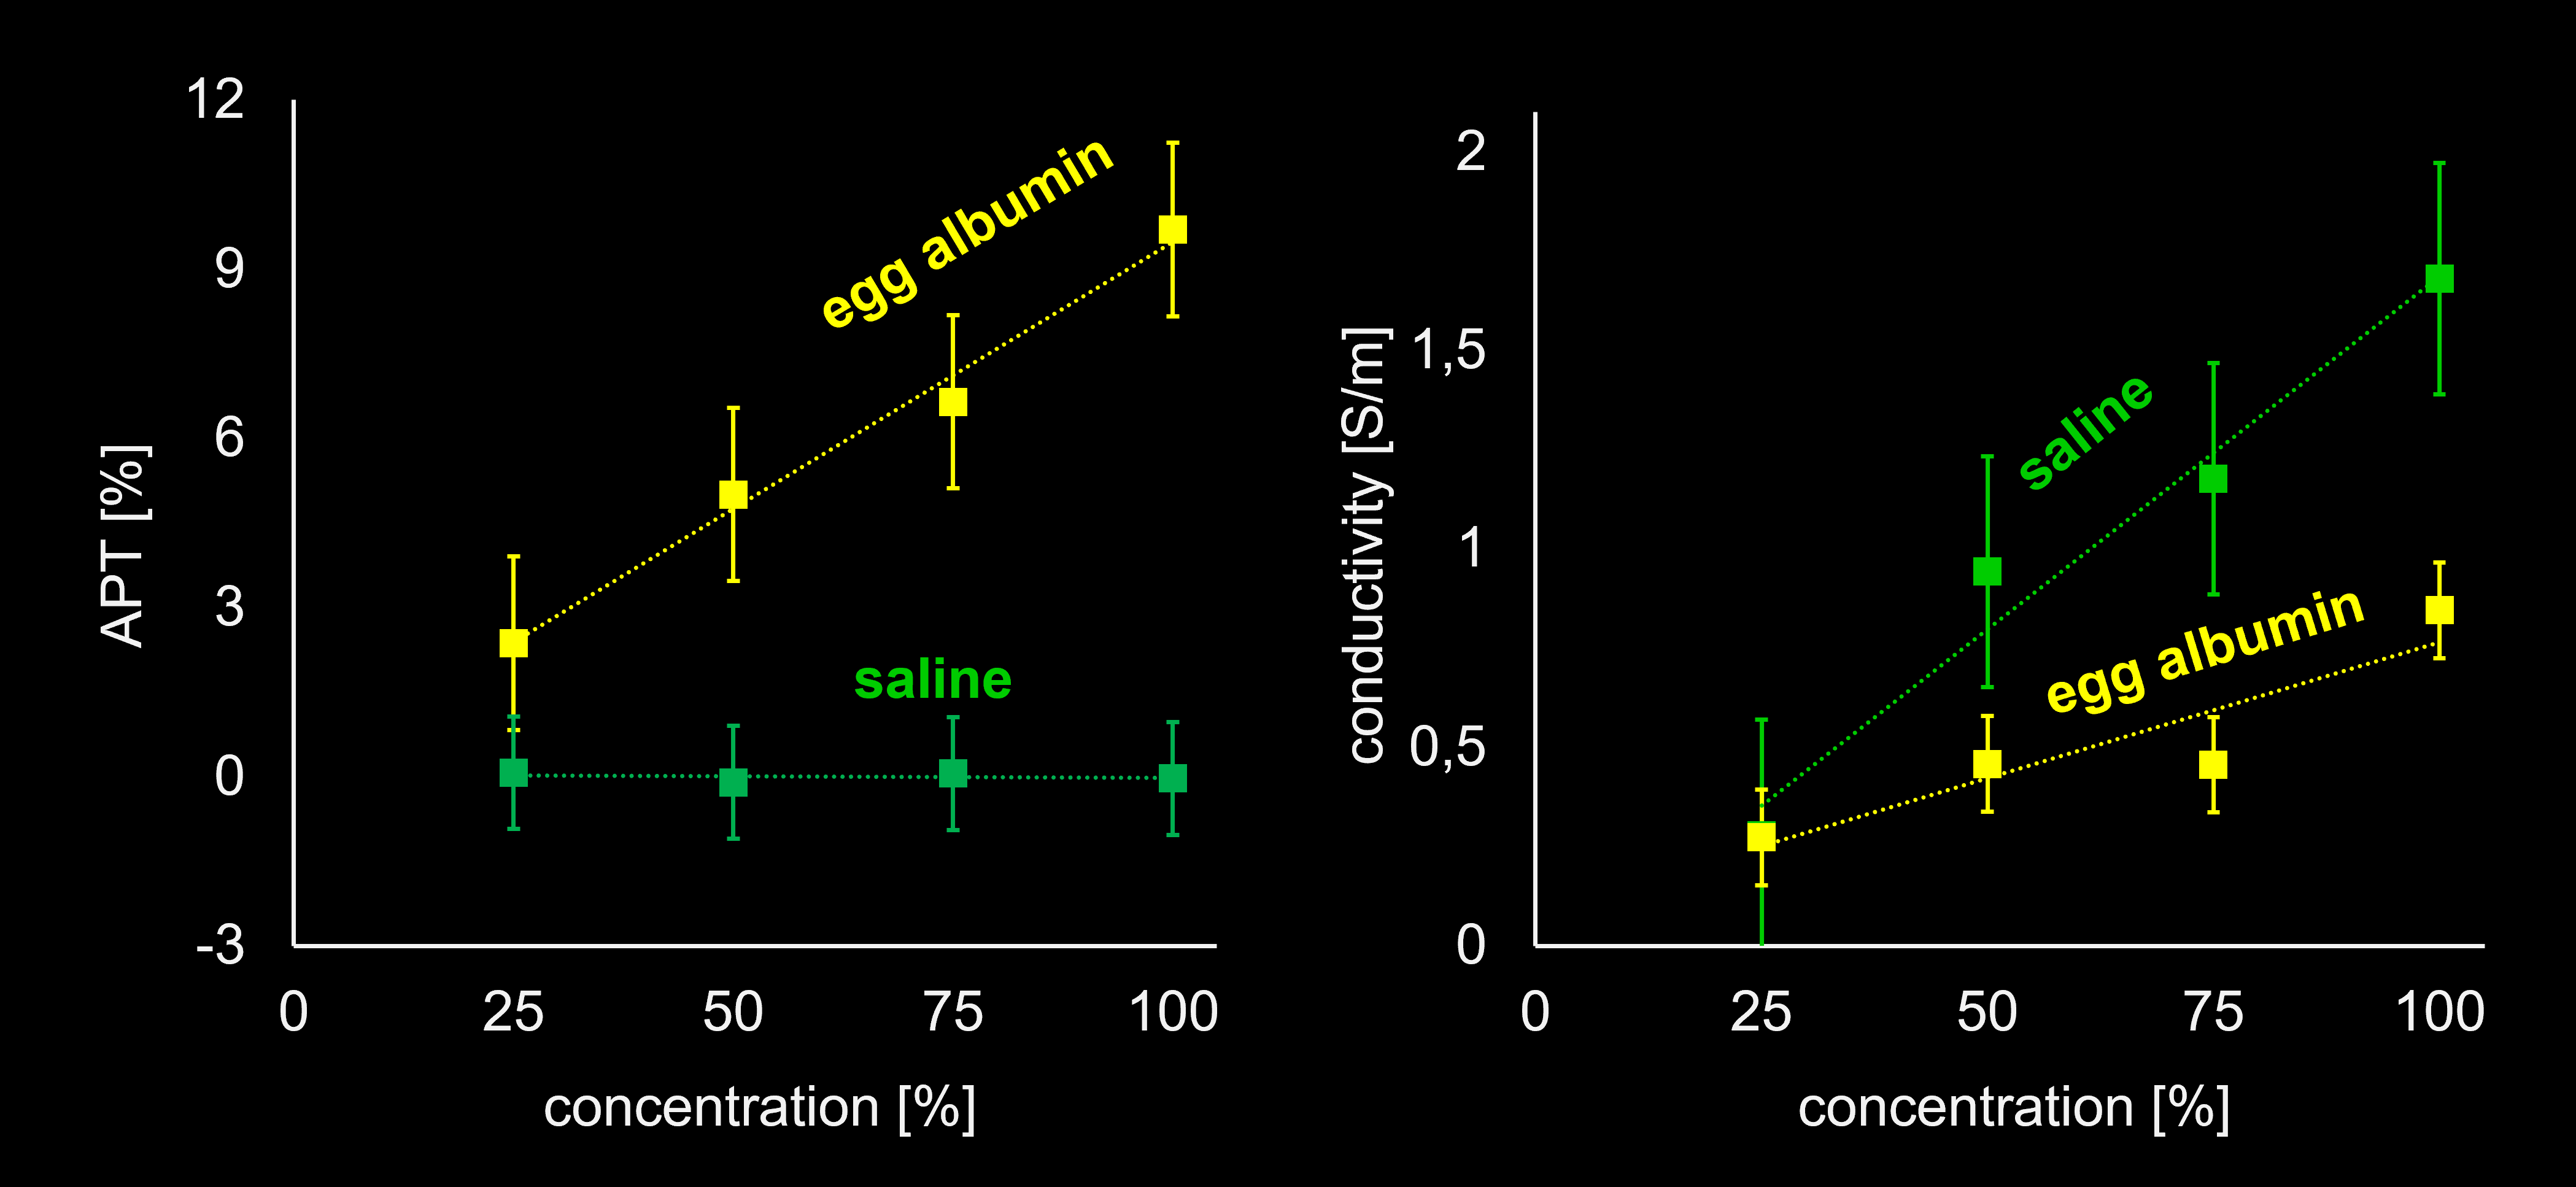
Fig. 2: Phantom results taken from 7 connecting APT signal and conductivity of egg albumin (serving as protein phantom), yielding an empirical conversion factor between APT signal and protein conductivity.
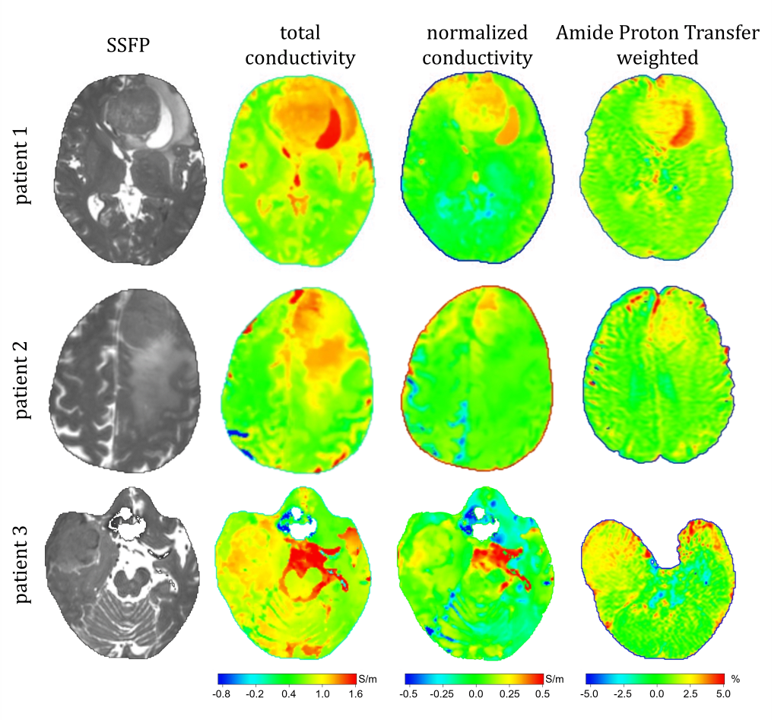
Fig. 3: Results for three meningioma patients. Normalized conductivity (as obtained by subtracting water-related conductivity from total conductivity) is expected to reflect protein-related conductivity. This hypothesis is confirmed by the congruence of normalized conductivity with APT-weighted maps reflecting protein concentration.