2314
Characterizing Quantitative Magnetization Transfer Maps from an MR-Linac in Regions of Progression in Biopsy-Only Glioblastoma1Physical Sciences Platform, Sunnybrook Research Institute, Toronto, ON, Canada, 2Medical Biophysics, University of Toronto, Toronto, ON, Canada, 3Sunnybrook Health Sciences Centre, Toronto, ON, Canada, 4Department of Radiation Oncology, Sunnybrook Health Sciences Centre, Toronto, ON, Canada, 5Department of Radiation Oncolog, Sunnybrook Health Sciences Centre, Toronto, ON, Canada, 6Department of Medical Imaging, University of Toronto, Sunnybrook Health Sciences Centre, Toronto, ON, Canada, 7Division of Neurology, Department of Medicine, Sunnybrook Health Sciences Centre, University of Toronto, Toronto, ON, Canada, 8Department of Surgery, St. Michael’s Hospital, Toronto, ON, Canada, 9Department of Neurosurgery and Paediatric Neurosurgery, Medical University, Lublin, Poland
Synopsis
Keywords: Tumors, CEST & MT, Radiotherapy
In biopsy-only glioblastoma patients scanned and treated on a 1.5T MR-Linac, this study quantifies the relationship between the quantitative magnetization transfer (qMT) semi-solid fraction and enhancing regions seen on post-contrast T1-weighted imaging on follow-up MRI scans. Metrics were computed to assess the spatial overlap between low semi-solid fraction regions and enhancing regions. In certain patients, the low semi-solid fraction region at the time of treatment correlated with enhancing region at follow up imaging. Our results suggest reduced semi-solid fraction values precede tumour progression, which could be used for guiding dose adaptation in radiation therapy.Introduction
The MR-Linac is a linear accelerator combined with a 1.5T MRI 1–4, which allows diagnostic-quality MR images to be obtained at each radiation treatment fraction for guiding treatment 5–10. Daily MRI guidance could facilitate adaptation of dose-escalated radiotherapy plans 11–15 based on microstructural and functional tumour changes from quantitative MRI. Although previous studies have used quantitative MRI to design dose-escalated plans for glioblastoma (GBM) 12,16,17, the optimal target volume is unclear. Quantitative magnetization transfer (qMT) 18,19, which provides macromolecular information related to white matter degradation, has been shown to predict treatment response in GBM 20–22 and is feasible for prescribing dose intensification plans 23. However, improved understanding of the patterns of progression is needed prior to dose escalation. Previous studies have shown qMT to be predictive of response or progression 20,22 but none have quantified the relationship between qMT signal and subsequent regions of progression.In this work, we assess the spatial relationship between the qMT signal and subsequent gadolinium contrast enhancement on follow-up MRI scans. The present study extends previous studies that predict early/late progression 20,22 to include spatial analysis of progression regions, focusing on patients with intact (non-resected) tumours, which may provide unique understanding of the qMT signal with minimal influence of post-surgical changes.
Methods
Study designThe study was approved by the institutional research ethics board. Informed consent was obtained. MRI and radiation treatment (RT) were performed on a 1.5T Elekta Unity MR-Linac (Elekta AB, Stockholm, Sweden) on patients enrolled in the MOMENTUM study (ClinicalTrials.gov identifier: NCT04075305) 24. Biopsy-only GBM patients imaged on the MR-Linac during standard-of-care chemoradiation treatment were included for analysis; patients with gross or subtotal resection were excluded. Clinical characteristics of progression were determined by the Response Assessment in Neuro-Oncology criteria 25 on follow-up diagnostic MRI scans.
Quantitative MT acquisition
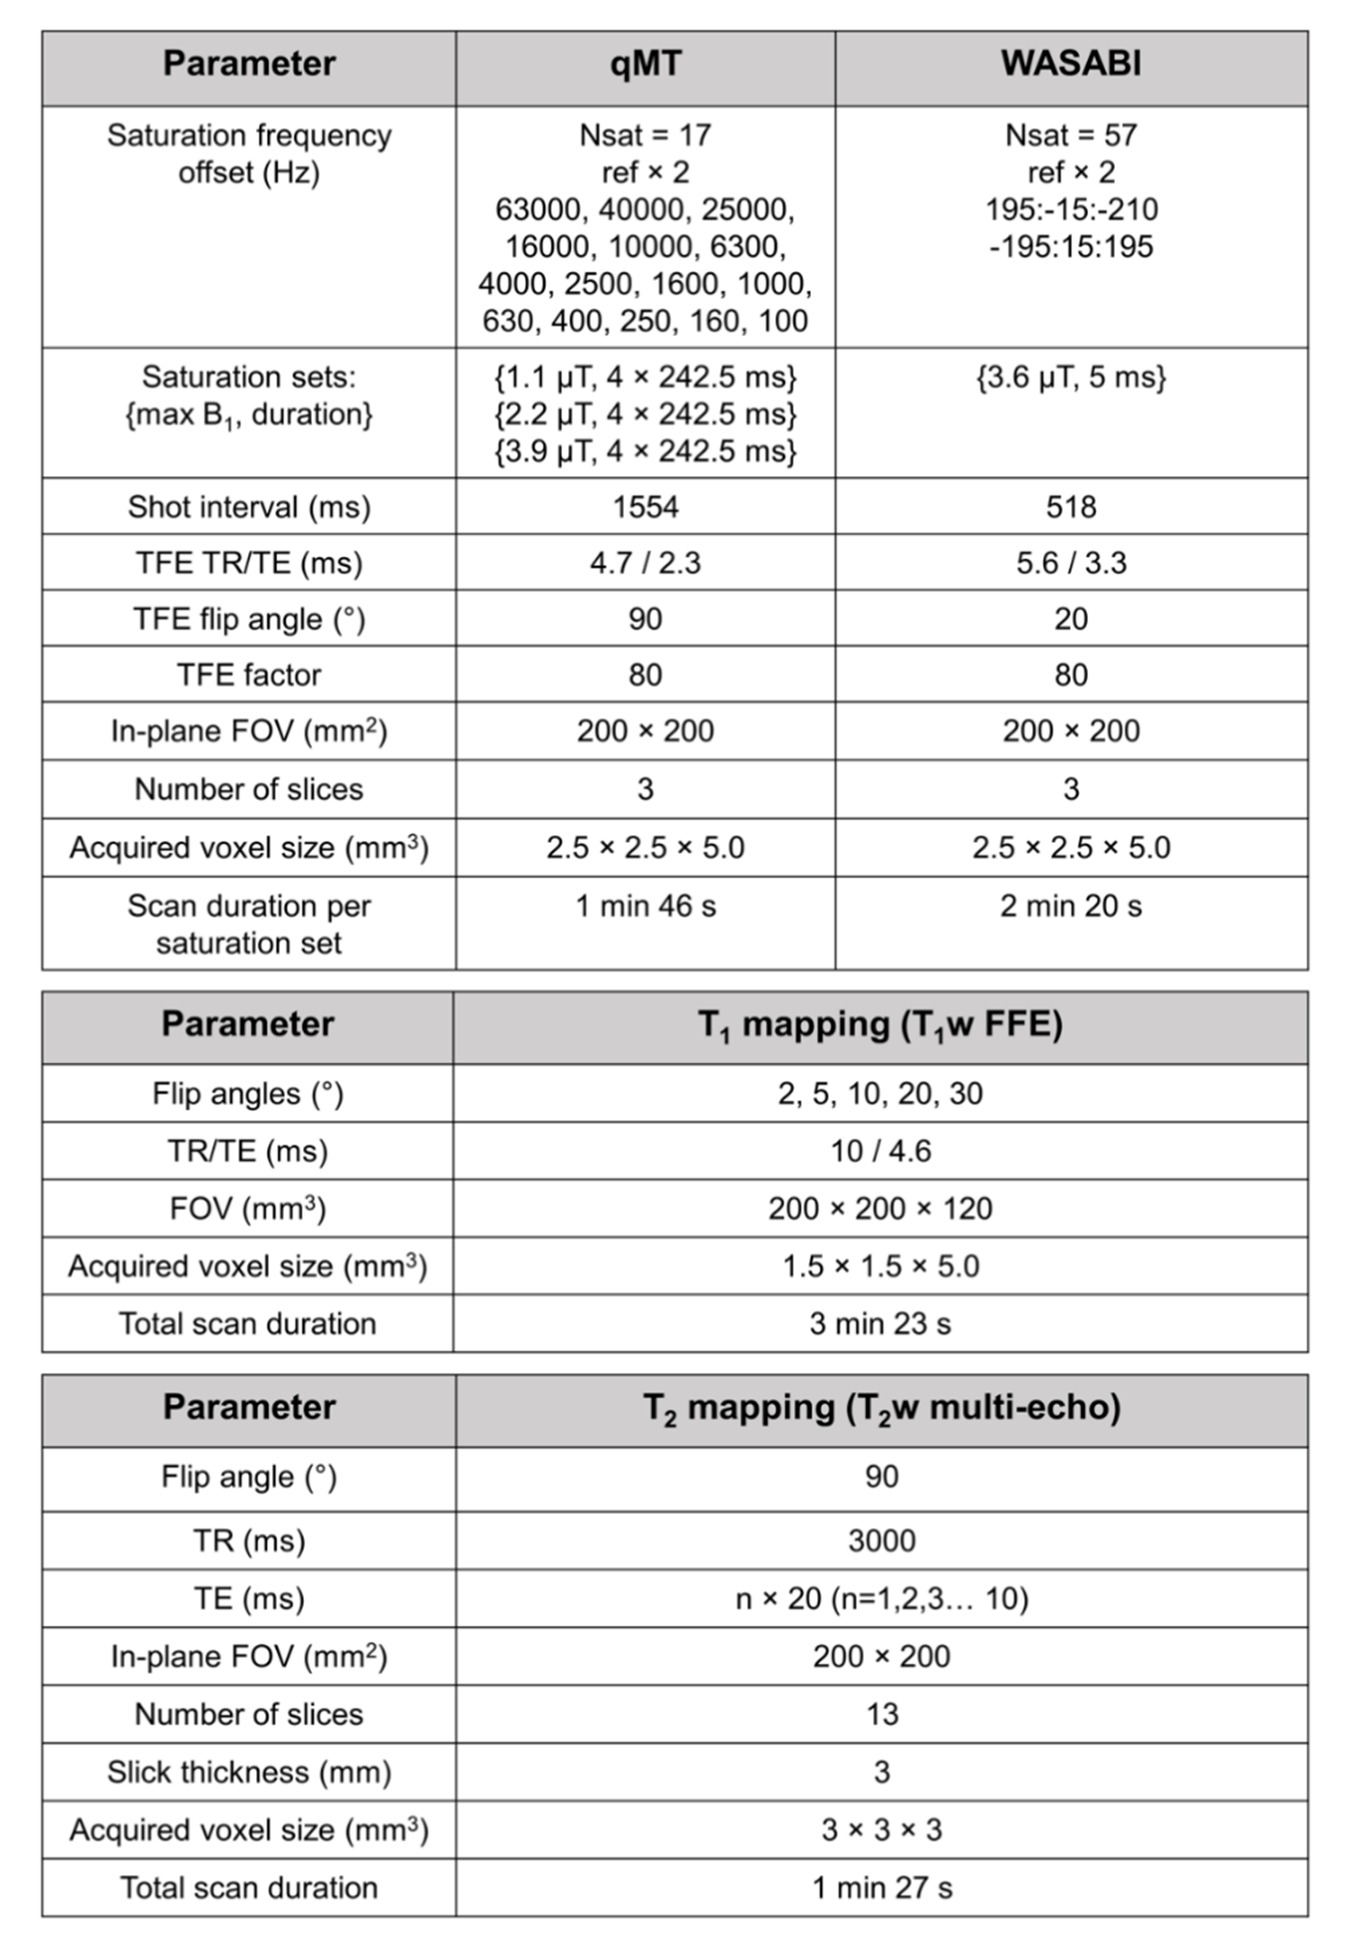
A pulsed qMT sequence 22,26–29 was used with RF saturation consisting of 10-ms block pulses separated by 2.5-ms gaps with gradient spoilers. The qMT imaging slab had three contiguous 5 mm slices centered on the tumour. Figure 1 shows the sequence parameters and scan durations for the qMT, WAter Shift And B1 (WASABI) 30, T1 and T2 mapping sequences.
Image processing
The gross tumour volume (GTV) and clinical target volume (CTV) were defined on the pre-RT MRI treatment-planning scans based on post-gadolinium T1-weighted (T1C) and FLAIR images, and rigidly propagated to each daily MR-Linac T1-weighted scan using FSL FLIRT 31,32. Follow-up T1C images were registered to each of the MR-Linac qMT time points. Regions of enhancement (ROE) on follow-up images were manually contoured in 3D on the high-resolution T1C scans before downsampling and aligning to the qMT slab. Data from qMT were fitted to a two-pool MT model 29,33. Semi-solid fraction (M0B) maps were thresholded within the CTV using a threshold of 7% to generate a “low-M0B” region. Ventricle voxels were removed. Metrics of spatial overlap were computed between low-M0B region and the ROE 34. The Dice coefficient was calculated between the low-M0B region, denoted by “A”, and the ROE, denoted by “B”, using the formula: Dice = 2(|𝐴∩𝐵|)/(|𝐴|+|𝐵|). The Sensitivity = (|𝐴∩𝐵|)/(|𝐵|) and the Positive Predictive Value (PPV) = (|𝐴∩𝐵|)/(|𝐴|) were also computed, along with the volume of low-M0B region and the median M0B over ROE.
Results
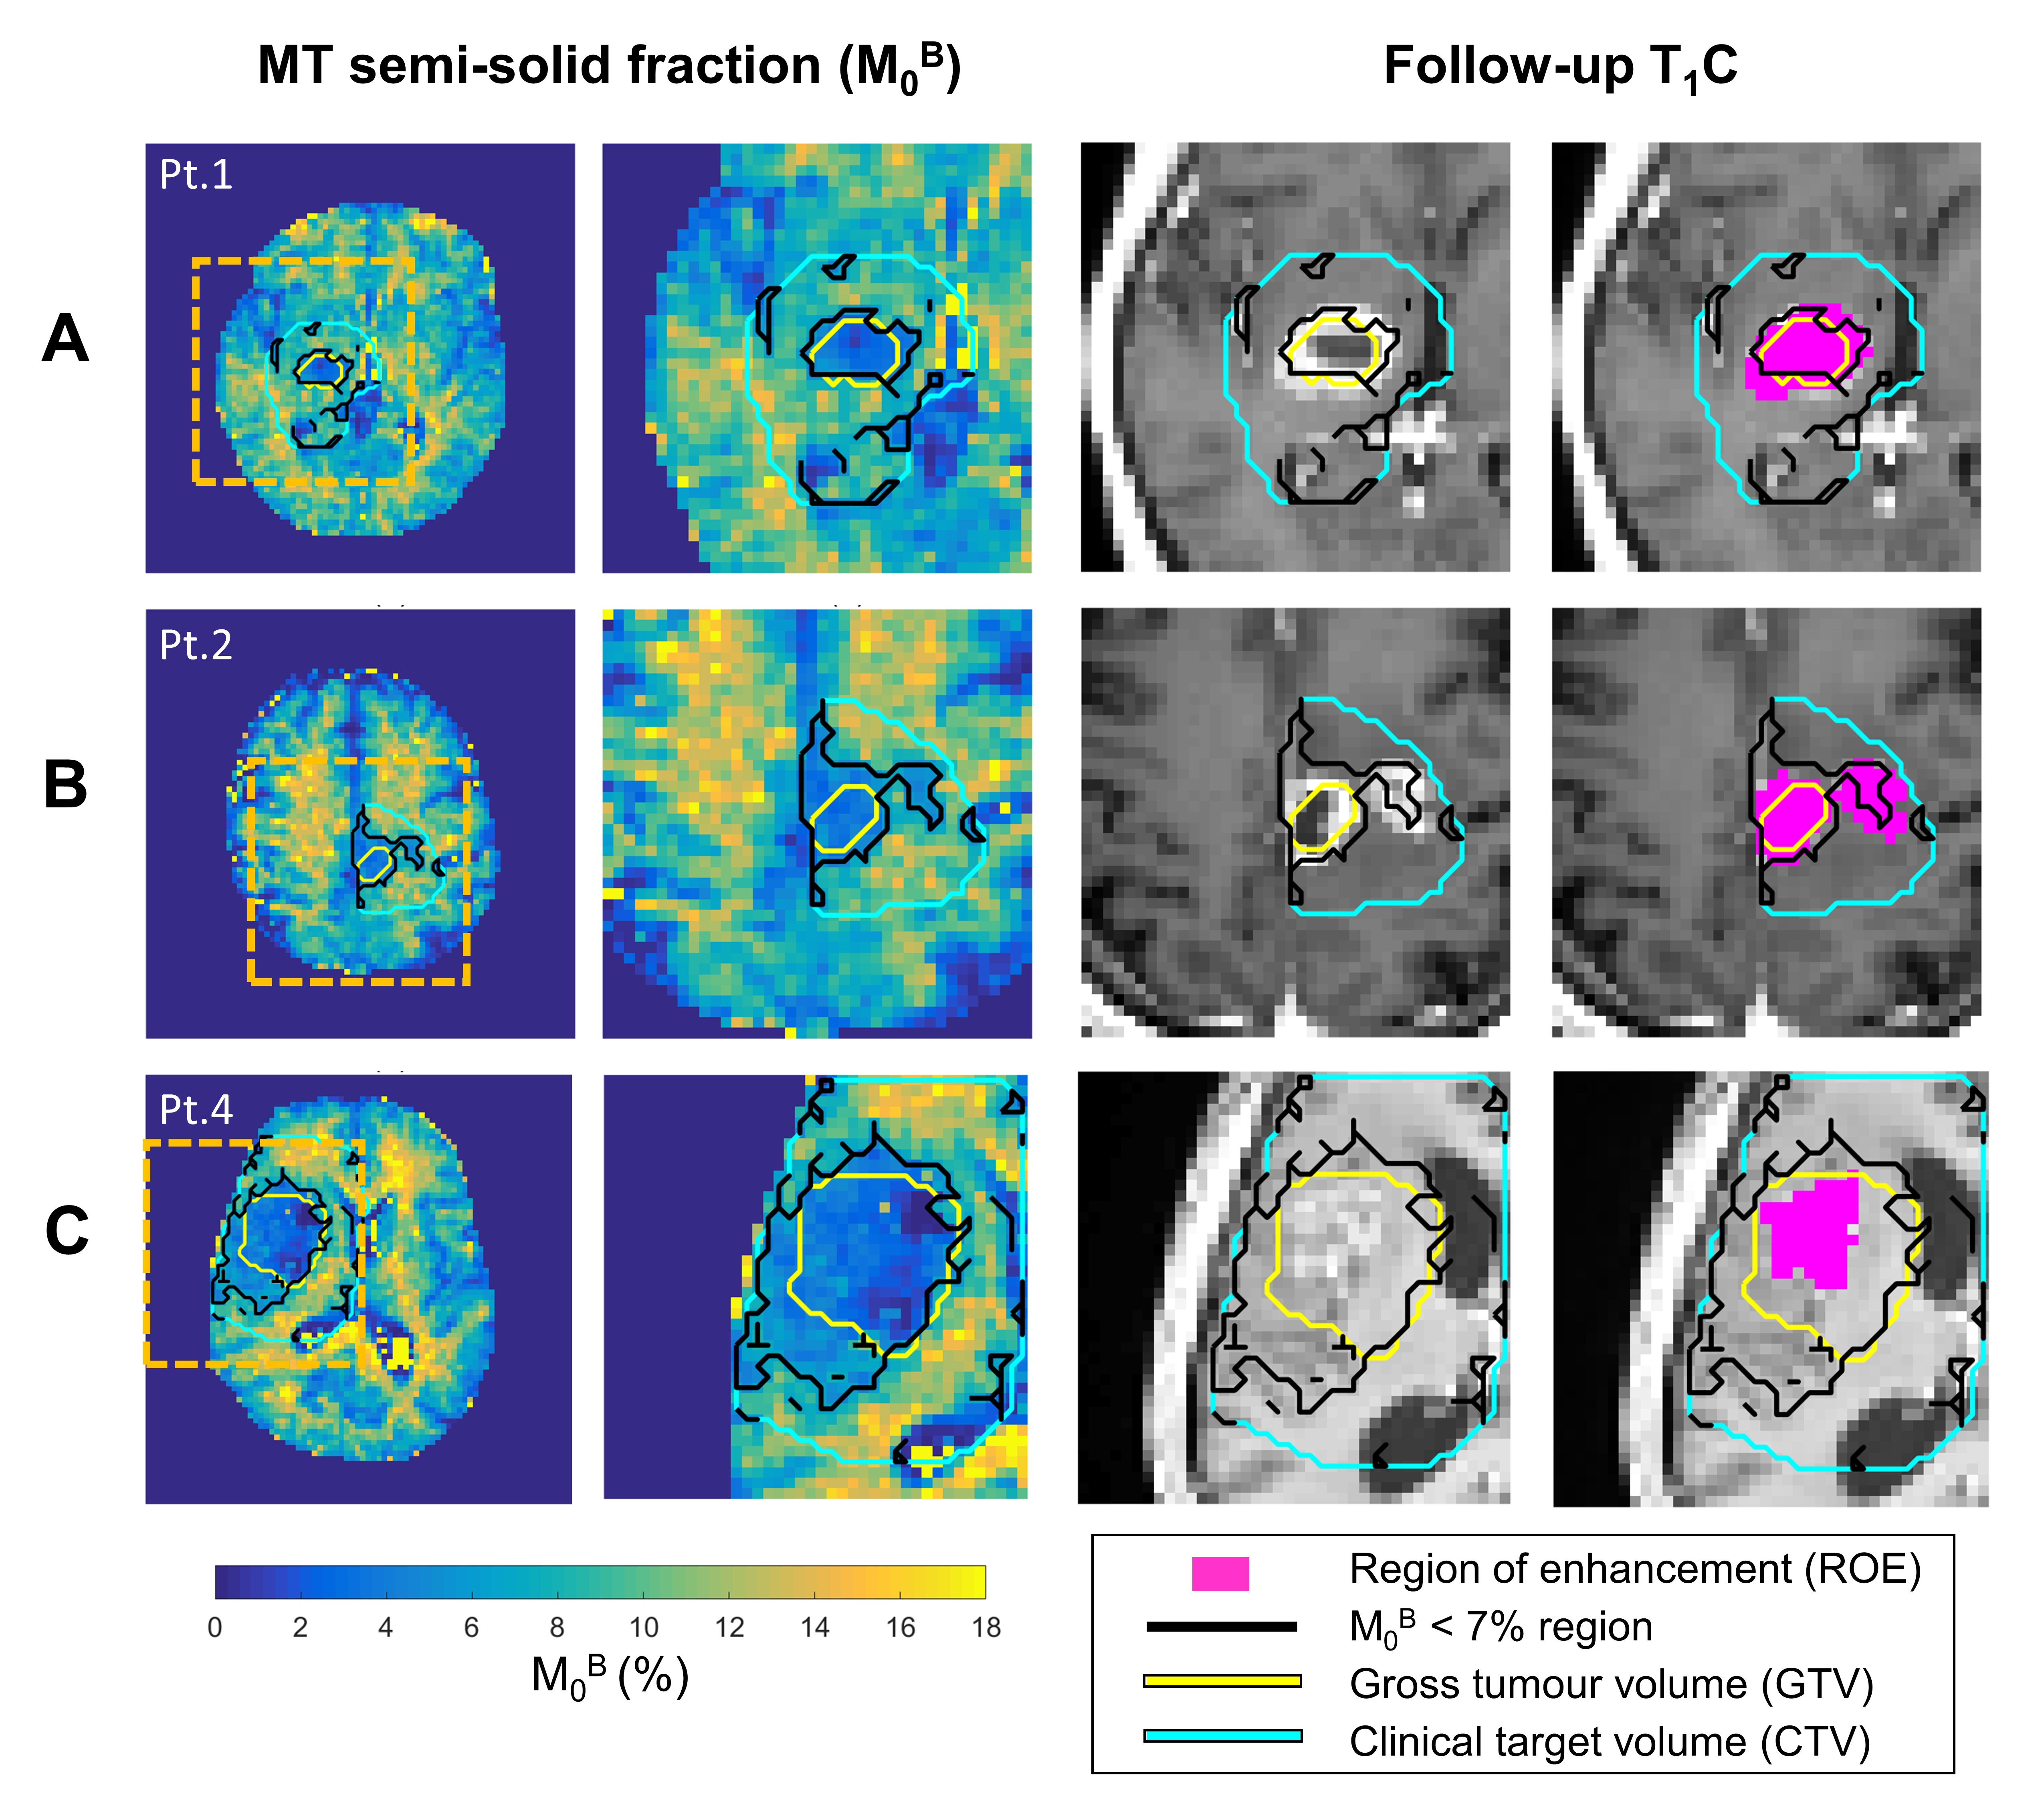
Of all biopsy-only GBM patients scanned on the MR-Linac with qMT (n=10), four patients were excluded from analysis due to: incomplete scans (n=1), insufficient follow-up (n=1), non-enhancing lesion on follow-up (n=1) and misplaced qMT slab (n=1, and for the third treatment fraction of patient #5). After exclusion, six cases were analyzed with a median follow-up interval of 4.8 months.Figure 2 shows a case of local progression (Figure 2A), a case of signal enhancement on follow-up imaging outside of the GTV (Figure 2B) where the low-M0B region spatially corresponds to the location of a newly-enhancing region, and an example where the low-M0B region over-predicts the ROE (Figure 2C).
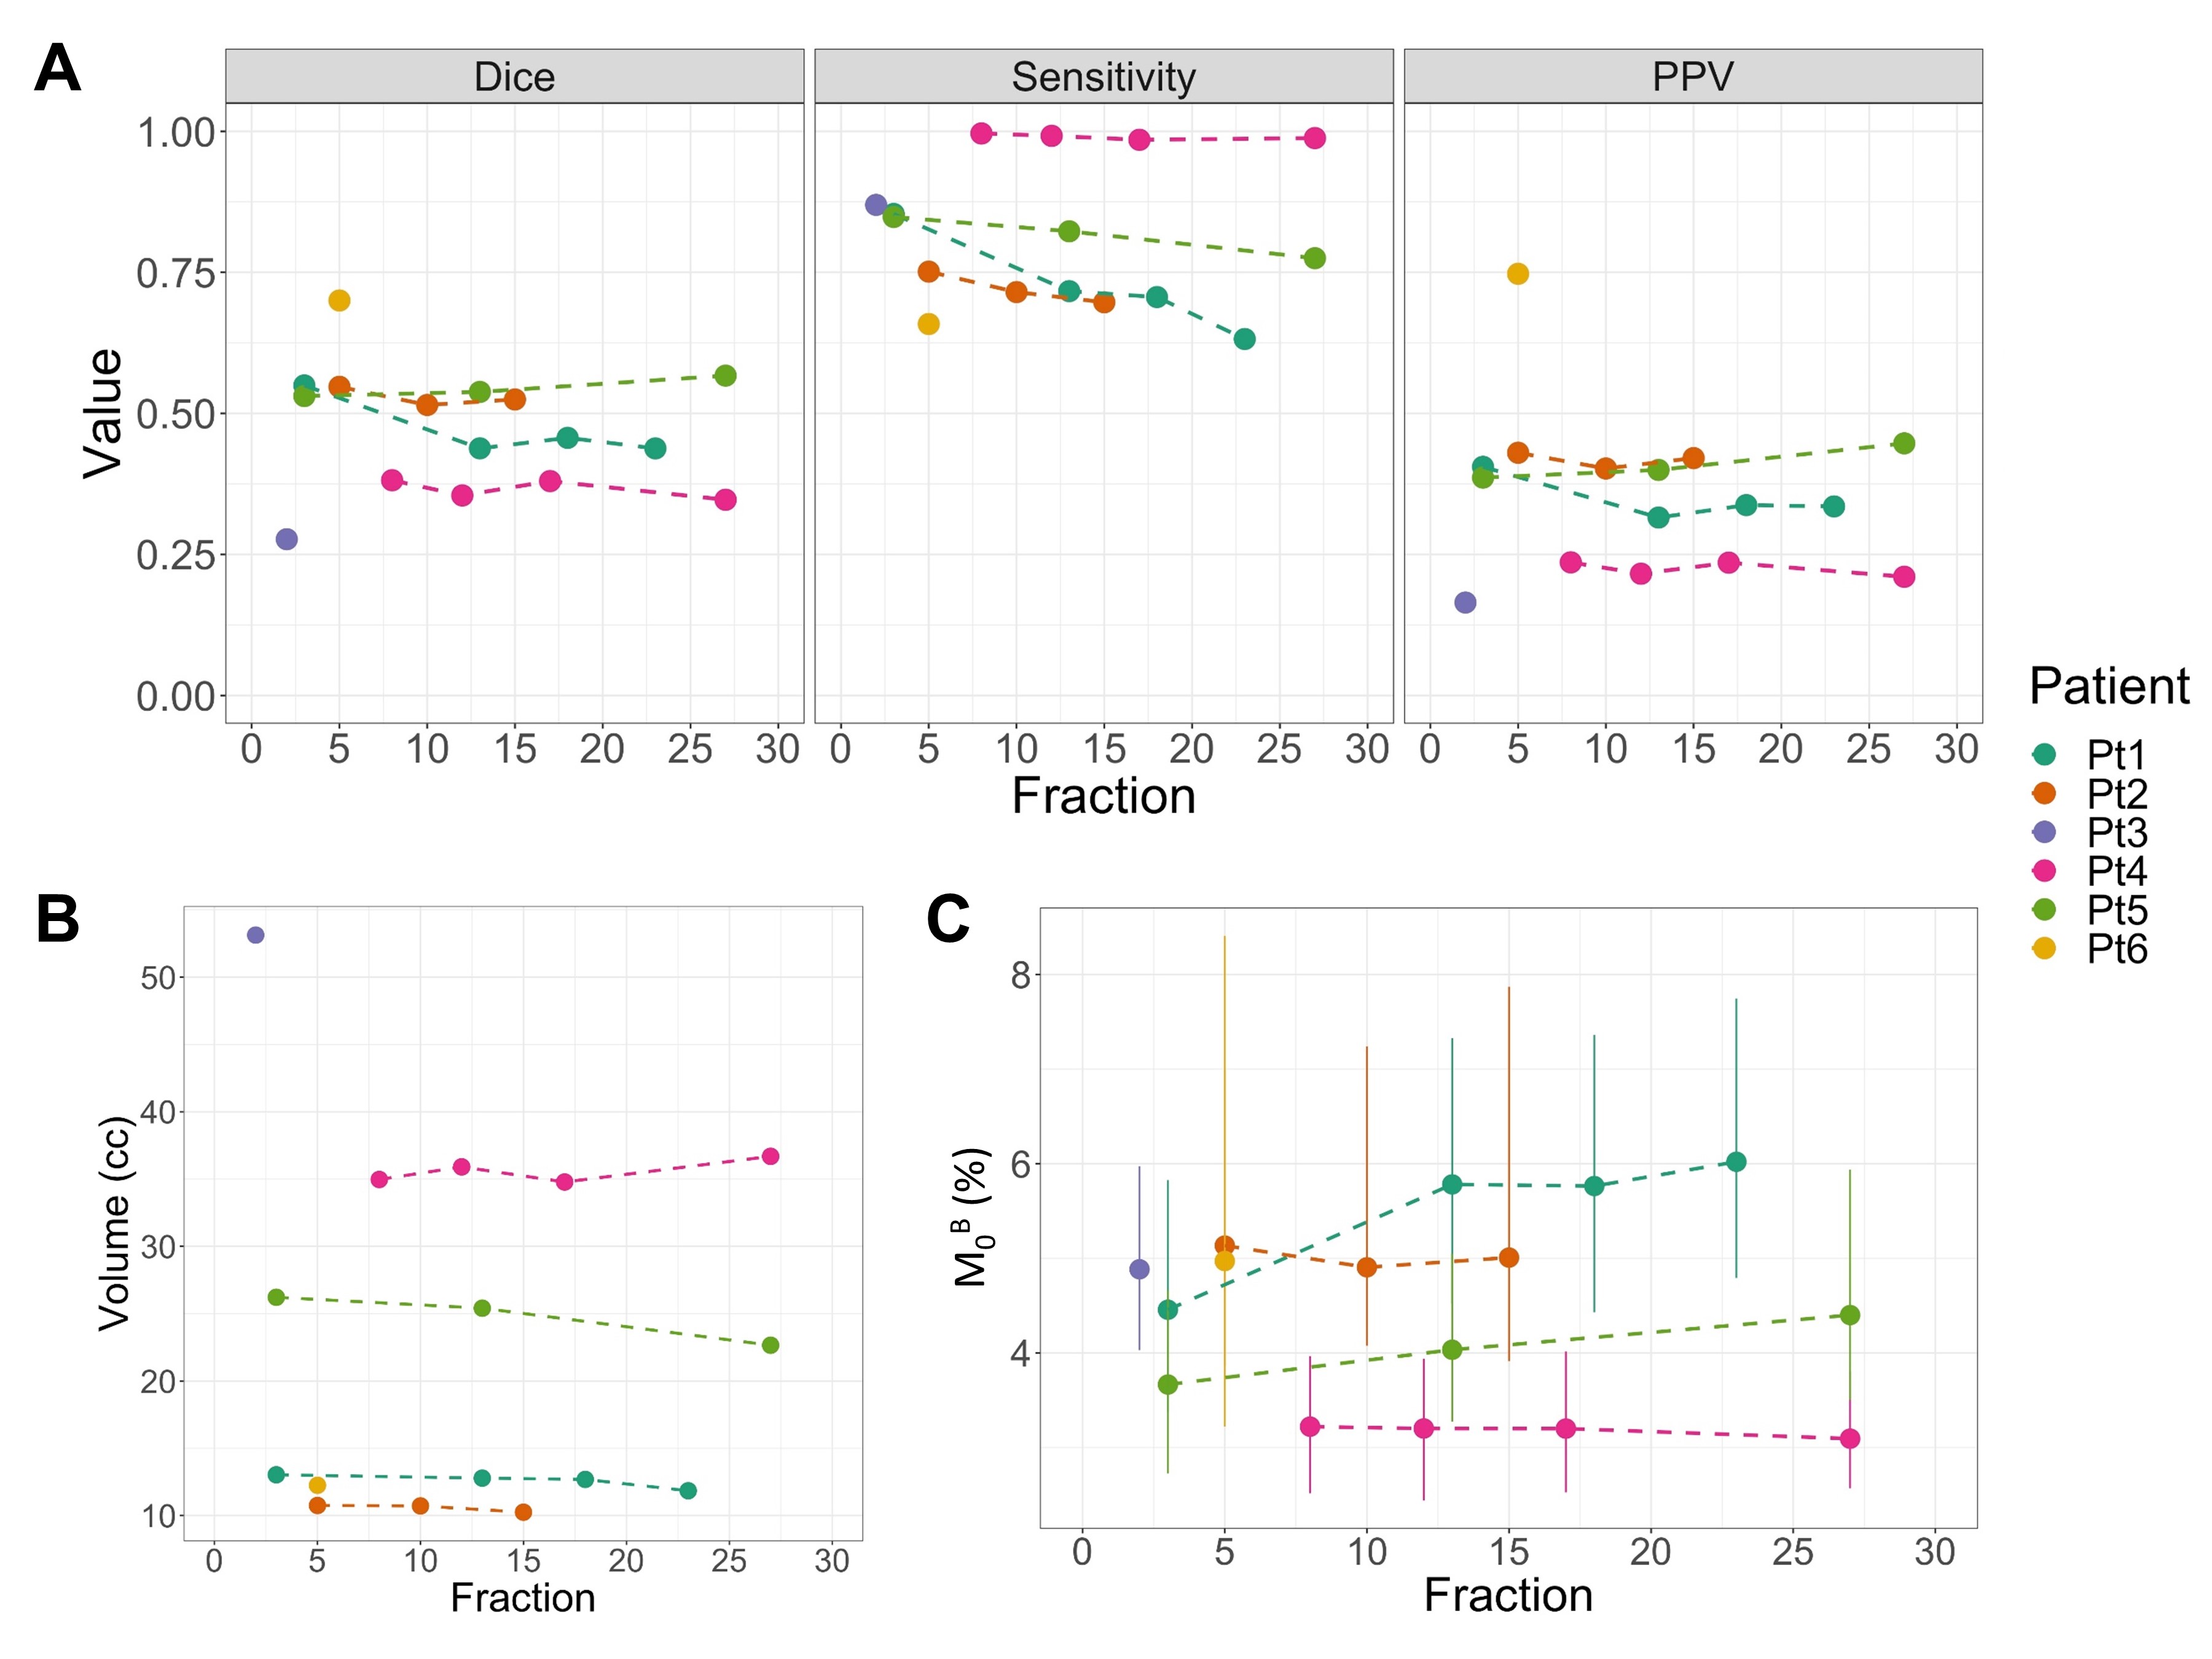
Figure 3A shows the Dice coefficient, sensitivity and PPV metrics across time. The volume of the low-M0B region (Figure 3B) had more variability between patients than across treatment time points. The M0B value within the ROE is also shown (Figure 3C).
Discussion
We investigated the qMT signal in relation to progressing regions as defined by the enhancing tumour area on follow-up imaging. The low-M0B region can predict the location of new enhancement in certain cases. Although the sensitivity was generally high, the PPV was less than 50% in 5/6 cases (Figure 3A), indicating that regions of low-M0B can be found outside of regions of future progression. This suggests that additional quantitative metrics 9,35 will be needed to accurately predict recurrence. Study drawbacks included the limited qMT coverage, an arbitrary M0B threshold and small patient cohort. Future work could test a range of thresholds for defining the low-M0B region, incorporate other image contrasts and compare with subjects who had undergone partial or full resection.Conclusion
This exploratory study quantified the semi-solid fraction in relation to regions of progression in biopsy-only GBM subjects. In certain patients, regions of reduced semi-solid fraction during treatment subsequently progressed at follow-up, suggesting that qMT could be useful for guiding dose-escalated radiotherapy on MR-Linacs.Acknowledgements
We thank all the MR-Linac radiation therapists including Shawn Binda, Danny Yu, Renée Christiani, Katie Wong, Helen Su, Monica Foster, Rebekah Shin, Khang Vo, Ruby Bola, Susana Sabaratram, Christina Silverson and Anne Carty for scanning and their assistance with the protocol; Mikki Campbell for study coordination; Brian Keller and Brige Chugh for MR-Linac operations; and Wilfred Lam for useful advice. We gratefully acknowledge the following sources of funding: Natural Sciences and Engineering Research Council; Terry Fox Research Institute; Canadian Institutes of Health Research; and Canadian Cancer Society Research Institute. Liam Lawrence and Rachel Chan contributed equally to this work as first authors.References
1. Raaymakers BW, Jürgenliemk-Schulz IM, Bol GH, et al. First patients treated with a 1.5 T MRI-Linac: Clinical proof of concept of a high-precision, high-field MRI guided radiotherapy treatment. Phys Med Biol 2017;62:L41–L50.
2. Lagendijk JJW, Raaymakers BW, van Vulpen M. The Magnetic Resonance Imaging–Linac System. Semin Radiat Oncol 2014;24:207–209.
3. Hall WA, Paulson ES, van der Heide UA, et al. The transformation of radiation oncology using real-time magnetic resonance guidance: A review. Eur J Cancer 2019;122:42–52.
4. Otazo R, Lambin P, Pignol J-P, et al. MRI-guided Radiation Therapy: An Emerging Paradigm in Adaptive Radiation Oncology. Radiology 2021;298:248–260.
5. Kooreman ES, van Houdt PJ, Keesman R, et al. ADC measurements on the Unity MR-linac – A recommendation on behalf of the Elekta Unity MR-linac consortium. Radiother Oncol 2020;153:106–113.
6. Cao Y, Tseng CL, Balter JM, Teng F, Parmar HA, Sahgal A. MR-guided radiation therapy: transformative technology and its role in the central nervous system. Neuro Oncol 2017;19:ii16–ii29.
7. van Houdt PJ, Yang Y, van der Heide UA. Quantitative Magnetic Resonance Imaging for Biological Image-Guided Adaptive Radiotherapy. Front Oncol 2021;10: 615643.
8. Chan RW, Lawrence LSP, Oglesby RT, et al. Chemical exchange saturation transfer MRI in central nervous system tumours on a 1.5 T MR-Linac. Radiother Oncol 2021;162:140–149.
9. Lawrence LSP, Chan RW, Chen H, et al. Accuracy and precision of apparent diffusion coefficient measurements on a 1.5 T MR-Linac in central nervous system tumour patients. Radiother Oncol 2021;164:155–162.
10. Tseng C-L, Chen H, Stewart J, et al. Glioma Radiation Therapy on a High Field 1.5 MR-Linac: Workflow and Initial Experience. Int J Radiat Oncol Biol Physics 2021 Nov 1;111(3)e602-3.
11. Watkins JM, Marshall DT, Patel S, et al. High-dose radiotherapy to 78 Gy with or without temozolomide for high grade gliomas. J Neurooncol 2009;93:343–348.
12. Tsien CI, Brown D, Normolle D, et al. Concurrent temozolomide and dose-escalated intensity-modulated radiation therapy in newly diagnosed glioblastoma. Clin Cancer Res 2012;18:273–279.
13. Shieh LT, Guo HR, Ho CH, Lin LC, Chang CH, Ho SY. Survival of glioblastoma treated with a moderately escalated radiation dose—Results of a retrospective analysis. PLoS One 2020;15:e0233188.
14. Zschaeck S, Wust P, Graf R, et al. Locally dose-escalated radiotherapy may improve intracranial local control and overall survival among patients with glioblastoma. Radiat Oncol 2018;13:251.
15. Miwa K, Matsuo M, Ogawa SI, et al. Hypofractionated high-dose irradiation with positron emission tomography data for the treatment of glioblastoma multiforme. Biomed Res Int 2014;2014:407026.
16. Miller S, Li P, Schipper M, et al. Metabolic Tumor Volume Response Assessment Using (11)C-Methionine Positron Emission Tomography Identifies Glioblastoma Tumor Subregions That Predict Progression Better Than Baseline or Anatomic Magnetic Resonance Imaging Alone. Adv Radiat Onc 2020;5:53–61.
17. Kim MM, Aryal MP, Sun Y, et al. Response assessment during chemoradiation using a hypercellular/hyperperfused imaging phenotype predicts survival in patients with newly diagnosed glioblastoma. Neuro Oncol 2021;23:1537–1546.
18. Wolff SD, Balaban RS. Magnetization transfer contrast (MTC) and tissue water proton relaxationin vivo. Magn Reson Med 1989;10:135–144.
19. Henkelman RM, Stanisz GJ, Graham SJ. Magnetization transfer in MRI: A review. NMR Biomed 2001;14:57–64.
20. Mehrabian H, Myrehaug S, Soliman H, Sahgal A, Stanisz GJ. Quantitative Magnetization Transfer in Monitoring Glioblastoma (GBM) Response to Therapy. Sci Rep 2018;8:2475.
21. Mehrabian H, Lam WW, Myrehaug S, Sahgal A, Stanisz GJ. Glioblastoma (GBM) effects on quantitative MRI of contralateral normal appearing white matter. J Neurooncol 2018;139:97–106.
22. Chan RW, Chen H, Myrehaug S, et al. Quantitative CEST and MT at 1.5T for monitoring treatment response in glioblastoma: early and late tumor progression during chemoradiation. J Neurooncol 2021;151:267–278.
23. Chan RW, Ruschin M, Lawrence L, et al. Dose-Escalated Radiation Treatment Plans in Glioblastoma Based on Quantitative Magnetization Transfer using a 1.5T MR-Linac. Proc ISMRM-ESMRMB ISMRT, London, 2022.
24. de Mol van Otterloo, SR, Christodouleas JP, Blezer ELA, Akhiat H, et al. The MOMENTUM Study: An International Registry for the Evidence-Based Introduction of MR-Guided Adaptive Therapy. Front Oncol 2020;10:1328.
25. Wen PY, Macdonald DR, Reardon DA, et al. Updated response assessment criteria for high-grade gliomas: Response assessment in neuro-oncology working group. J Clin Oncol 2010;28:1963–1972.
26. Graham SJ, Henkelman RM. Understanding pulsed magnetization transfer. J Magn Reson Imaging 1997;7:903–912.
27. Hu BS, Conolly SM, Wright GA, Nishimura DG, Macovski A. Pulsed saturation transfer contrast. Magn Reson Med 1992;26:231–240.
28. Portnoy S, Stanisz GJ. Modeling pulsed magnetization transfer. Magn Reson Med 2007;58:144–155.
29. Chan RW, Myrehaug S, Stanisz GJ, Sahgal A, Lau AZ. Quantification of pulsed saturation transfer at 1.5T and 3T. Magn Reson Med 2019;82:1684–1699.
30. Schuenke P, Windschuh J, Roeloffs V, Ladd ME, Bachert P, Zaiss M. Simultaneous mapping of water shift and B 1 (WASABI)—Application to field-Inhomogeneity correction of CEST MRI data. Magn Reson Med 2017;77:571–580.
31. Jenkinson M, Smith S. A global optimisation method for robust affine registration of brain images. Med Image Anal 2001;5:143–156.
32. Jenkinson M, Bannister P, Brady M, Smith S. Improved Optimization for the Robust and Accurate Linear Registration and Motion Correction of Brain Images. Neuroimage 2002;17:825–841.
33. Henkelman RM, Huang X, Xiang Q ‐S, Stanisz GJ, Swanson SD, Bronskill MJ. Quantitative interpretation of magnetization transfer. Magn Reson Med 1993;29:759–766.
34. Taha AA, Hanbury A. Metrics for evaluating 3D medical image segmentation: analysis, selection, and tool. BMC Med Imaging 2015;15:29.
35. Lawrence LS, Chan RW, Stewart J, et al. Dynamics of hypercellular glioma regions identified with diffusion-weighted imaging for adaptive radiotherapy on an MR-Linac. Proc ISMRM-ESMRMB ISMRT, London, 2022.
Figures