2313
Development of quantitative vessel analysis platform based on MR angiography to assess reversible cerebral vasoconstriction syndrome1Department of Biomedical Imaging and Radiological Sciences, National Yang Ming Chiao Tung University, Taipei, Taiwan, 2School of Medicine, National Yang Ming Chiao Tung University, Taipei, Taiwan, 3Department of Neurology, Neurological Institute, Taipei Veterans General Hospital, Taipei, Taiwan, 4Brain Research Center, National Yang Ming Chiao Tung University, Taipei, Taiwan, 5Department of Radiology, Taipei Veterans General Hospital, Taipei, Taiwan
Synopsis
Keywords: Blood vessels, Visualization
Reversible cerebral vasoconstriction syndrome (RCVS) shows reversible diffuse constriction of the cerebral arteries. Previous studies proposed manual measurement of vasoconstriction. However, the stenosis estimated by comparing the stenosed with proximally normal diameter might result in an underestimate of vasoconstriction for the long-segmental stenosis. Accordingly, we developed a quantitative vessel analysis platform to measure the vasoconstriction rate by comparing vessel diameters between acute and remission MR angiography. Our platform provided objective measures of vasoconstriction and further confirmed that acute RCVS presented not only local vasoconstriction but a large portion of short- and long-segmental vasoconstriction in all artery segments.Background and Purpose
Reversible cerebral vasoconstriction syndrome (RCVS) is characterized by thunderclap headache and diffuse segmental vasoconstriction that resolves spontaneously within three months. Previous reports have indicated that the constriction first involves small distal arteries and then progresses to major vessels as thunderclap headache remission1. MR angiography (MRA) is a widely used tool to evaluate vasoconstriction in patients with RCVS2. Although RCVS has been increasingly studied, an objective measurement tool of vasoconstriction is still lacked. Manual measurement of vasoconstriction extent was commonly performed by calculating the difference between stenosed diameter and normal diameter of the proximal segment2. However, for the case with stenosis involving the entire or long portion of artery segment, the estimate of normal diameter may be biased resulting in an underestimate of vasoconstriction. This study aimed to develop a quantitative vessel analysis platform to automatically calculate vessel diameter of cerebral arteries based on MRA and to further estimate the vasoconstriction rate in different cerebral artery segments by comparing acute and remission MRA in patients with RCVS.Materials and Methods
Thirty patients were retrospectively recruited from Taipei Veterans General Hospital to test our proposed platform. Each subject was diagnosed as RCVS based on the criteria adopted in previous studies3,4, which was in line with “headaches attributed to RCVS” in the International Classification of Headache Disorders, third edition (ICHD-3; code 6.7.3)5. MRA was performed during the acute stage (within 30 days after headache onset) and remission stage (around 3 months after onset) to estimate the vasoconstriction rate. The 3D-TOF MRAs were acquired using a 3.0-T GE Discovery MR750 scanner with TR of 25 ms, TE of 2.9 ms, and voxel size of 0.39x0.39x0.50 mm3. The study was approved by the local Institutional Review Board. Several postprocessing steps on the MRA were applied to reduce the discrepancy of imaging parameters using our Vessel Analysis Platform (VAP) with a graphic user interface built on MATLAB programming environment. The functions of VAP included image coregistration, image preprocessing, vessel segmentation, vessel tracing, diameter calculation, and artery labeling. The longitudinal coregistration between acute and remission MRA images was first applied. The vessel segmentation of the cerebral arteries was performed using intensity thresholding and 3D region growing. Manually labeled seed points in the bilateral ICA and VA as the starting points for vessel tracing. The first and second segments of the anterior (A1 and A2), middle (M1 and M2), and posterior (P1 and P2) cerebral arteries and basilar artery (BA) were then manually segmented in acute images and mapped to the corresponding locations in remission images. The vessel diameter was automatically calculated at each voxel located in the central axis of vessel (Figure 1). In order to objectively estimate the vasoconstriction rate for RCVS, the vessel diameters measured in acute and remission stages were compared in each artery segment. A vasoconstriction rate larger than 10% was treated as a stenosis. The processing workflow is shown in Figure 1.Results and Discussion
Our VAP provided the display of 3D vessel model, vessel skeleton (central axis), and color rendering of vessel diameter and vasoconstriction rate. Figure 2A presents the stenosed regions manually labeled by an experienced neuroradiologist and automatically detected by our platform. Furthermore, our platform could also detect the underestimated stenosed regions because we used the remission MRA as the reference rather than the proximal artery diameter in the same scan. The comparison of diameter rendering between acute and remission stages illustrated the long-segmental rather than local vasoconstriction in the acute stage (Figure 2B). Figure 3 shows a demonstrative case with no significant vasoconstriction of A1 could be identified only based on acute images. However, more than 60% portion of A1 was identified with vasoconstriction rate larger than 10% by comparing the acute diameters with remission diameters in this RCVS case. Our results suggested that RCVS may involve a longer segmental vasoconstriction rather than local vasoconstriction in the acute stage.Conclusions
This study proposed a new approach to estimate the vasoconstriction rate by comparing the vessel diameter between acute and remission stage in RCVS. Our proposed platform provided an objective measurement of short- and long-segmental vasoconstriction compared to the conventional approach. We also concluded that stenosis could not only occur in a local region but involve a long-segmental vasoconstriction in the acute stage. Our platform and findings could benefit clinical diagnosis of vasoconstriction and guide the clinical management of RCVS patients.Acknowledgements
This study was supported by Ministry of Science and Technology of Taiwan (MOST110-2634-FA49-005 and MOST 109-2314-B-010-022-MY3).References
- Shimoda, M., et al., Clinical significance of centripetal propagation of vasoconstriction in patients with reversible cerebral vasoconstriction syndrome: A retrospective case-control study. Cephalalgia, 2018. 38(12): p. 1864-1875.
- Chen, S.P., et al., Magnetic resonance angiography in reversible cerebral vasoconstriction syndromes. Ann Neurol, 2010. 67(5): p. 648-56.
- Chen, S.P., et al., Dynamic Changes in White Matter Hyperintensities in Reversible Cerebral Vasoconstriction Syndrome. JAMA Neurol, 2018. 75(9): p. 1106-1113.
- Wu, C.H., et al., Noninvasive Characterization of Human Glymphatics and Meningeal Lymphatics in an in vivo Model of Blood-Brain Barrier Leakage. Ann Neurol, 2021. 89(1): p. 111-124.
- Arnold, M.J.C., Headache classification committee of the international headache society (IHS) the international classification of headache disorders. 2018. 38(1): p. 1-211.
Figures
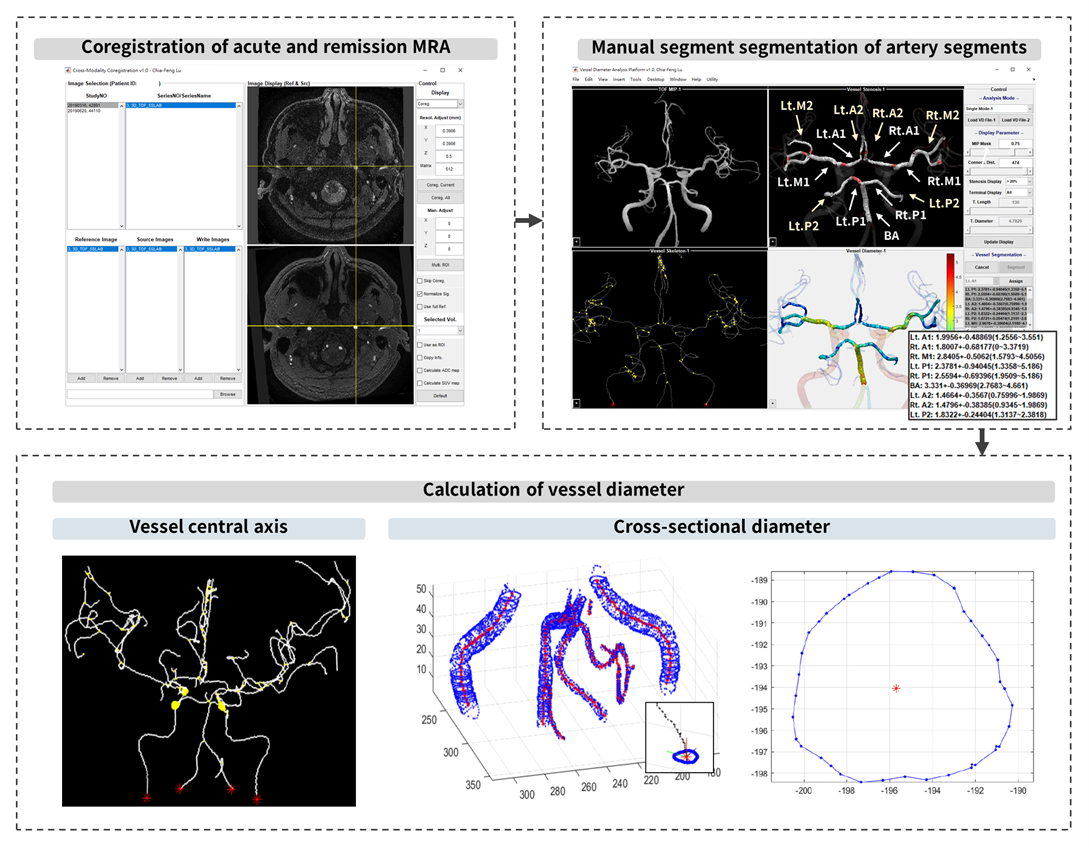
Figure 1. Flowchart of image processing.
Longitudinal coregistration between acute and remission images is first performed. The major cerebral artery segments (A1, A2, M1, M2, P1, P2, and BA) are manually segmented in acute images and mapped to the corresponding locations in remission images. Calculation of vessel diameter is based on each voxel located in the central axis of vessel.
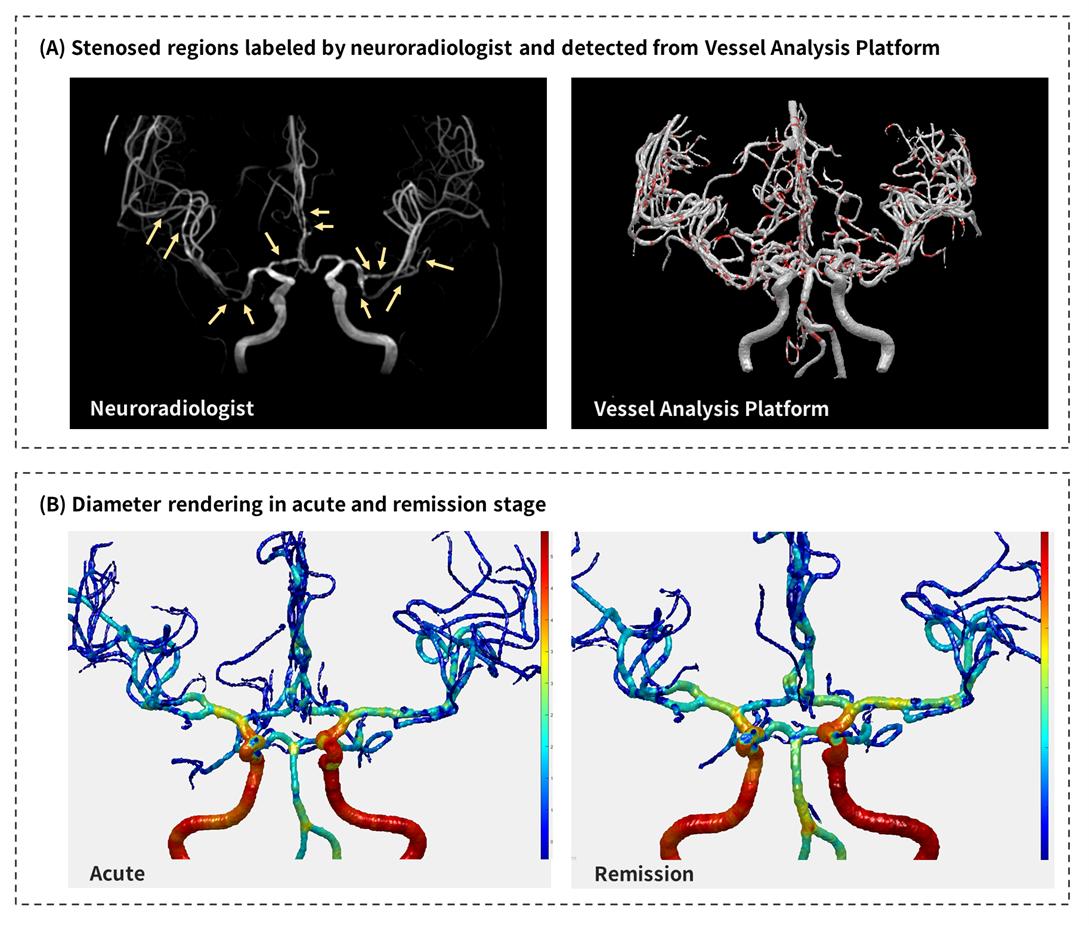
Figure 2. The color rendering of stenosed regions and vessel diameters.
The stenosed regions were manually labeled by an experienced neuroradiologist and automatically detected by our platform (A). Comparison between color rendering vessel diameter between acute and remission stages illustrates the long-segmental vasoconstriction in acute stage (B).
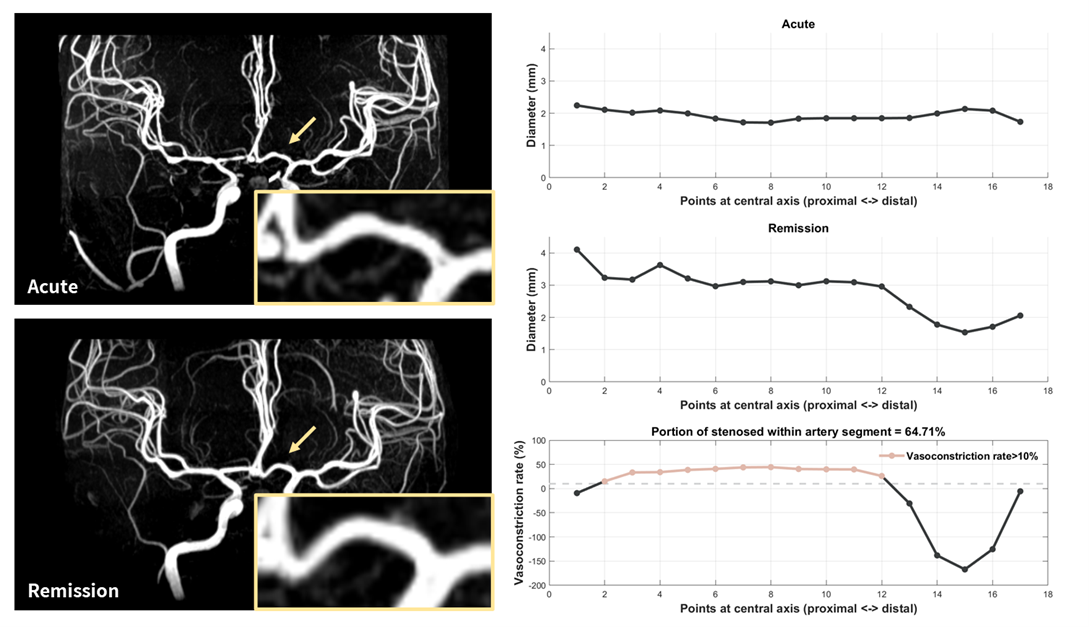
Figure 3. MRA and quantitative vessel diameter analysis for a representative case with RCVS.
In the acute stage, no significant vasoconstriction in A1 could be identified in both MRA images and quantitative vessel diameters. However, more than 60% portion of A1 is identified with vasoconstriction rate larger than 10% by comparing the acute diameters with remission diameters in this RCVS case.