2312
Cerebrovascular Peak-Velocity Mapping in Intracranial Atherosclerotic Disease (ICAD) using 4D Flow MRI1Radiology, Feinberg School of Medicine, Northwestern University, Chicago, IL, United States, 2Neurology, Feinberg School of Medicine, Northwestern University, Chicago, IL, United States, 3Department of Medical Physics, University of Greifswald, Greifswald, Germany, 4Radiology, Northwestern University, Chicago, IL, United States
Synopsis
Keywords: Blood vessels, Atherosclerosis
Intracranial atherosclerotic disease (ICAD) accounts for 10-50% of acute ischemic strokes and is a leading cause of global morbidity and mortality. We used a semi-automated voxel-wise velocity-based mapping approach to visualize and quantify global and regional peak velocities (PVs) in the Circle of Willis (CoW) in 31 ICAD patients with moderate to severe MCA or ICA stenosis and 23 healthy controls. Our findings indicate 4D flow MRI-based cerebrovascular PV mapping can detect asymmetric PV distribution in the CoW on hemispheric and vessel levels. Future work will include investigation of PV asymmetry measures in the assessment of ICAD progression and outcomes.Background
ICAD causes up to 10% of acute ischemic strokes in North America1 and up to 50% in Asia, making it a leading cause of morbidity and mortality globally2,3. Strokes secondary to ICAD have high likelihood of recurrence (12-25% over 1-2 years)4, driving the need for robust analysis. Luminal stenosis is the universally accepted marker of disease progression in ICAD5. However, available evidence indicates that regional measures of ICAD severity alone (i.e. lumen dimeter) cannot fully capture the impact of the lesion on cerebrovascular hemodynamic changes in the Circle of Willis (CoW)6-10.In this context, 4D flow MRI is a versatile tool for measurement of global and regional 3D velocity data with full volumetric coverage of the entire CoW11,12. Our previous intracranial 4D flow studies have shown significant hemodynamic asymmetries, including peak velocity (PV) and pressure changes in ICAD patients compared to controls8,10. The purpose of this study was to further investigate the impact of ICAD with known severity grades on changes in CoW velocities and resulting asymmetries between the affected brain hemispheres in a large cohort of ICAD patients and compared to healthy controls. Additionally, this study introduces a velocity-based and voxel-wise analysis approach for intuitive visualization and quantification of global, hemispheric, and regional PVs in the CoW. We hypothesized elevated global PV and increased asymmetry in ICAD patients compared to controls.
Methods
31 ICAD patients (62.5 ± 13.6 years, 16F) with either middle cerebral artery (MCA) stenosis (n=23: 16 severe, 7 moderate) or internal carotid artery (ICA) stenosis (n=8: 5 severe, 3 moderate) and 23 healthy controls (36.3 ± 16.3 years, 4F) with no cerebrovascular disease history were included in this IRB-approved study. Two experienced neuroradiologists (S.A.A. and R.A.) used the WASID method to quantify stenosis grading13,14. Vessels were classified as severe if >70%, moderate if >50% and mild if 30-49% stenosis.Patients underwent a comprehensive ICAD protocol on a 3T MRI system (MAGNETOM Skyra, Siemens, Erlangen, Germany), including dual-venc 4D flow MRI (TR=5.7-6.6 ms, TE=3.1-4.4 ms, flip angle=15°, low/high venc=60/120 cm/s, voxel size=1.0 mm isometric, temporal resolution=82-84 ms, k-t PEAK-GRAPPA15 acceleration factor of R = 5, approximate scan time=8-10 minutes).
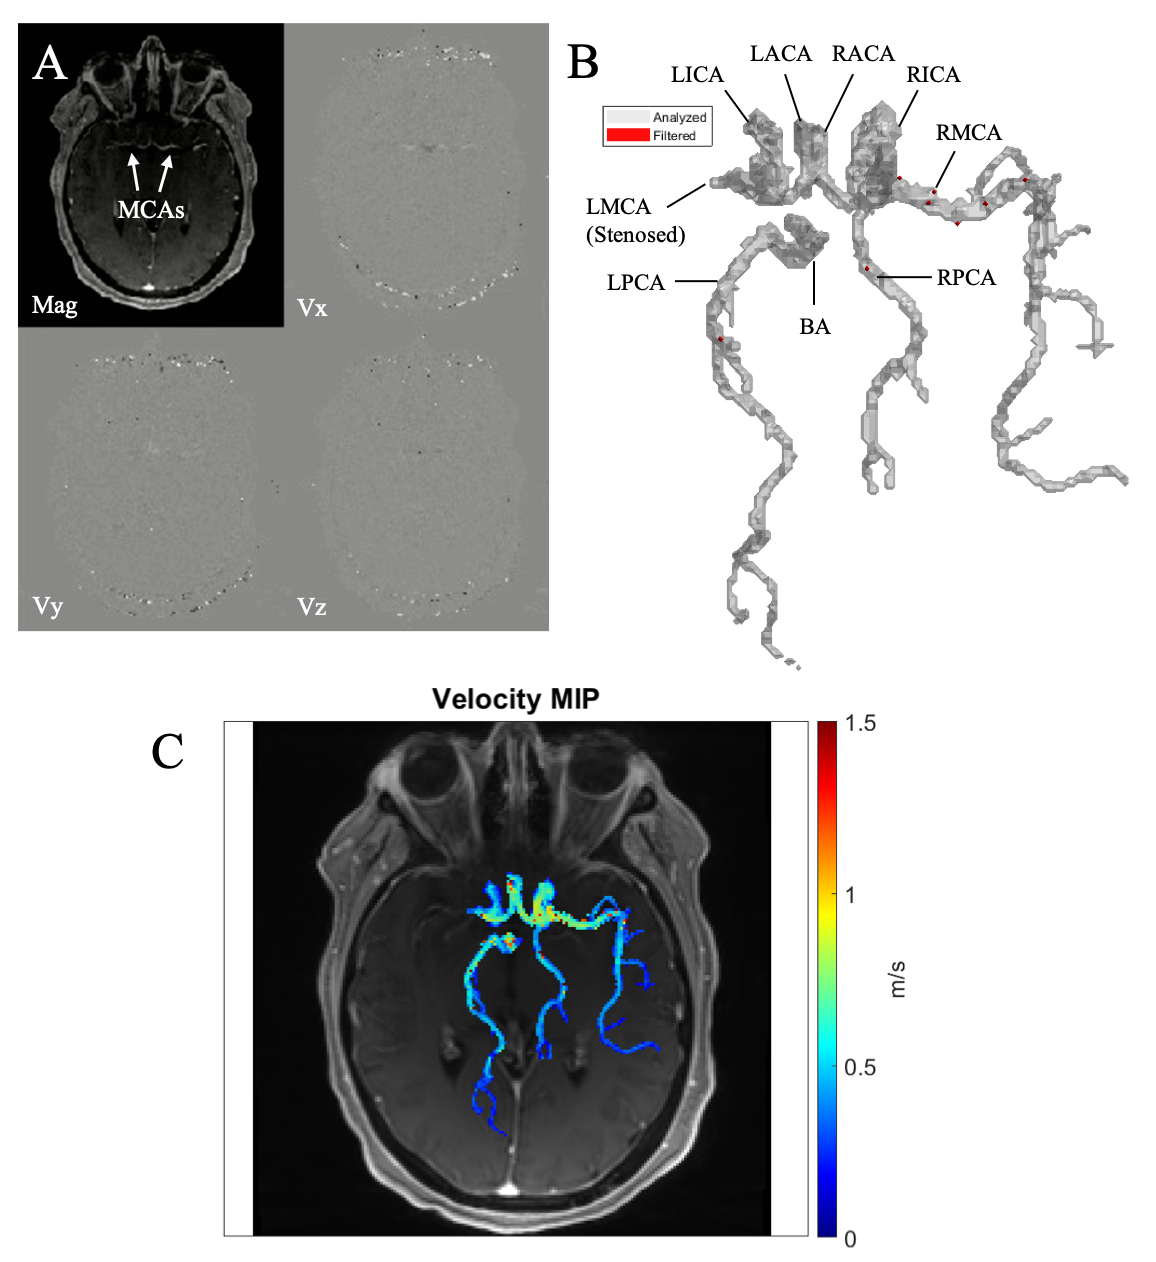
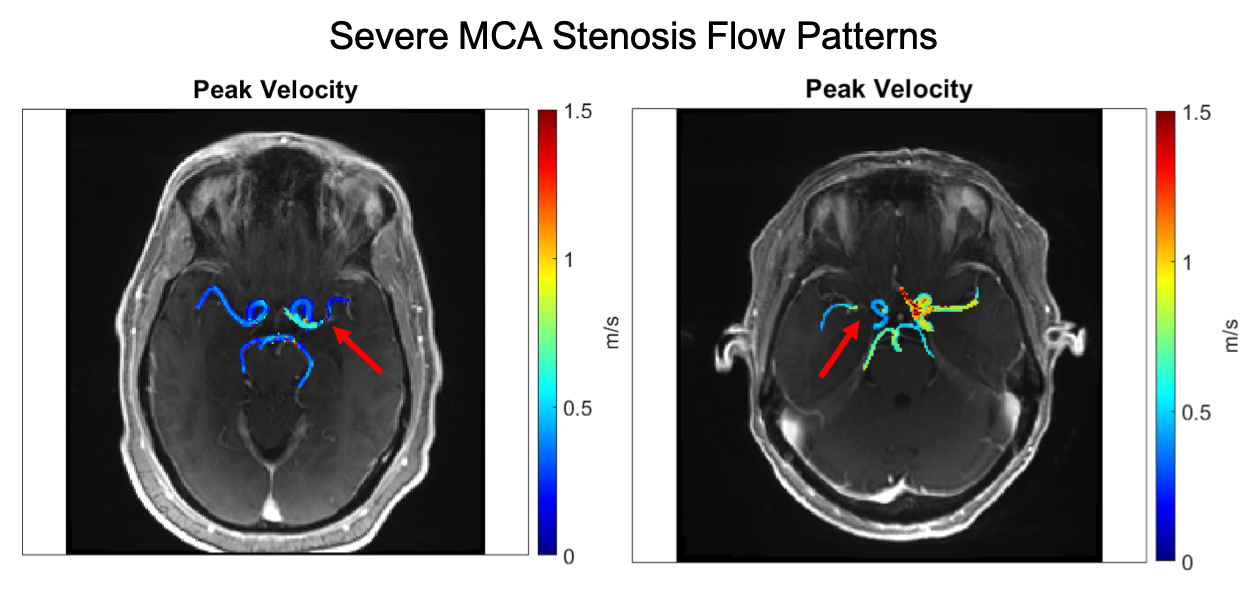
All 4D flow data were corrected for Maxwell fields during reconstruction16. Eddy current, noise17, and velocity aliasing were corrected with in-house software tools18. A time-averaged 3D phase contrast angiogram (PC-MRA) was calculated to depict vessel anatomy. The CoW and vessels were manually segmented from the PC-MRA using dedicated software (Mimics Innovation Suite, Materialise, Leuven, Belgium, Figure 1A-B). The 3D CoW segmentation was used to mask the 4D flow data and derive parametric peak velocity maps using in-house analysis tools (MATLAB, MathWorks, Natick, MA) similar to a previously used workflow19 adapted for intracranial analysis. For each voxel within the CoW segmentation, absolute velocity v(t) was determined at each cardiac timepoint and the systolic time frames of the cardiac cycle were used to quantify PV. The resulting CoW peak velocity distribution was visualized as a maximum intensity projection (MIP) with anatomic background from the 4D flow magnitude data (Figure 1C). Data analysis further included quantification of global and regional intracranial asymmetry ratio difference (ARD) comparing PV of affected vs unaffected hemispheres (in ICAD) or left vs right hemisphere (in controls, with expected ARD of 1 showing symmetric values). To account for different hemodynamic compensation scenarios (Figure 2), ARD was calculated as follows:
$$ Asymmetry\,Ratio\,Difference = \left|\frac{PV_{Affected}}{PV_{Unaffected}} - 1 \right| $$
Results
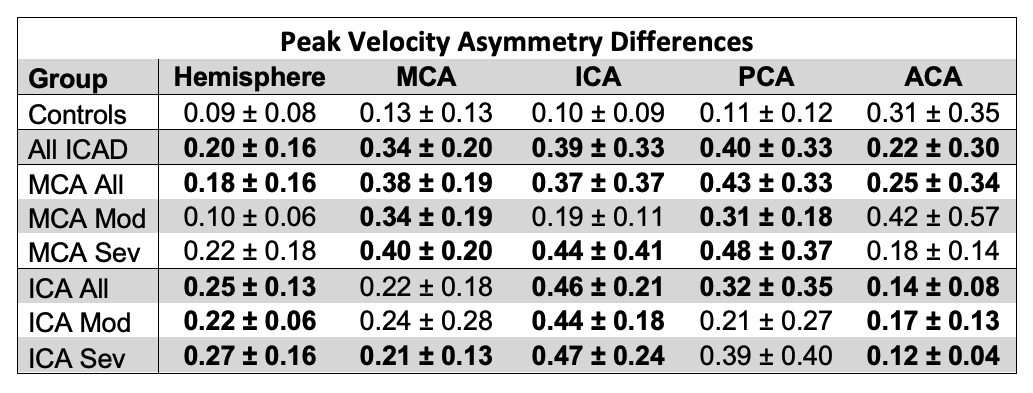
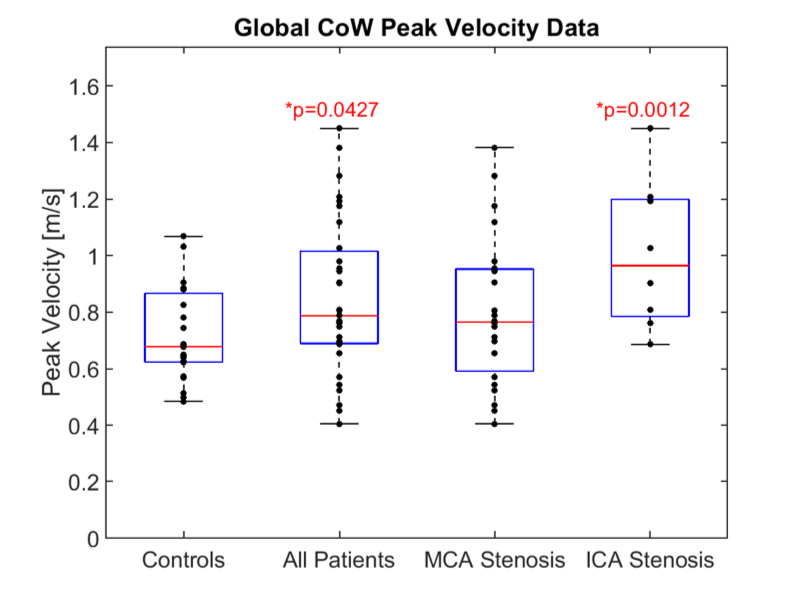
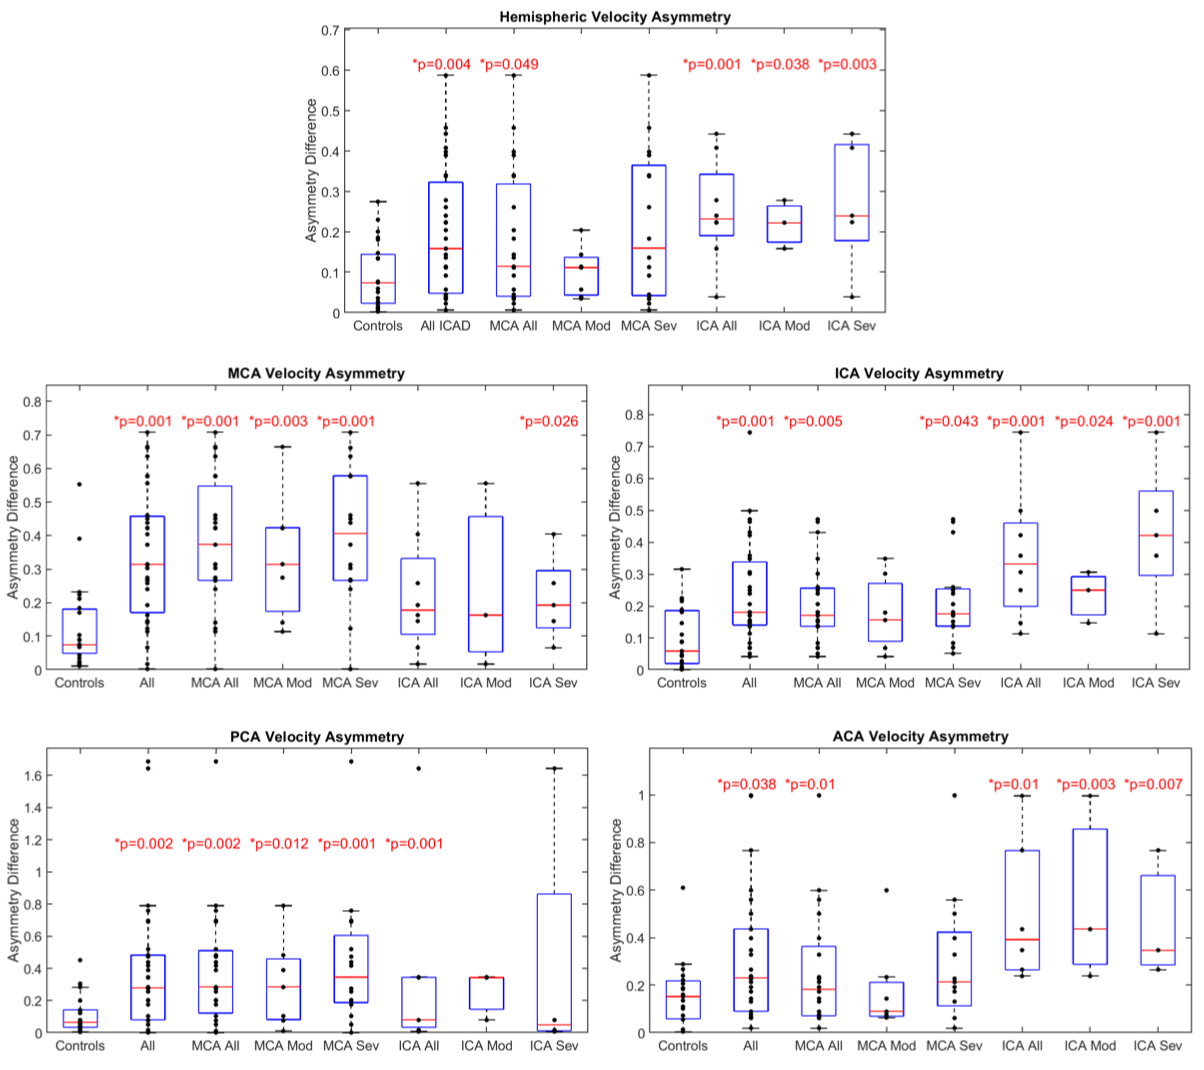
Global CoW PV was significantly elevated (Fig. 3) in all patients and ICA stenosis patients compared to controls (All: 0.85 ± 0.27 m/s, p = 0.043; MCA Stenosis: 0.80 ± 0.26 m/s, p = 0.22; ICA Stenosis: 1.00 ± 0.26 m/s, p = 0.001; vs controls: 0.72 ± 0.16 m/s).Asymmetry analysis results (Table 1; Fig. 4) demonstrated significantly increased ARD for all ICAD patients in brain hemispheres and for individual vessels. Similar to previous studies, in the moderate MCA stenosis group, PVs in both hemispheres, ICAs, and ACAs were not significantly elevated, indicating only minor impact of these ICAD lesions on changes in global velocity destitution in the CoW. In contrast, patients with severe MCA ICAD showed substantial PV asymmetry in the MCAs, ICAs, and PCAs, evidence for the systemic effect of these focal ICAD stenoses on redistribution of intracranial flow velocities (Fig 2). Both moderate and severe ICA stenosis had similar effects on ARD at both the vessel and hemisphere levels.
Discussion and Conclusion
These findings demonstrate the feasibility of the intracranial peak velocity mapping workflow for the intuitive visualization and quantification of ICAD impact on global and regional distribution of peak velocities in the entire CoW. For ICAD patients with severe MCA or moderate to severe ICA stenosis, the majority of CoW vessel segments showed elevated peak velocity asymmetry, indicating a marked effect of these focal lesions on the distribution of intracranial velocities. Our study did not consider other hemodynamic measures, such as flow, pressure differences, or kinetic energy, that would be needed for a more complete characterization of CoW hemodynamics in ICAD. Further, manual 3D segmentation of the CoW is time-consuming. Future studies could integrate these measures and examine the automation of analysis for efficient hemodynamic analysis in larger cohorts.Acknowledgements
This work was funded by the National Institute of Health (NIH NIA P30AG059988, NIH 1R01HL149787, NIH 1R21NS122511).References
1. Bos D, Van Der Rijk MJM, Geeraedts TEA, et al. Intracranial carotid artery atherosclerosis: Prevalence and risk factors in the general population. Stroke. 2012;43(7):1878-1884. doi:10.1161/STROKEAHA.111.6486672.
2. Wong LKS. Global Burden of Intracranial Atherosclerosis. Int J Stroke. 2006;1(3):158-159. doi:doi:10.1111/j.1747-4949.2006.00045.x3.
3. White H, Boden-Albala B, Wang C, et al. Ischemic stroke subtype incidence among whites, blacks, and Hispanics: The northern Manhattan study. Circulation. 2005;111(10):1327-1331. doi:10.1161/01.CIR.0000157736.19739.D04.
4. Marks MP. Is there a future for endovascular treatment of intracranial atherosclerotic disease after Stenting and Aggressive Medical Management for Preventing Recurrent Stroke and Intracranial Stenosis (SAMMPRIS)? Stroke. 2012;43(2):580-584. doi:10.1161/STROKEAHA.111.6455075.
5. Mazighi M, Labreuche J, Gongora-Rivera F, Duyckaerts C, Hauw JJ, Amarenco P. Autopsy prevalence of intracranial atherosclerosis in patients with fatal stroke. Stroke. 2008;39(4):1142-1147. doi:10.1161/STROKEAHA.107.4965136.
6. Aristova M, Vali A, Ansari SA, et al. Standardized Evaluation of Cerebral Arteriovenous Malformations Using Flow Distribution Network Graphs and Dual-venc 4D Flow MRI. J Magn Reson Imaging. 2019;50(6):1718-1730. doi:10.1002/jmri.267847.
7. Wu C, Schnell S, Vakil P, et al. In vivo assessment of the impact of regional intracranial atherosclerotic lesions on brain arterial 3D hemodynamics. Am J Neuroradiol. 2017;38(3):515-522. doi:10.3174/ajnr.A50518.
8. Vali A, Aristova M, Vakil P, et al. Semi‐automated analysis of 4D flow MRI to assess the hemodynamic impact of intracranial atherosclerotic disease. Magn Reson Med. 2019;82(2):749-762. doi:10.1002/mrm.277479.
9. Schnell S, Ansari SA, Vakil P, et al. Three-dimensional hemodynamics in intracranial aneurysms: Influence of size and morphology. J Magn Reson Imaging. 2014;39(1):120-131. doi:10.1002/jmri.2411010.
10. Moore J, Aristova M, Abdalla R, et al. Cerebrovascular dual-venc 4D flow MRI: Assessment of arterial pulsatility and resistance measures in intracranial atherosclerotic disease. 29th Int Soc Magn Reson Med. 2021.11.
11. Wåhlin A, Eklund A, Malm J. 4D flow MRI hemodynamic biomarkers for cerebrovascular diseases. J Intern Med. 2021:1-13. doi:10.1111/joim.1339212.
12. Schnell S, Ansari SA, Wu C, et al. Accelerated dual- venc 4D flow MRI for neurovascular applications. J Magn Reson Imaging. 2017;46(1):102-114. doi:10.1002/jmri.2559513.
13. Chimowitz MI, Lynn MJ, Howlett-Smith H, et al. Comparison of Warfarin and Aspirin for Symptomatic Intracranial Arterial Stenosis. N Engl J Med. 2005;352(13):1305-1316. doi:10.1056/nejmoa04303314. Samuels OB, Joseph GJ, Lynn MJ, Smith HA, Chimowitz MI. A standardized method for measuring intracranial arterial stenosis. Am J Neuroradiol. 2000;21(4):643-646.15.
14. Jung B, Ullmann P, Honal M, Bauer S, Hennig J, Markl M. Parallel MRI with extended and averaged GRAPPA kernels (PEAK-GRAPPA): Optimized spatiotemporal dynamic imaging. J Magn Reson Imaging. 2008;28(5):1226-1232. doi:10.1002/jmri.2156116.
15. Bernstein MA, Zhou XJ, Polzin JA, et al. Concomitant gradient terms in phase contrast MR: Analysis and correction. Magn Reson Med. 1998;39(2):300-308. doi:10.1002/mrm.191039021817.
16. Walker PG, Cranney GB, Scheidegger MB, Waseleski G, Pohost GM, Yoganathan AP. Semiautomated method for noise reduction and background phase error correction in MR phase velocity data. J Magn Reson Imaging. 1993;3(3):521-530. doi:10.1002/jmri.188003031518.
17. Bock J, Kreher BW, Hennig J, Markl M. Optimized pre-processing of time-resolved 2D and 3D Phase Contrast MRI data. Proc Intl Soc Mag Reson Med. 2007;15:3138.19.
18. Jarvis K, Pruijssen JT, Son AY, et al. Parametric Hemodynamic 4D Flow MRI Maps for the Characterization of Chronic Thoracic Descending Aortic Dissection. J Magn Reson Imaging. 2019;51(5):1357-1368. doi:10.1002/jmri.26986
Figures