2311
Regional coupling of macrovascular flow velocity and cerebrovascular reactivity amplitude and delay in healthy adolescents1Physical Therapy and Human Movement Sciences, Feinberg School of Medicine, Northwestern University, Chicago, IL, United States, 2Biomedical Engineering, McCormick School of Engineering and Applied Sciences, Northwestern University, Evanston, IL, United States, 3Radiology, Feinberg School of Medicine, Northwestern University, Chicago, IL, United States, 4Ann & Robert H. Lurie Children’s Hospital of Chicago, Chicago, IL, United States
Synopsis
Keywords: Blood vessels, Velocity & Flow, 4D flow
In a preliminary sample of healthy adolescents, we evaluated the relationship between hemodynamic function in large cerebral arteries and smaller cortical vessels. Specifically, we investigated correlations between 4D flow MRI-derived systolic blood velocity in the anterior, middle, and posterior cerebral arteries and BOLD cerebrovascular reactivity (CVR) in associated vascular territories. Both the amplitude and delay of CVR were negatively correlated with systolic velocity. These results provide new insights into the mechanism of CVR and measures of macrovascular flow, but more work is needed to better understand these relationships. Our work establishes important normative data for future comparisons in cerebrovascular pathology.Introduction
A common clinical assessment of cerebral hemodynamics involves transcranial Doppler ultrasonography or 2D phase-contrast MRI to measure blood velocity in large arteries proximal to the Circle of Willis (CoW)1. An advanced 4D flow MRI technique has also enabled assessment of 3D blood velocity throughout the CoW in one acquisition2. Cerebrovascular reactivity (CVR) mapping with BOLD fMRI is an important indicator of hemodynamic function3, particularly in small cortical blood vessels4, and is increasingly utilized in research and clinical applications. Both CVR and blood velocity are indicative of cerebral blood flow regulation, though they represent different physiological mechanisms within the vascular tree. It is unknown how these metrics relate to each other in healthy individuals.We propose a novel combination of cerebrovascular MRI methods to simultaneously assess blood flow within large arteries with dual-venc 4D flow MRI2 and in smaller, downstream vessels with BOLD CVR5. We aimed to evaluate the regional relationship between blood velocity and CVR (both amplitude and delay) in healthy adolescents to establish a baseline for future comparison in pediatric pathology and to better understand the relationship between macrovascular velocity and microvascular CVR. We hypothesized that CVR delay, but not amplitude, would correlate with blood velocity, based on previous data demonstrating poor correlation between blood velocity and cortical perfusion6,7.
Methods
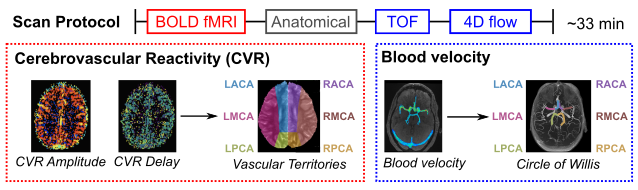
Data: 5 healthy adolescents (4F, 11-18y) underwent MRI scans on a 3T Siemens PrismaFit (Fig1). Participants completed 3 cycles of an end-expiration breath-hold task followed by resting-state (7 minutes)8 during a multi-band multi-echo BOLD fMRI acquisition (TR=1.5s, TEs=10.8/28.03/45.26/62.49/79.72ms, MB factor=4, 2.5mm isotropic voxels). A respiration belt (BIOPAC) recorded chest position. Medical tape was placed across the forehead to minimize head motion9. Dual-venc 4D flow MRI4 was also acquired (TR=5.9ms, TE=3.3ms, flip angle=15°, low venc=0.8m/s, high venc=1.6m/s, 1mm isotropic voxels, temporal resolution=82.6ms, scan time=10-12 minutes).CVR Maps: Multi-echo fMRI data were co-registered to the first echo single-band reference image and optimally combined10,11. Respiration volume per time (RVT) was computed12, convolved with the respiration response function13, and z-normalized. Voxelwise estimates of CVR amplitude and delay were obtained using a lagged-GLM framework with RVT as the regressor of interest8,14–16. CVR delay values were recentered to the gray matter median.
4D Flow MRI Parametric Maps: Data were preprocessed with correction for Maxwell terms, eddy currents, noise-masking of areas outside flow regions, and velocity anti-aliasing17,18. The CoW was segmented from the 3D phase-contrast angiogram and used to mask 4D flow data. Voxelwise calculation of median systolic velocity was performed using a previously described parametric mapping workflow adapted for intracranial analysis19.
CVR-Velocity Comparisons: A vascular territories atlas20,21 was transformed to subject space. Median CVR amplitude and delay were calculated in left and right anterior, middle, and posterior cerebral artery territories (ACA, MCA, PCA, respectively). Median systolic velocity was computed within a volumetric ROI for each artery on the parametric map. Within-subject Pearson correlations were computed between systolic velocity and CVR amplitude or delay in the corresponding territory (Fig1). Linear mixed-effects models were implemented with CVR amplitude and delay as dependent variables, systolic velocity (group-mean-centered) in the supplying artery as a fixed effect, and subject as a random effect.
Results
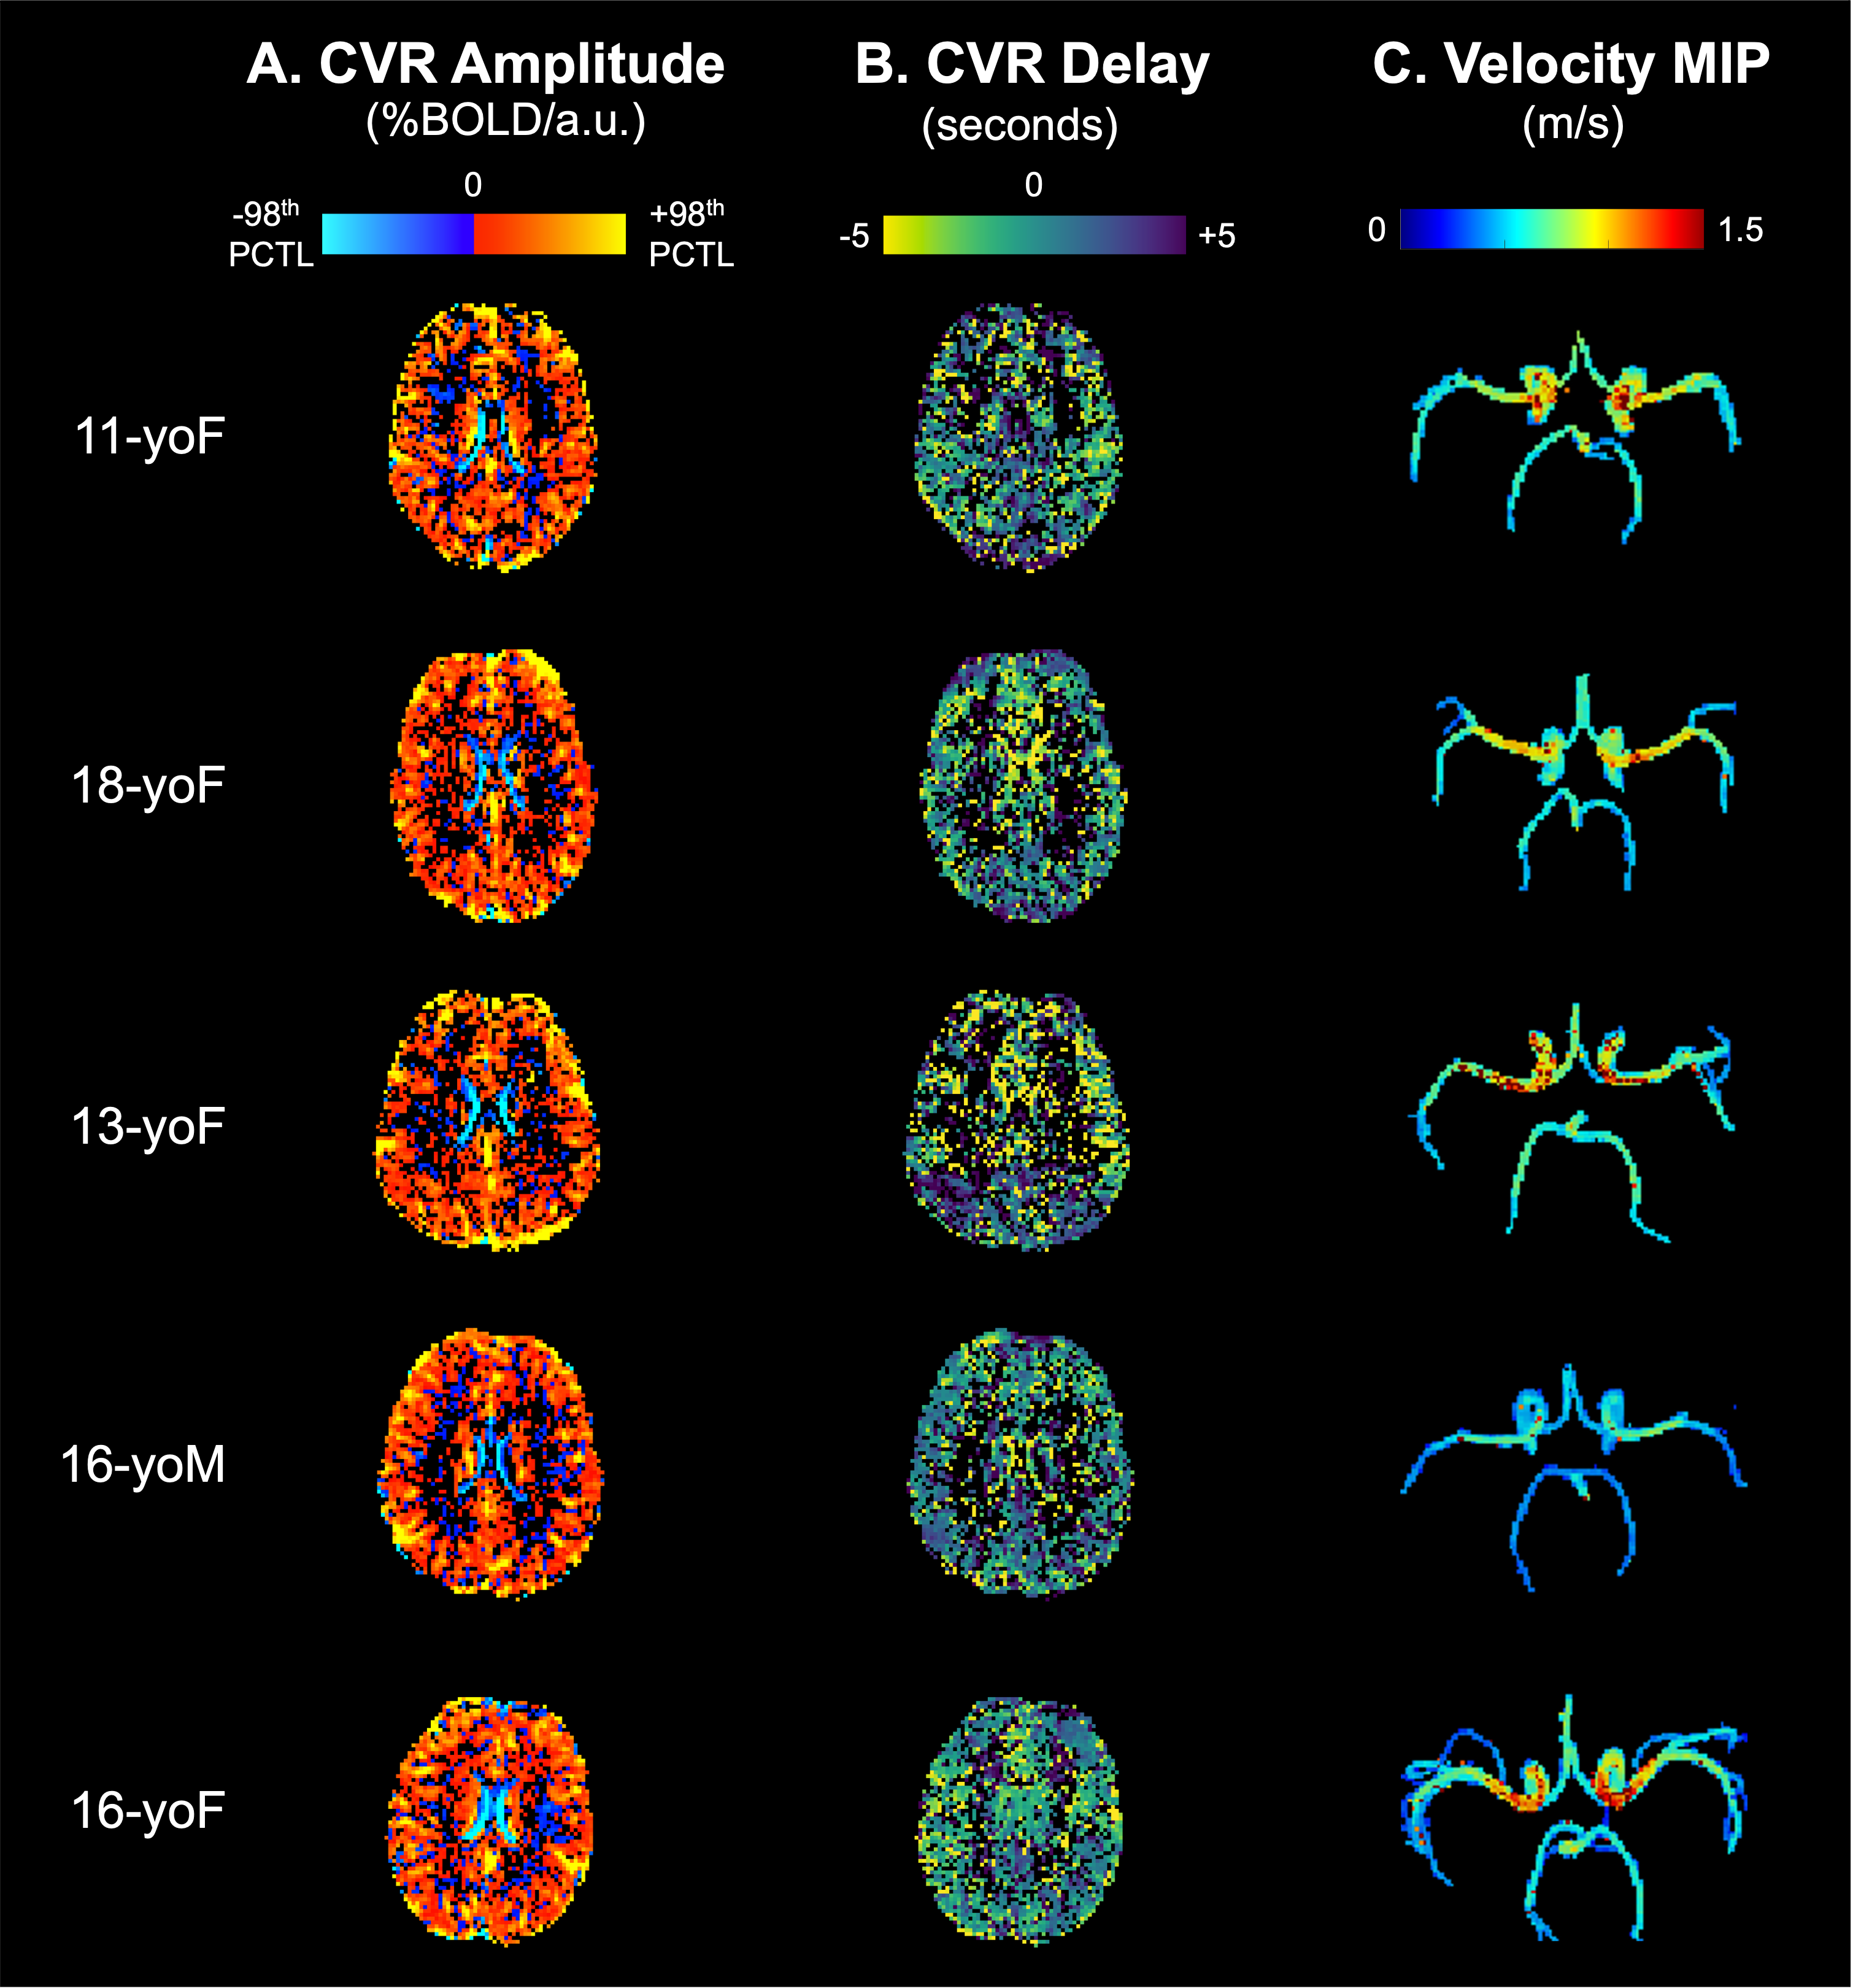
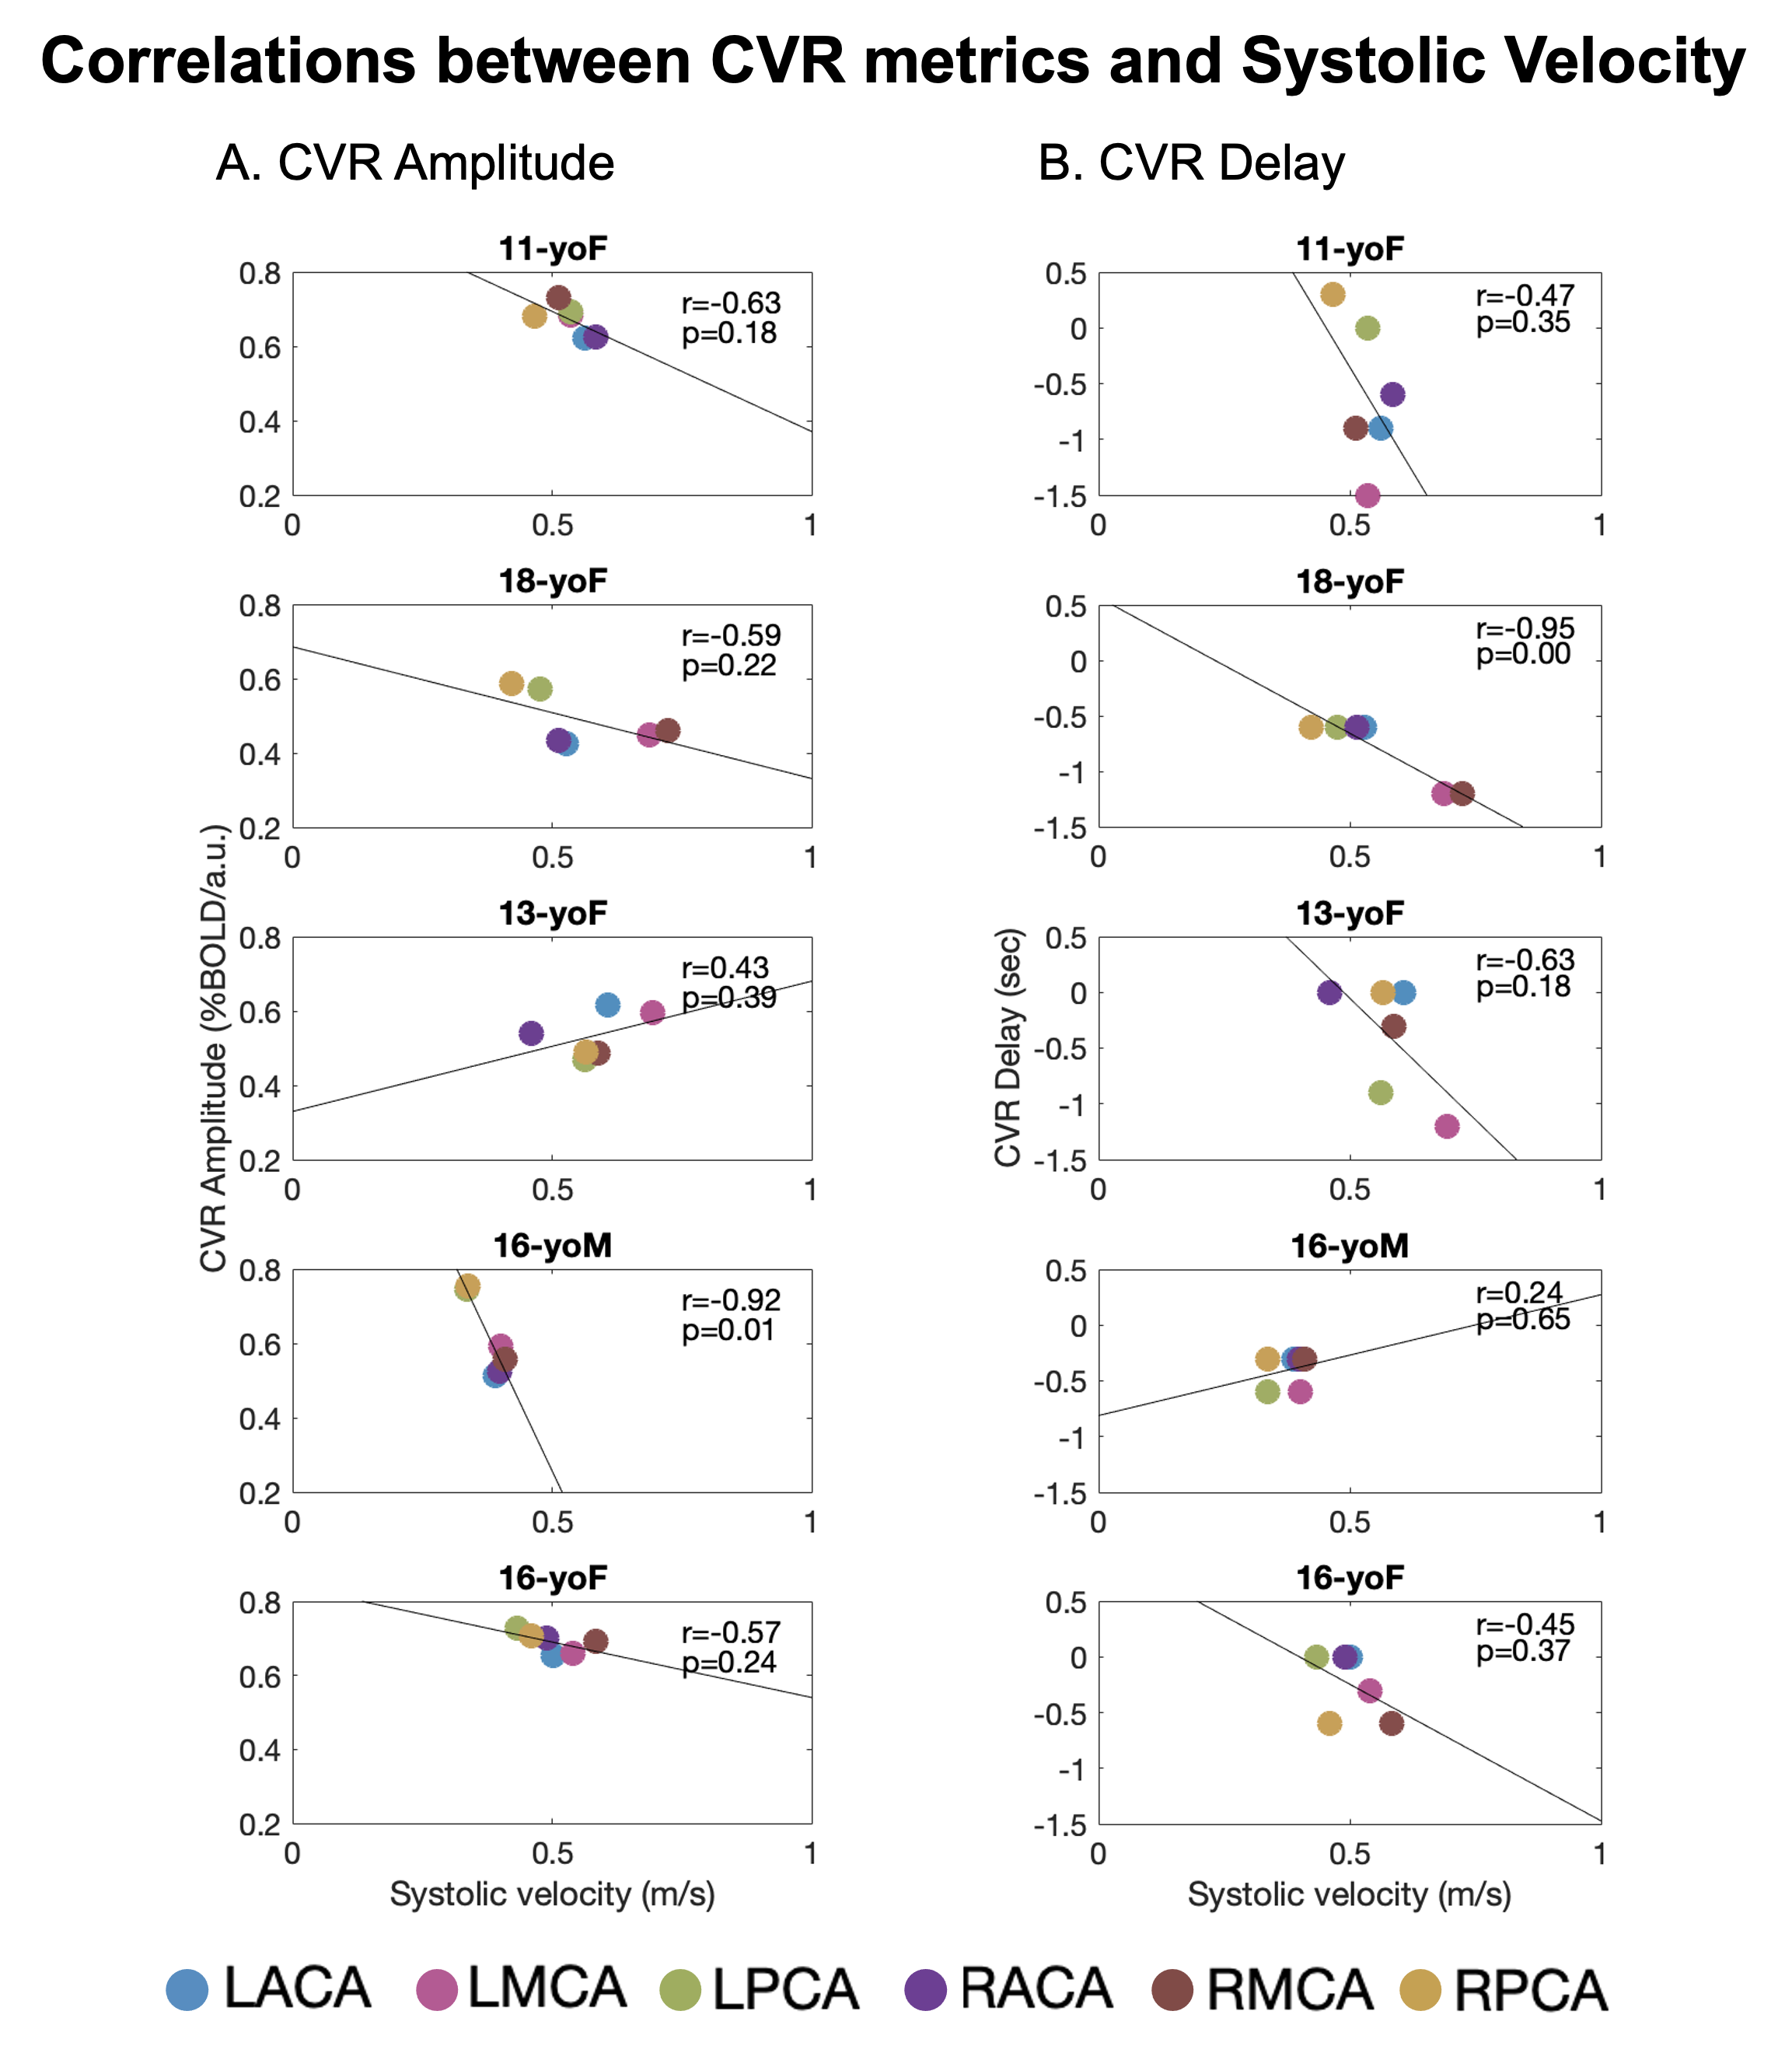
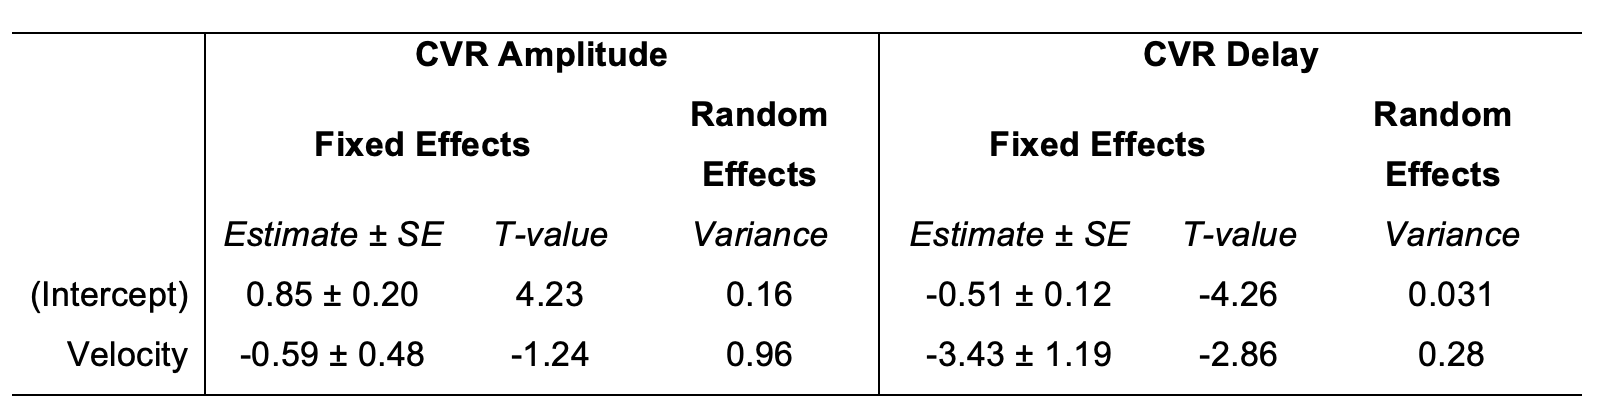
CVR amplitude and delay maps showed similar spatial variation between subjects, after statistical thresholding and normalization (Fig2). Maximum intensity projection (MIP) velocity maps followed expected patterns, with highest velocity in MCAs. In general, there was a negative relationship between systolic velocity and each CVR metric within subjects (Fig3). In arteries with higher systolic velocity, CVR amplitude was lower and CVR delay was more negative (earlier relative to the median in gray matter). However, the strength and direction of the correlations were variable. Linear mixed-effects models (Table1) confirmed this trend across participants, with negative slope estimates for the fixed effect of velocity on CVR metrics. Velocity was more consistently related with CVR delay than CVR amplitude, indicated by lower error in the slope estimate and lower subject variance.Discussion
In a sample of healthy adolescents, we demonstrate a negative relationship between 4D flow MRI-derived systolic velocity in supplying cerebral arteries and both CVR amplitude and delay in the downstream vascular territory. However, the small number of data points in our correlations may overestimate the true relationship and are interpreted with caution. The negative relationship between velocity and CVR delay was consistent with our hypothesis; an earlier response to a vasoactive stimulus (e.g., elevated CO2 elicited from a breath-hold task) may reflect shorter transit times due to higher velocities or shorter vascular path length. The correlation between CVR amplitude and systolic velocity was unexpected and may not reflect a causal relationship. Future work will include total blood flow and resting cortical perfusion dynamics to investigate potential mediating factors.There are sources of variability that may limit the generalizability of these findings. CVR and velocity metrics are likely noisier in adolescents prone to increased head motion (e.g., 16yoM). Additionally, intracranial vessel morphology23, perfusion24, and arterial velocities25 vary with age, particularly during development, and may increase variability in our sample. The normative data demonstrated here are important preliminary work for future investigations in cerebrovascular pathology. Our innovative protocol combining macrovascular and microvascular hemodynamics may offer advantages over current clinical neurovascular assessments.
Acknowledgements
Research reported in this publication was supported by the National Heart, Lung, And Blood Institute of the National Institutes of Health under Award Number F31HL166079. Additional support was provided by the National Institute on Aging under Award Number P30AG059988. The content is solely the responsibility of the authors and does not necessarily represent the official views of the National Institutes of Health. The authors would like to thank staff at the Center for Translational Imaging at Northwestern University for their support with data collection.
References
1. Macdonald ME, Frayne R. Cerebrovascular MRI: a review of state-of-the-art approaches, methods and techniques. NMR Biomed 2015;28:767–91. https://doi.org/10.1002/NBM.3322.
2. Schnell S, Ansari SA, Wu C, Garcia J, Murphy IG, Rahman OA, et al. Accelerated dual-venc 4D flow MRI for neurovascular applications. J Magn Reson Imaging 2017;46:102–14. https://doi.org/10.1002/jmri.25595.
3. Sleight E, Stringer MS, Marshall I, Wardlaw JM, Thrippleton MJ. Cerebrovascular Reactivity Measurement Using Magnetic Resonance Imaging: A Systematic Review. Front Physiol 2021:643468. https://doi.org/10.3389/fphys.2021.643468.
4. Fisher JA, Venkatraghavan L, Mikulis DJ. Magnetic Resonance Imaging-Based Cerebrovascular Reactivity and Hemodynamic Reserve. Stroke 2018;49:2011–8. https://doi.org/10.1161/STROKEAHA.118.021012.
5. Fisher JA. VLMDJ. Magnetic Resonance Imaging–Based Cerebrovascular Reactivity and Hemodynamic Reserve A Review of Method Optimization and Data Interpretation 2018:2011–8. https://doi.org/10.1161/STROKEAHA.118.021012.
6. Croal PL, Leung J, Kosinski P, Shroff M, Odame I, Kassner A. Assessment of cerebral blood flow with magnetic resonance imaging in children with sickle cell disease: A quantitative comparison with transcranial Doppler ultrasonography. Brain Behav 2017;7:e00811. https://doi.org/10.1002/brb3.811.
7. Hartmann A, Ries F, Tsuda Y, Lagrèze H, Seiler R, Grolimund P. Correlation of regional cerebral blood flow and blood flow velocity in normal volunteers and patients with cerebro-vascular disease. Neurochirurgia (Stuttg) 2008;34:6–13. https://doi.org/10.1055/S-2008-1052048.
8. Stickland RC, Zvolanek KM, Moia S, Ayyagari A, Caballero-Gaudes C, Bright MG. A practical modification to a resting state fMRI protocol for improved characterization of cerebrovascular function. Neuroimage 2021;239:118306. https://doi.org/10.1016/j.neuroimage.2021.118306.
9. Krause F, Benjamins C, Eck J, Lührs M, Hoof R, Goebel R. Active head motion reduction in magnetic resonance imaging using tactile feedback. Hum Brain Mapp 2019;40:4026–37. https://doi.org/10.1002/hbm.24683.
10. Posse S, Wiese S, Gembris D, Mathiak K, Kessler C, Grosse-Ruyken M-L, et al. Enhancement of BOLD-Contrast Sensitivity by Single-Shot Multi-Echo Functional MR Imaging. Magn Reson Med 1999;42:87–97. https://doi.org/10.1002/(SICI)1522-2594(199907)42:1.
11. DuPre E, Salo T, Ahmed Z, Bandettini PA, Bottenhorn KL, Caballero-Gaudes C, et al. TE-dependent analysis of multi-echo fMRI with *tedana*. J Open Source Softw 2021;6:3669. https://doi.org/10.21105/JOSS.03669.
12. Birn RM, Diamond JB, Smith MA, Bandettini PA. Separating respiratory-variation-related fluctuations from neuronal-activity-related fluctuations in fMRI. Neuroimage 2006;31:1536–48. https://doi.org/10.1016/j.neuroimage.2006.02.048.
13. Birn RM, Smith MA, Jones TB, Bandettini PA. The respiration response function: The temporal dynamics of fMRI signal fluctuations related to changes in respiration. Neuroimage 2008;40:644–54. https://doi.org/10.1016/j.neuroimage.2007.11.059.
14. Moia S, Stickland RC, Ayyagari A, Termenon M, Caballero-Gaudes C, Bright MG. Voxelwise optimization of hemodynamic lags to improve regional CVR estimates in breath-hold fMRI. Proc Annu Int Conf IEEE Eng Med Biol Soc EMBS 2020;2020-July:1489–92. https://doi.org/10.1109/EMBC44109.2020.9176225.
15. Moia S, Termenon M, Uruñuela E, Chen G, Stickland RC, Bright MG, et al. ICA-based denoising strategies in breath-hold induced cerebrovascular reactivity mapping with multi echo BOLD fMRI. Neuroimage 2021;233:117914. https://doi.org/10.1016/J.NEUROIMAGE.2021.117914.
16. Zvolanek KM, Moia S, Stickland RC, Caballero-Gaudes C, Bright MG. Respiration volume per time (RVT) as a surrogate for end-tidal CO2 to map hemodynamic lag with BOLD fMRI. Int Soc Magn Reson Med 31st Annu Meet Exhib 2022.
17. Bernstein MA, Zhou XJ, Polzin JA, King KF, Ganin A, Pelc NJ, et al. Concomitant gradient terms in phase contrast MR: Analysis and correction. Magn Reson Med 1998;39:300–8. https://doi.org/10.1002/MRM.1910390218.
18. Walker PG, Cranney GB, Scheidegger MB, Waseleski G, Pohost GM, Yoganathan AP. Semiautomated method for noise reduction and background phase error correction in MR phase velocity data. J Magn Reson Imaging 1993;3:521–30. https://doi.org/10.1002/JMRI.1880030315.
19. Jarvis K, Pruijssen JT, Son AY, Allen BD, Soulat G, Vali A, et al. Parametric Hemodynamic 4D Flow MRI Maps for the Characterization of Chronic Thoracic Descending Aortic Dissection. J Magn Reson Imaging 2020;51:1357–68. https://doi.org/10.1002/JMRI.26986.
20. Schirmer MD, Giese A-K, Fotiadis P, Etherton MR, Cloonan L, Viswanathan A, et al. Vascular Territory template and atlases in MNI space 2019. https://doi.org/10.5281/ZENODO.3379848.
21. Schirmer MD, Giese AK, Fotiadis P, Etherton MR, Cloonan L, Viswanathan A, et al. Spatial Signature of White Matter Hyperintensities in Stroke Patients. Front Neurol 2019;10:208. https://doi.org/10.3389/FNEUR.2019.00208/BIBTEX.
22. Helton KJ, Glass JO, Reddick WE, Paydar A, Zandieh AR, Dave R, et al. Comparing segmented ASL perfusion of vascular territories using manual versus semiautomated techniques in children with sickle cell anemia. J Magn Reson Imaging 2015;41:439–46. https://doi.org/10.1002/JMRI.24559.
23. Quon JL, Mouches P, Kim LH, Jabarkheel R, Zhang Y, Steinberg GK, et al. Age-dependent Intracranial Artery Morphology in Healthy Children. Clin Neuroradiol 2022;32:49–56. https://doi.org/10.1007/s00062-021-01071-9.
24. Leung J, Kosinski PD, Croal PL, Kassner A. Developmental trajectories of cerebrovascular reactivity in healthy children and young adults assessed with magnetic resonance imaging. J Physiol 2016;594:2681–9. https://doi.org/10.1113/JP271056.
25. Bode H, Wais U. Age dependence of flow velocities in basal cerebral arteries. Arch Dis Child 1988;63:606–11. https://doi.org/10.1136/adc.63.6.606.
Figures