2308
MRI derived pulse wave indexes of the middle cerebral arteries1Cornell University, Ithaca, NY, United States, 2Weill Cornell Medicine, New York, NY, United States
Synopsis
Keywords: Blood vessels, Vessels, Pulsatility, Pulse waves
The pulse pressure wave has been used as a marker for cardiovascular health but cannot be measured easily within the brain. We have developed an MRI protocol to image, track, and process intracranial pulse waves of the middle cerebral artery. The protocol allows for the estimation of pulsatility along the MCA and extends the estimation of standard pulse waveform indexes that are normally being used in the periphery to the brain. The reliability and reproducibility of this protocol is being tested on normal subjects and subjects with mild cognitive impairment.
Introduction
The pulse pressure wave is widely being used as an indicator of cardiovascular health but cannot be measured easily within the brain. In the ageing brain, decreasing vascular compliance can lead to a diminished absorption of pulse pressure1-5 with potentially harmful consequences on large (hemorrhagic stroke) and small scales (microbleeds). In addition, the pressure gradient caused by arterial pulsatility could be a driving force in the brain’s paravascular waste clearance system6-9.In order to study pulse waves, which can be significantly faster than blood flow velocity, we used the method of MRI hypersampling by analytic phase projection (APP)10,11. Based on this method, we developed an MRI imaging and data analysis protocol to image and track arterial pulse waves of the middle cerebral artery (MCA), and to extend the estimation of standard pulse wave indexes that are normally being used in the periphery to the brain.
This methodology is applied to an exploratory study of elderly subjects with and without mild cognitive impairment (MCI) and Alzheimer’s disease (AD).
Methods
ImagingN = 40 elderly subjects (26 female, age = 70 ± 8 years, 9 with a diagnosis of MCI or MCI/AD, 4 of them female) were imaged using a 3 Tesla MRI scanner with a multiband EPI sequence with TR = 0.9 s and NT = 250 repeats. The study was approved by the IRB of Weill Cornell Medicine.
Analysis step 1: Pulse amplitude maps
The fast pulse waves traversing the brain cannot be resolved with typical EPI sampling rates. The method of APP is a generalization of retrospective gating, in which the assumption of a linear phase evolution during each cardiac cycle is being abandoned. The phases are computed from the analytic extension of the pulse signal via the Hilbert transform. The task is then to project the NT MRI sampling times onto their corresponding phases, as
APP: x(ti) → xAPP (Φi).
The final step is a low-pass filter to obtain a smooth signal estimate x’APP(Φ) with an effective sampling interval of ΔTeff = T/NT, where T = signal pseudo period. The effective sampling interval typically has a duration of just a couple of milliseconds. This high sampling rate allows for an analysis of the pulse waveforms.
Pulse waveforms were computed for all subjects and from those, maximum intensity projections (MIPs) were created (Figure 1A).
Analysis step 2: Arterial tracking
For tracking the MCA from the pulse wave amplitudes, a reinforcement learning algorithm based on the Bellman equation12-14 was used. First, from the MIPs, start and end points on the middle cerebral artery were selected. The intermediate points on the MCA (overlay in Figure 1A) were tracked by a value-iteration solution of the Bellman equation.
Pulse wave profiles were created by stacking all foot-to-foot phase-normalized waveforms vertically and color coding their values (Figure 1B). Waveforms were averaged for further pulse wave index estimation (Figure 1C).
Analysis step 3: Pulse wave indexes
Pulse wave indexes were estimated from the first averaged 11 pulse waves on the apex of the MCA visible in an axial MIP view (Figure 1A) by using the PulseAnalyse software of Charlton et al.15,16. Some of the selected 30 estimated indexes are shown in Figure 2. To test for an effect of diagnosis, a multivariate regression on each index was performed with the covariates age, gender, and diagnosis.
Results
Pulse amplitude maps, the tracked MCA, pulse wave profiles, and pulse waveforms are shown in Figure 1 for a single subject. Pulse waveforms change with position on the MCA, and we observed a wide variation of pulse waveforms in the MCA across subjects. Using the software of Charlton et al.15,16, characteristic features such as a systolic upstroke and dicrotic notch were identified (Figure 2A). In half of the 80 waveforms (right and left hemisphere), the identified peak order was systole – dicrotic notch – diastole. In the other half of subjects, these identifiers were out of order (Figure 2B). This happens if the highest peak is not the first one in the phase of the cardiac cycle. In four waveforms, the procedure did not converge to a result. Furthermore, subjects with a diagnosis of MCI or MCI/AD had a significantly larger diastolic area (Ad in Figure 2) than normal subjects (p = 0.02).Discussion and Conclusion
The MRI derived pulse waves might contain information about local and non-local (reflection) physical properties of the cerebrovascular system. They can be characterized by a set of pulse wave indexes, which are frequently used in applications in the aorta and arteries in the extremities17. We have observed a noteworthy variability of pulse wave shapes in the MCA. Our findings invite further studies of the origin of this variability. For example, whether the typical order of peaks, systole – dicrotic notch – diastole, is not found in all subjects due to wave reflection properties, non-cardiac effects such as vasomotion or vascular reactivity18, or due to estimation uncertainties, cannot be answered without further studies. The observed correlation between diastolic area and diagnosis of MCI could be interpreted as increased reflection from downstream vasculature but needs to be considered exploratory since significance has not been corrected for testing on multivariate responses19.Acknowledgements
This study was supported from NIH grant R01AG057848. HUV was partially supported by a grant from the Radiology Department of Weill Cornell. HUV filed a patent application related to the hypersampling method used in this manuscript.
References
1 Henry Feugeas, M. C. et al. Age-related cerebral white matter changes and pulse-wave encephalopathy: Observations with three-dimensional MRI. Magn. Reson. Imaging 23, 929-937 (2005).
2 Guyton, A. C. & Hall, J. E. Textbook of Medical Physiology. 11th edn (Saunders/Elsevier 2006).
3 Laurent, S. et al. Expert consensus document on arterial stiffness: methodological issues and clinical applications. Eur. Heart J. 27, 2588-2605 (2006).
4 O'Rourke, M. F. & Hashimoto, J. Mechanical factors in arterial aging: A clinical perspective. J Am Coll Cardiol 50, 1-13 (2007).
5 Tarumi, T. et al. Cerebral hemodynamics in normal aging: central artery stiffness, wave reflection, and pressure pulsatility. J Cerebr Blood F Met 34, 971-978 (2014).
6 Iliff, J. J. et al. A Paravascular pathway facilitates CSF flow through the brain parenchyma and the clearance of interstitial solutes, including amyloid beta. Sci. Transl. Med. 4 (2012).
7 Iliff, J. J. et al. Cerebral arterial pulsation drives paravascular CSF-interstitial fluid exchange in the murine brain. J. Neurosci. 33, 18190-18199 (2013).
8 Jessen, N. A., Munk, A. S. F., Lundgaard, I. & Nedergaard, M. The glymphatic system: A beginner's guide. Neurochem. Res. 40, 2583-2599 (2015).
9 Bacyinski, A., Xu, M. S., Wang, W. & Hu, J. N. The paravascular pathway for brain waste clearance: Current understanding, significance and controversy. Front. Neuroanat. 11 (2017).
10 Voss, H. U. Hypersampling of pseudo-periodic signals by analytic phase projection. Comput. Biol. Med. 98, 159-167 (2018).
11 Voss, H. U., Dyke, J. P., Ballon, D. J. & Gupta, A. MRI pulse wave profiles of cerebral arteries. Proceedings of the International Society for Magnetic Resonance in Medicine, 3247 ( 2019).
12 Bellman, R. Dynamic-programming and the numerical-solution of variational-problems. Oper. Res. 5, 277-288 (1957).
13 Bellman, R. On a routing problem. Quart. Appl. Math. 16, 87-90 (1958).
14 Sutton, R. S. & Barto, A. G. Reinforcement Learning: An Introduction. (MIT Press 1998).
15 Charlton, P. H., Celka, P., Farukh, B., Chowienczyk, P. & Alastruey, J. Assessing mental stress from the photoplethysmogram: a numerical study. Physiol. Meas. 39 (2018).
16 Charlton, P. H. et al. Modeling arterial pulse waves in healthy aging: a database for in silico evaluation of hemodynamics and pulse wave indexes. Am J Physiol-Heart C 317, H1062-H1085 (2019).
17 Gaddum, N. R., Alastruey, J., Beerbaum, P., Chowienczyk, P. & Schaeffter, T. A technical assessment of pulse wave velocity algorithms applied to non-invasive arterial waveforms. Ann. Biomed. Eng. 41, 2617-2629 (2013).
18 Liu, P. Y. et al. Multi-vendor and multisite evaluation of cerebrovascular reactivity mapping using hypercapnia challenge. NeuroImage 245 (2021).
19 Lazic, S. E. The problem of pseudoreplication in neuroscientific studies: is it affecting your analysis? Bmc Neurosci 11 (2010).
Figures
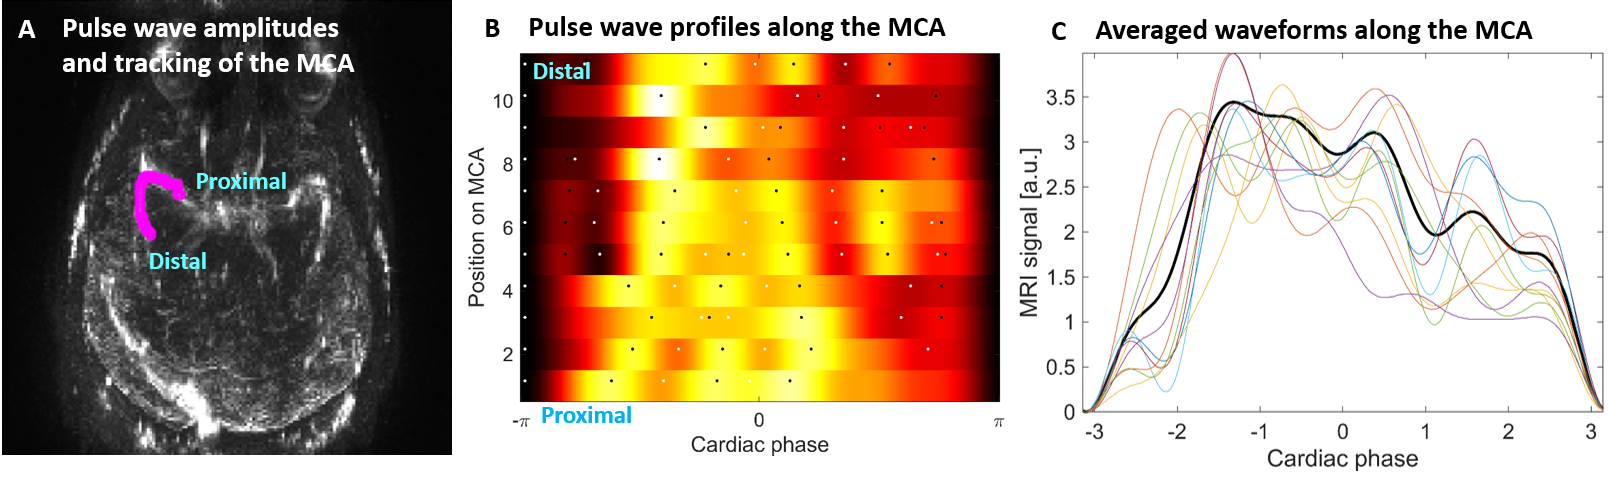
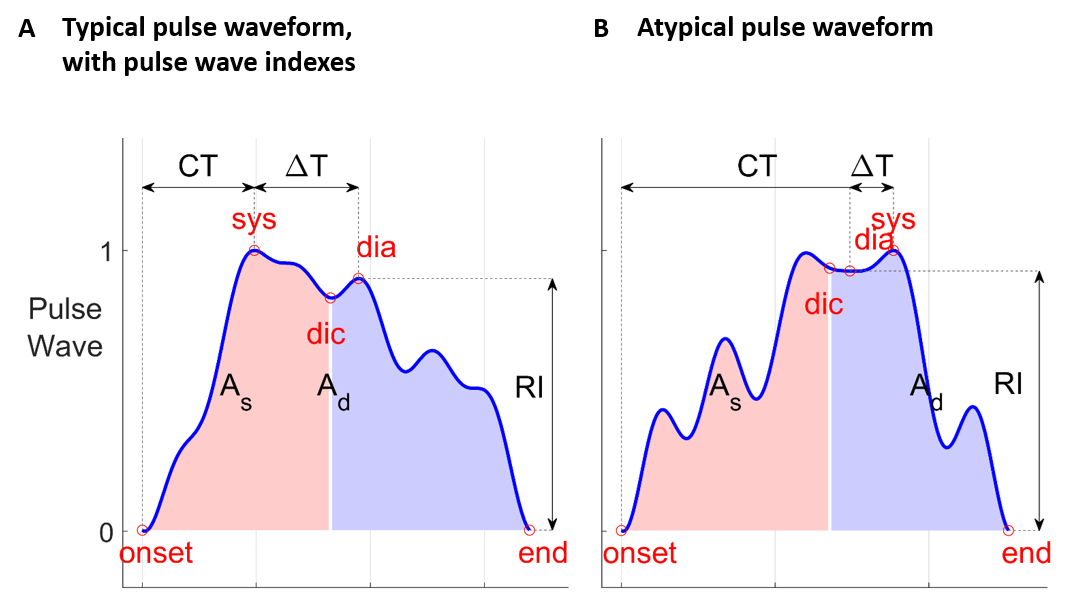
Figure 2: Estimation of pulse wave indexes. A Typical pulse waveform, same as Fig. 1C. sys, systole; dia, diastole; dic, dicrotic notch; As, systolic area; Ad, diastolic area; RI, reflection index; CT, crest time; ΔT, time between systolic and diastolic peaks. B An example for an atypical (and thus incorrectly labelled) waveform, in which the highest amplitude peak does not occur first in time. It is not clear whether this waveform is a result of increased reflection of the wave from the downstream vascular bed, or if it is dominated by noisy measurements or waveform estimation errors.