2307
Hormone-driven CBF and AAT changes across the menstrual cycle1Cardiff University Brain Research Imaging Centre (CUBRIC), School of Physics and Astronomy, Cardiff University, Cardiff, United Kingdom, 2Cardiff University Brain Research Imaging Centre (CUBRIC), School of Medicine, Cardiff University, Cardiff, United Kingdom
Synopsis
Keywords: Blood vessels, Arterial spin labelling
The current study investigated the influence of progesterone and oestrogen on cerebral blood flow (CBF) and arterial arrival time (AAT) across a menstrual cycle and multiple cortical and subcortical regions. 21 healthy female participants were scanned in a Siemens MAGNETOM Prisma 3T scanner and their bloods were taken to measure circulating hormones. Linear models found that while there was no interactive effect with region for either hormone, circulating oestrogen explained a significant portion of CBF value, while progesterone explained a significant portion of AAT value. Recommendations for future research are discussed.
Introduction
Oestrogen has a protective effect against neurodegenerative conditions, including dementia1,2 and glaucoma3. One possible mechanism for this is oestrogen’s influence on the cerebrovascular system. Animal models suggest that oestrogen has a vasodilatory influence4 and impacts vasoreactivity5 and blood flow6. Considering this, we therefore hypothesise that changes in hormone levels (specifically oestradiol and progesterone) across the menstrual cycle would influence Cerebral Blood Flow (CBF) and Arterial Arrival Time (AAT). This study aims to investigate the influence of hormonal fluctuations across a healthy menstrual cycle on measures of CBF and AAT across different cortical and subcortical regions.Methods
21 healthy, menstruating females (age median[IQR]=21.75[1.62] years) completed a 3T MRI session during the early follicular (EFP; day 1-4; N=17), late follicular (LFP; day 10-12; N=17), and mid-luteal (MLP; day 20-22; N=18) phase of their menstrual cycle (14 completed all three). All sessions took place at the same time of day, after a fasting period of 4-6 hours. Bloods were taken to measure circulating hormones.Data were acquired on a Siemens MAGNETOM Prisma 3T scanner with a 32-channel head coil. A multi post labelling delay pseudocontinuous arterial spin labelling (MPLD-pCASL) perfusion scan was completed (maximum TR=5.6s; TE=11s; voxel resolution=3.4x3.4x6.0mm, tag duration=1800, post-labelling delays=250-3000ms in steps of 250ms, GRAPPA=2). CBF and AAT were mapped using Bayesian Inference for ASL (BASIL) software7. Median values were extracted from nine anatomical regions, taken from the MNI structural atlas8. An MPRAGE scan (1mm3; TR=2.1s; TE=3.24ms) was acquired for registration purposes.
Linear models were created to investigate the amount of variance in CBF/AAT that could be explained by oestradiol, progesterone, ROI and interaction terms (phase was also included to account for other cycling hormones). In all models, a visual inspection of residual plots ensured no notable deviations from homoskedasticity or normality.
Results
The levels of circulating oestradiol and progesterone in each menstrual phase is shown in Figure 1. The median CBF and AAT across the nine ROIs and three phases is illustrated in Figure 2.For the CBF linear model, the interaction term between both hormone levels and ROI was not significant, so was therefore removed (oestradiol: x2(1)=0.01; p=0.93; progesterone: x2(1)=0.04; p=0.85). Oestradiol explained a significant amount of CBF variance (x2(1)=18.84; p=0.00001), increasing CBF by 0.01ml/100g/min ± 0.002 (standard errors) per 1pmol/L of oestradiol. ROI also had a significant contribution (x2(1)=14.97; p=0.00011). The influence of progesterone (x2(1)=2.43; p=0.12) was not statistically significant.
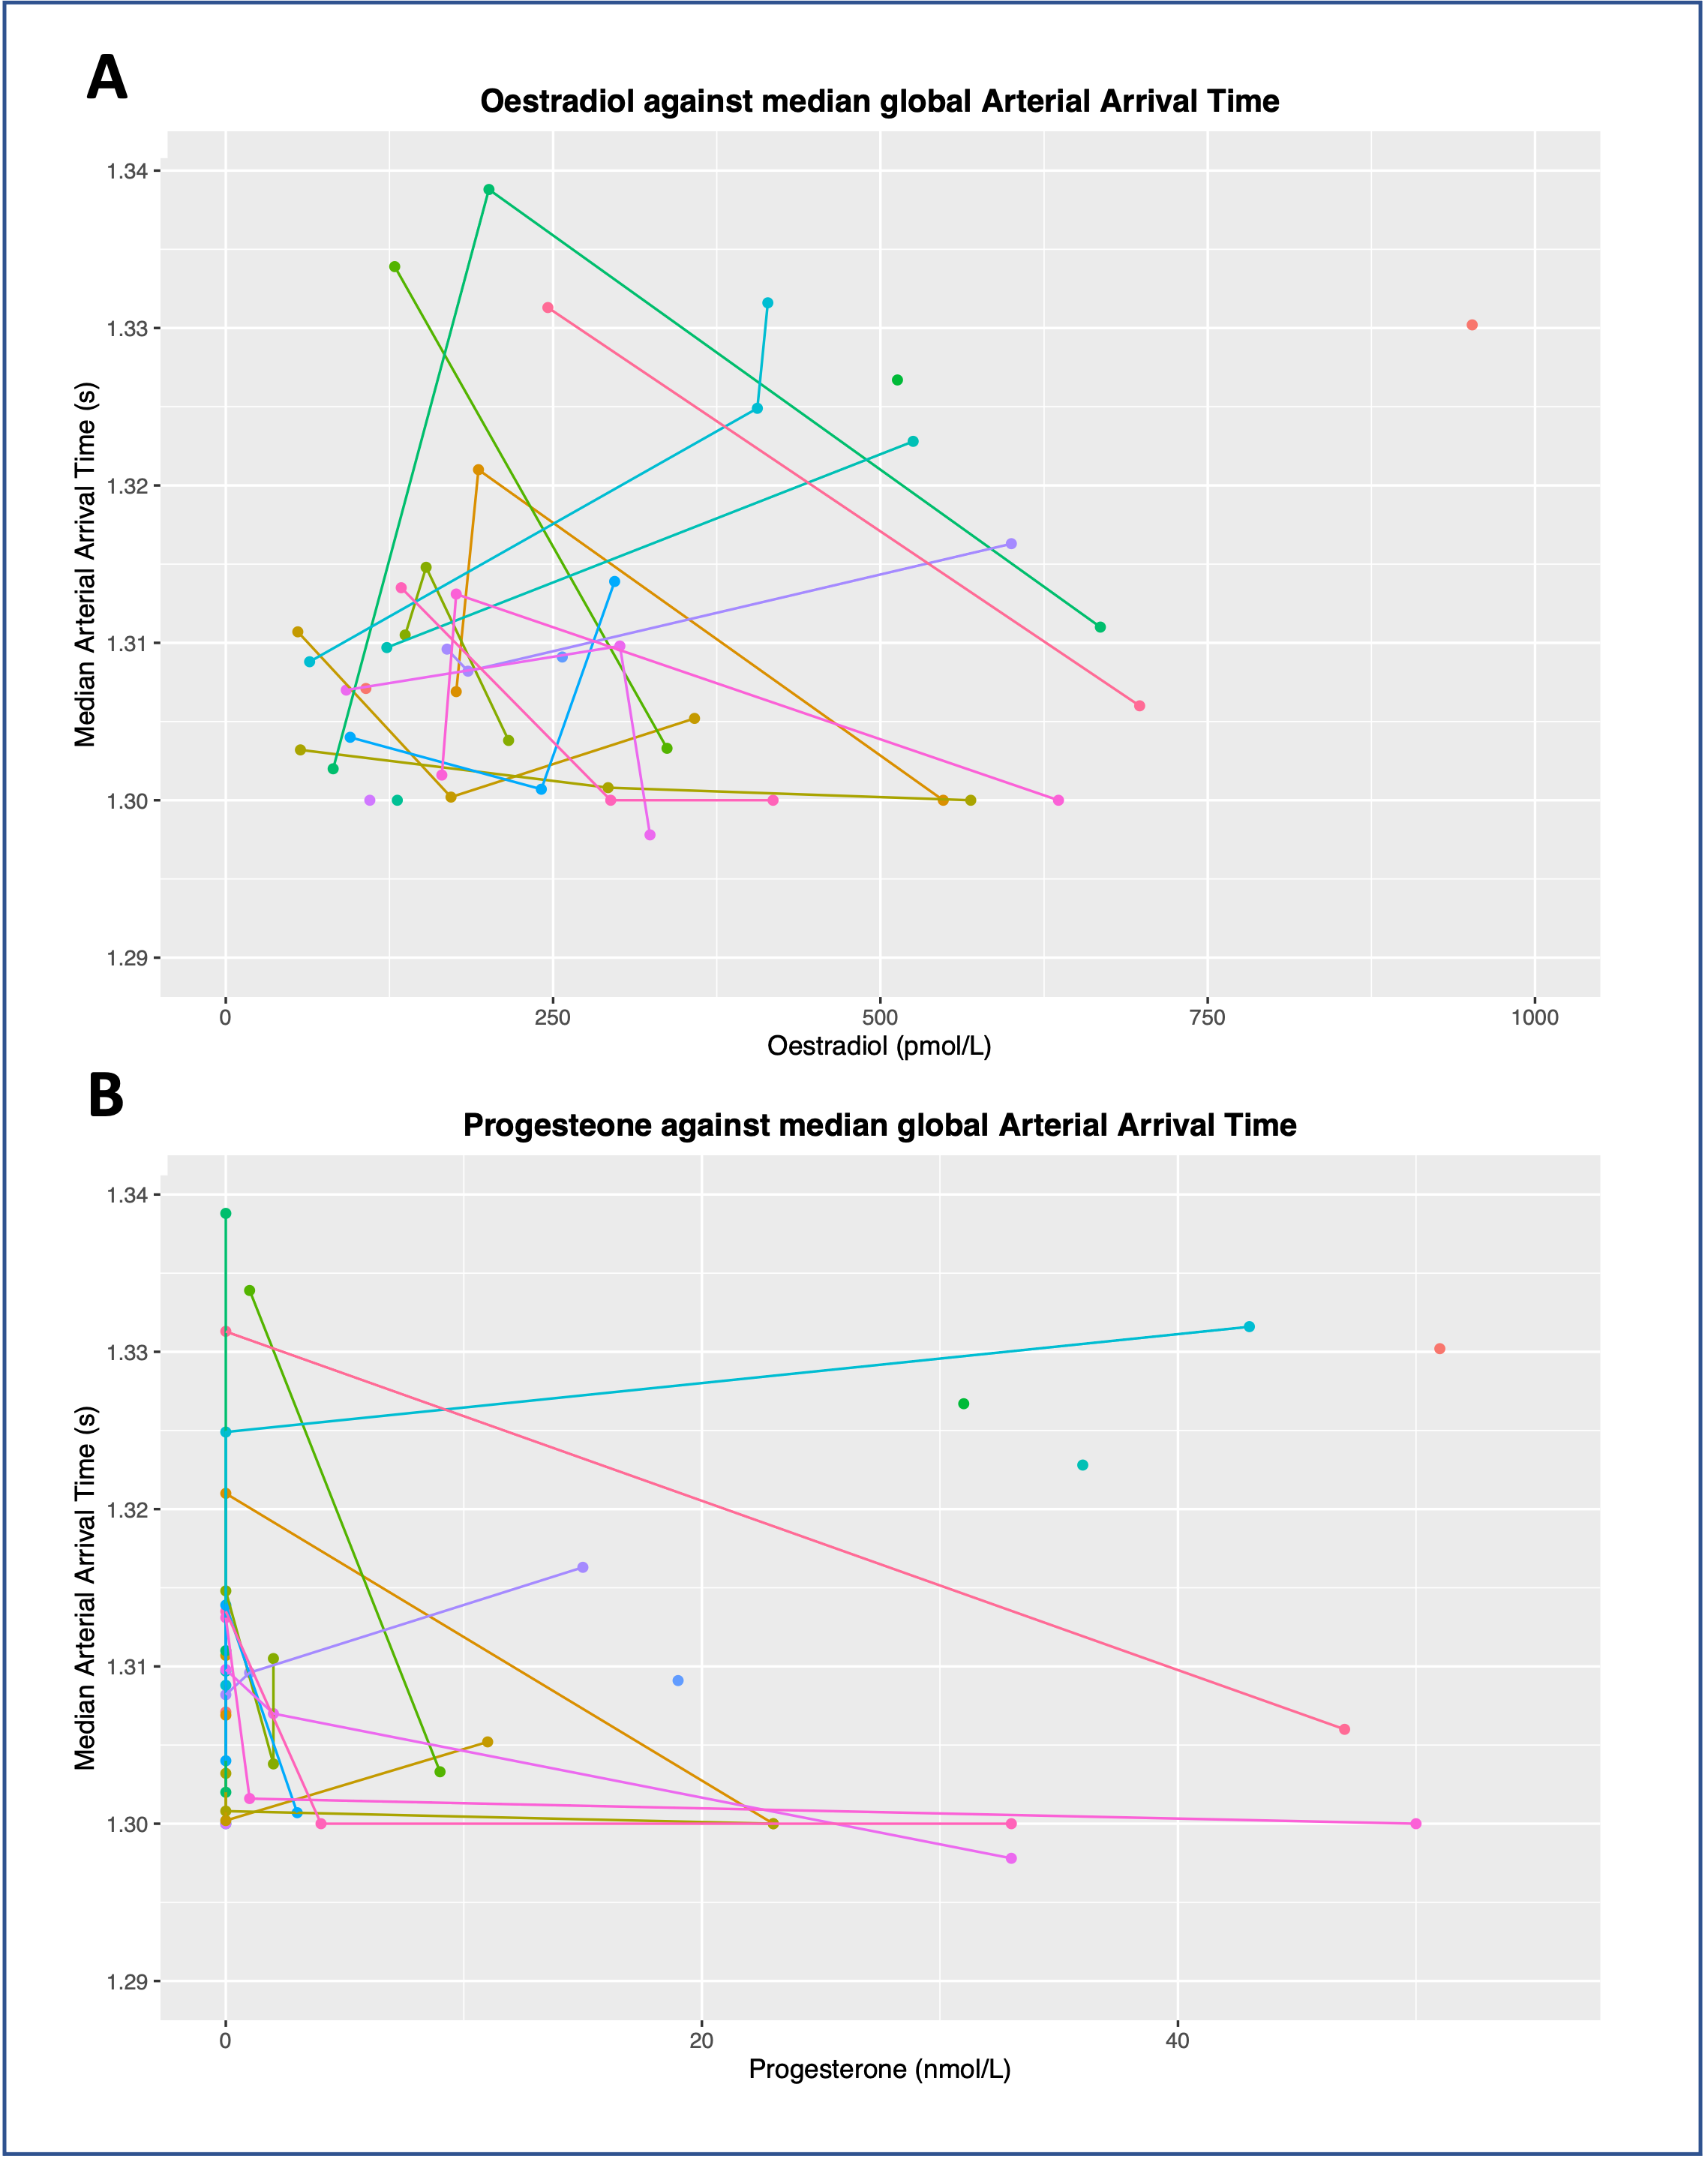
For the AAT model, the interaction term was also not significant, and was therefore removed (oestradiol: x2(1)=0.01; p=0.96; progesterone: x2(1)=0.03; p=0.98). Conversely to CBF, oestradiol didn’t significantly contribute to the model (x2(1)=0.90; p=0.34), but progesterone did (x2(1)=18.84; p=0.00001), decreasing AAT by 0.0005s ± 0.0003 (standard errors) per 1nmol/L of progesterone. ROI also significantly contributed to the model (x2(1)=7.2481; p=0.0071).
Global CBF and AAT are plotted against circulating oestradiol and progesterone in Figure 3 and 4 respectively. Data from all phases are included, with individual participants highlighted.
Discussion
We found that, in line with our hypothesis, oestrogen level explained a significant amount of variance in CBF. The median increase in oestrogen between EFP and MLP was 403pmol/L, corresponding to a median CBF increase of 3ml/100g/min. Furthermore, there was no interaction with ROI, suggesting that this was a global effect. Regarding AAT, we found that only progesterone significantly explained a portion of variance, which was not region-specific. The median increase in progesterone between EFP and MLP was 23nmol/L, corresponding to a median AAT decrease of 0.9ms. While these effects were small, they were notable, especially considering that this occurred over the relatively small hormonal fluctuations of a menstrual cycle (compared to, for example, pregnancy or starting hormone replacement therapy).Figure 3 and 4 illustrate the individual trends between hormones and CBF/AAT. While there is a general increase in cortical measurements with hormone levels, reflecting the significant results, there remains notable variation on an individual level. Future work will investigate whether this individual variation reflects experiences of menstrual symptoms (e.g., anxiety, migraines).
Conclusion
The current study finds that circulating oestrogen has a significant influence on CBF, while progesterone has a significant impact on AAT, in line with previous literature.Two recommendations for future research are evident from these results. Firstly, as can be seen in Figure 1, the oestradiol peak was more difficult to measure than expected, despite using estimates from previous literature. To correctly characterise the hormone level, menstrual cycle research should measure the circulating hormone concentration on the day of testing rather than using phase-based estimates. It is also beneficial to test at multiple time points across the cycle to capture fluctuations and aid in differentiating between multiple sex hormones.
Secondly, MRI research that relies on vascular fluctuations (e.g., fMRI, ASL) with menstruating participants should consider the amount of error/noise that may be added to their measurements if changing sex hormones are not considered. For example, the CBF rates recorded here varied an average 6.26 ml/100g/min across the three test phases. To minimise the influence of this, we would recommend testing during the EFP, as participants reliably demonstrated low/baseline levels of both oestradiol and progesterone.
Acknowledgements
Acknowledgements: This work was supported by Wellcome [WT200804;WT224267].References
1. Waring, S. C., Rocca, W. A., Petersen, R. C., O’Brien, P. C., Tangalos, E. G., & Kokmen, E. (1999). Postmenopausal estrogen replacement therapy and risk of AD: A population-based study. Neurology, 52(5), 965–965. https://doi.org/10.1212/WNL.52.5.965
2. Simpkins, J. W., Perez, E., Xiaofei Wang, ShaoHua Yang, Yi Wen, & Singh, M. (2009). Review: The potential for estrogens in preventing Alzheimer’s disease and vascular dementia. Therapeutic Advances in Neurological Disorders, 2(1), 31–49. https://doi.org/10.1177/1756285608100427
3. Dewundara, S. S., Wiggs, J. L., Sullivan, D. A., & Pasquale, L. R. (2016). Is Estrogen a Therapeutic Target for Glaucoma? Seminars in Ophthalmology, 31(1–2), 140–146. https://doi.org/10.3109/08820538.2015.1114845
4. Tostes, R. C., Nigro, D., Fortes, Z. B., & Carvalho, M. H. C. (2003). Effects of estrogen on the vascular system. Brazilian Journal of Medical and Biological Research, 36(9), 1143–1158. https://doi.org/10.1590/S0100-879X2003000900002
5. Wassmann, S., Bäumer, A. T., Strehlow, K., van Eickels, M., Grohé, C., Ahlbory, K., Rösen, R., Böhm, M., & Nickenig, G. (2001). Endothelial Dysfunction and Oxidative Stress During Estrogen Deficiency in Spontaneously Hypertensive Rats. Circulation, 103(3), 435–441. https://doi.org/10.1161/01.CIR.103.3.435
6. Robison, L. S., Gannon, O. J., Salinero, A. E., & Zuloaga, K. L. (2019). Contributions of sex to cerebrovascular function and pathology. Brain Research, 1710, 43–60. https://doi.org/10.1016/j.brainres.2018.12.030
7. Chappell, M. A., Groves, A. R., Whitcher, B., & Woolrich, M. W. (2009). Variational Bayesian Inference for a Nonlinear Forward Model. IEEE Transactions on Signal Processing, 57(1), 223–236. https://doi.org/10.1109/TSP.2008.2005752
8. Mazziotta, J., Toga, A., Evans, A., Fox, P., Lancaster, J., Zilles, K., Woods, R., Paus, T., Simpson, G., Pike, B., Holmes, C., Collins, L., Thompson, P., MacDonald, D., Iacoboni, M., Schormann, T., Amunts, K., Palomero-Gallagher, N., Geyer, S., … Mazoyer, B. (2001). A probabilistic atlas and reference system for the human brain: International Consortium for Brain Mapping (ICBM). Philosophical Transactions of the Royal Society of London. Series B: Biological Sciences, 356(1412), 1293–1322. https://doi.org/10.1098/rstb.2001.0915
Figures
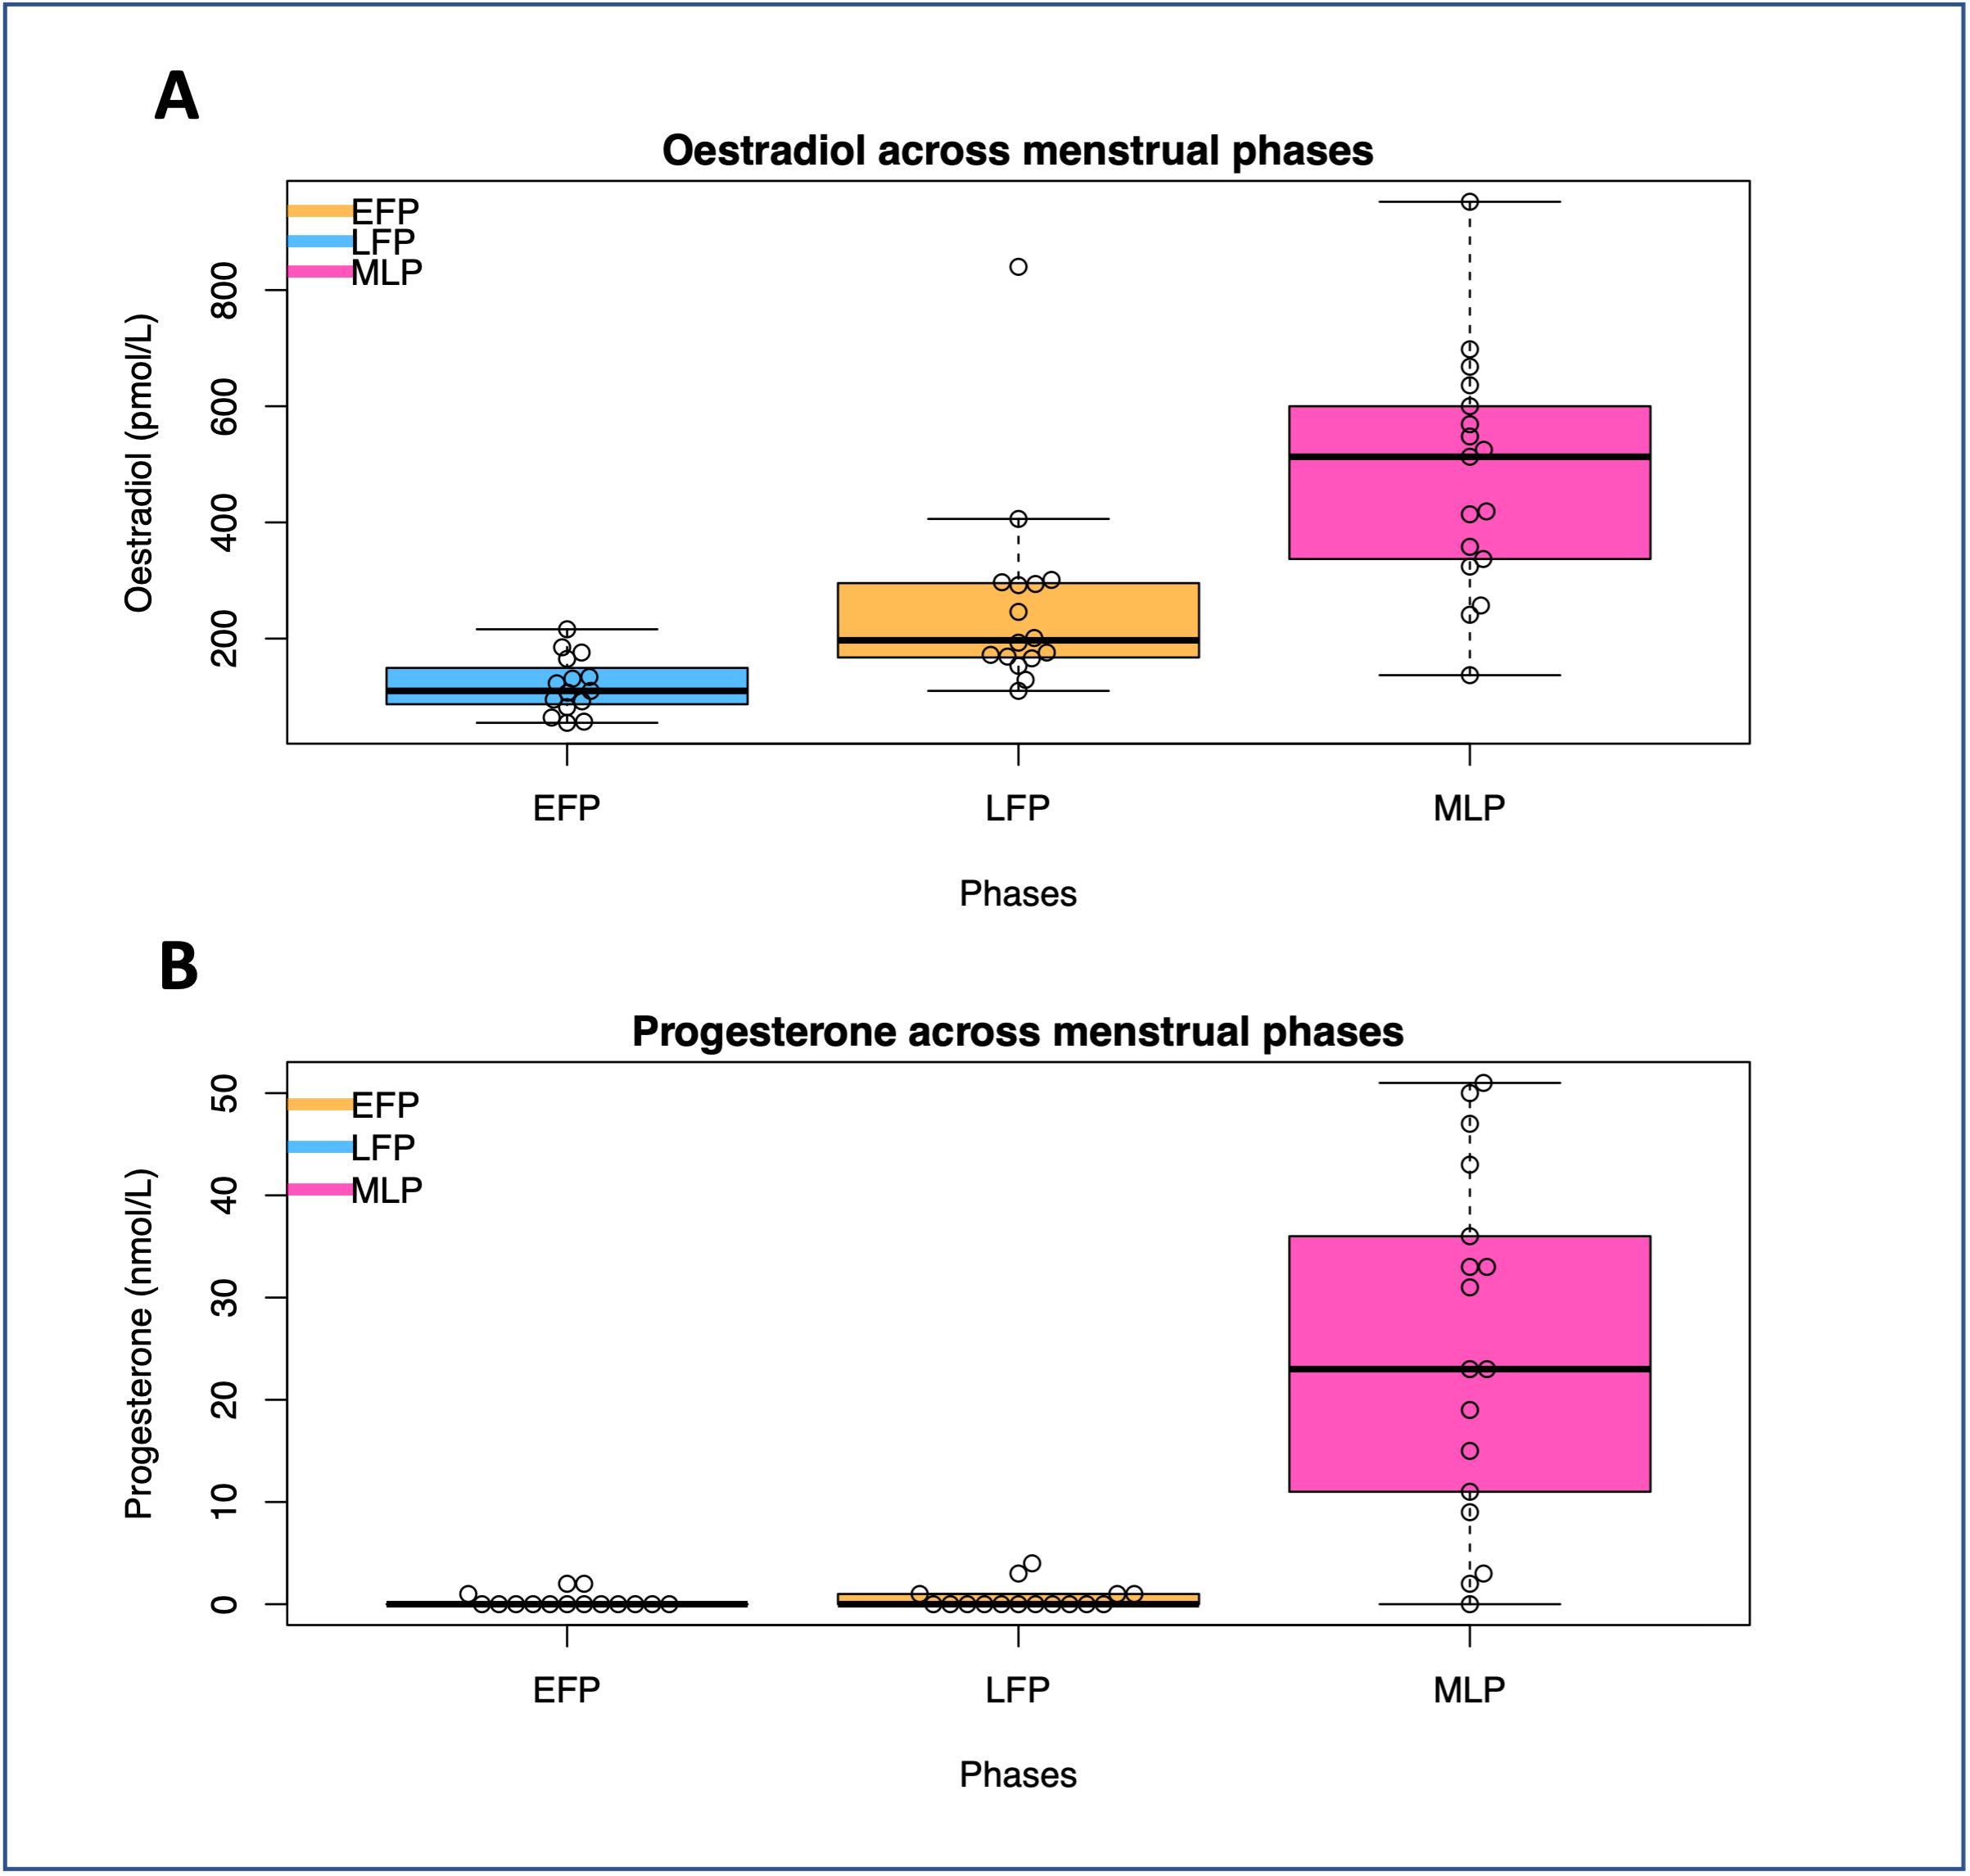
Figure 1 – The level of circulating oestradiol (panel A) and progesterone (panel B) across the three menstrual cycle phases tested in this study. EFP=Early follicular phase, LFP=Late follicular phase, MLP=Mid-luteal phase.
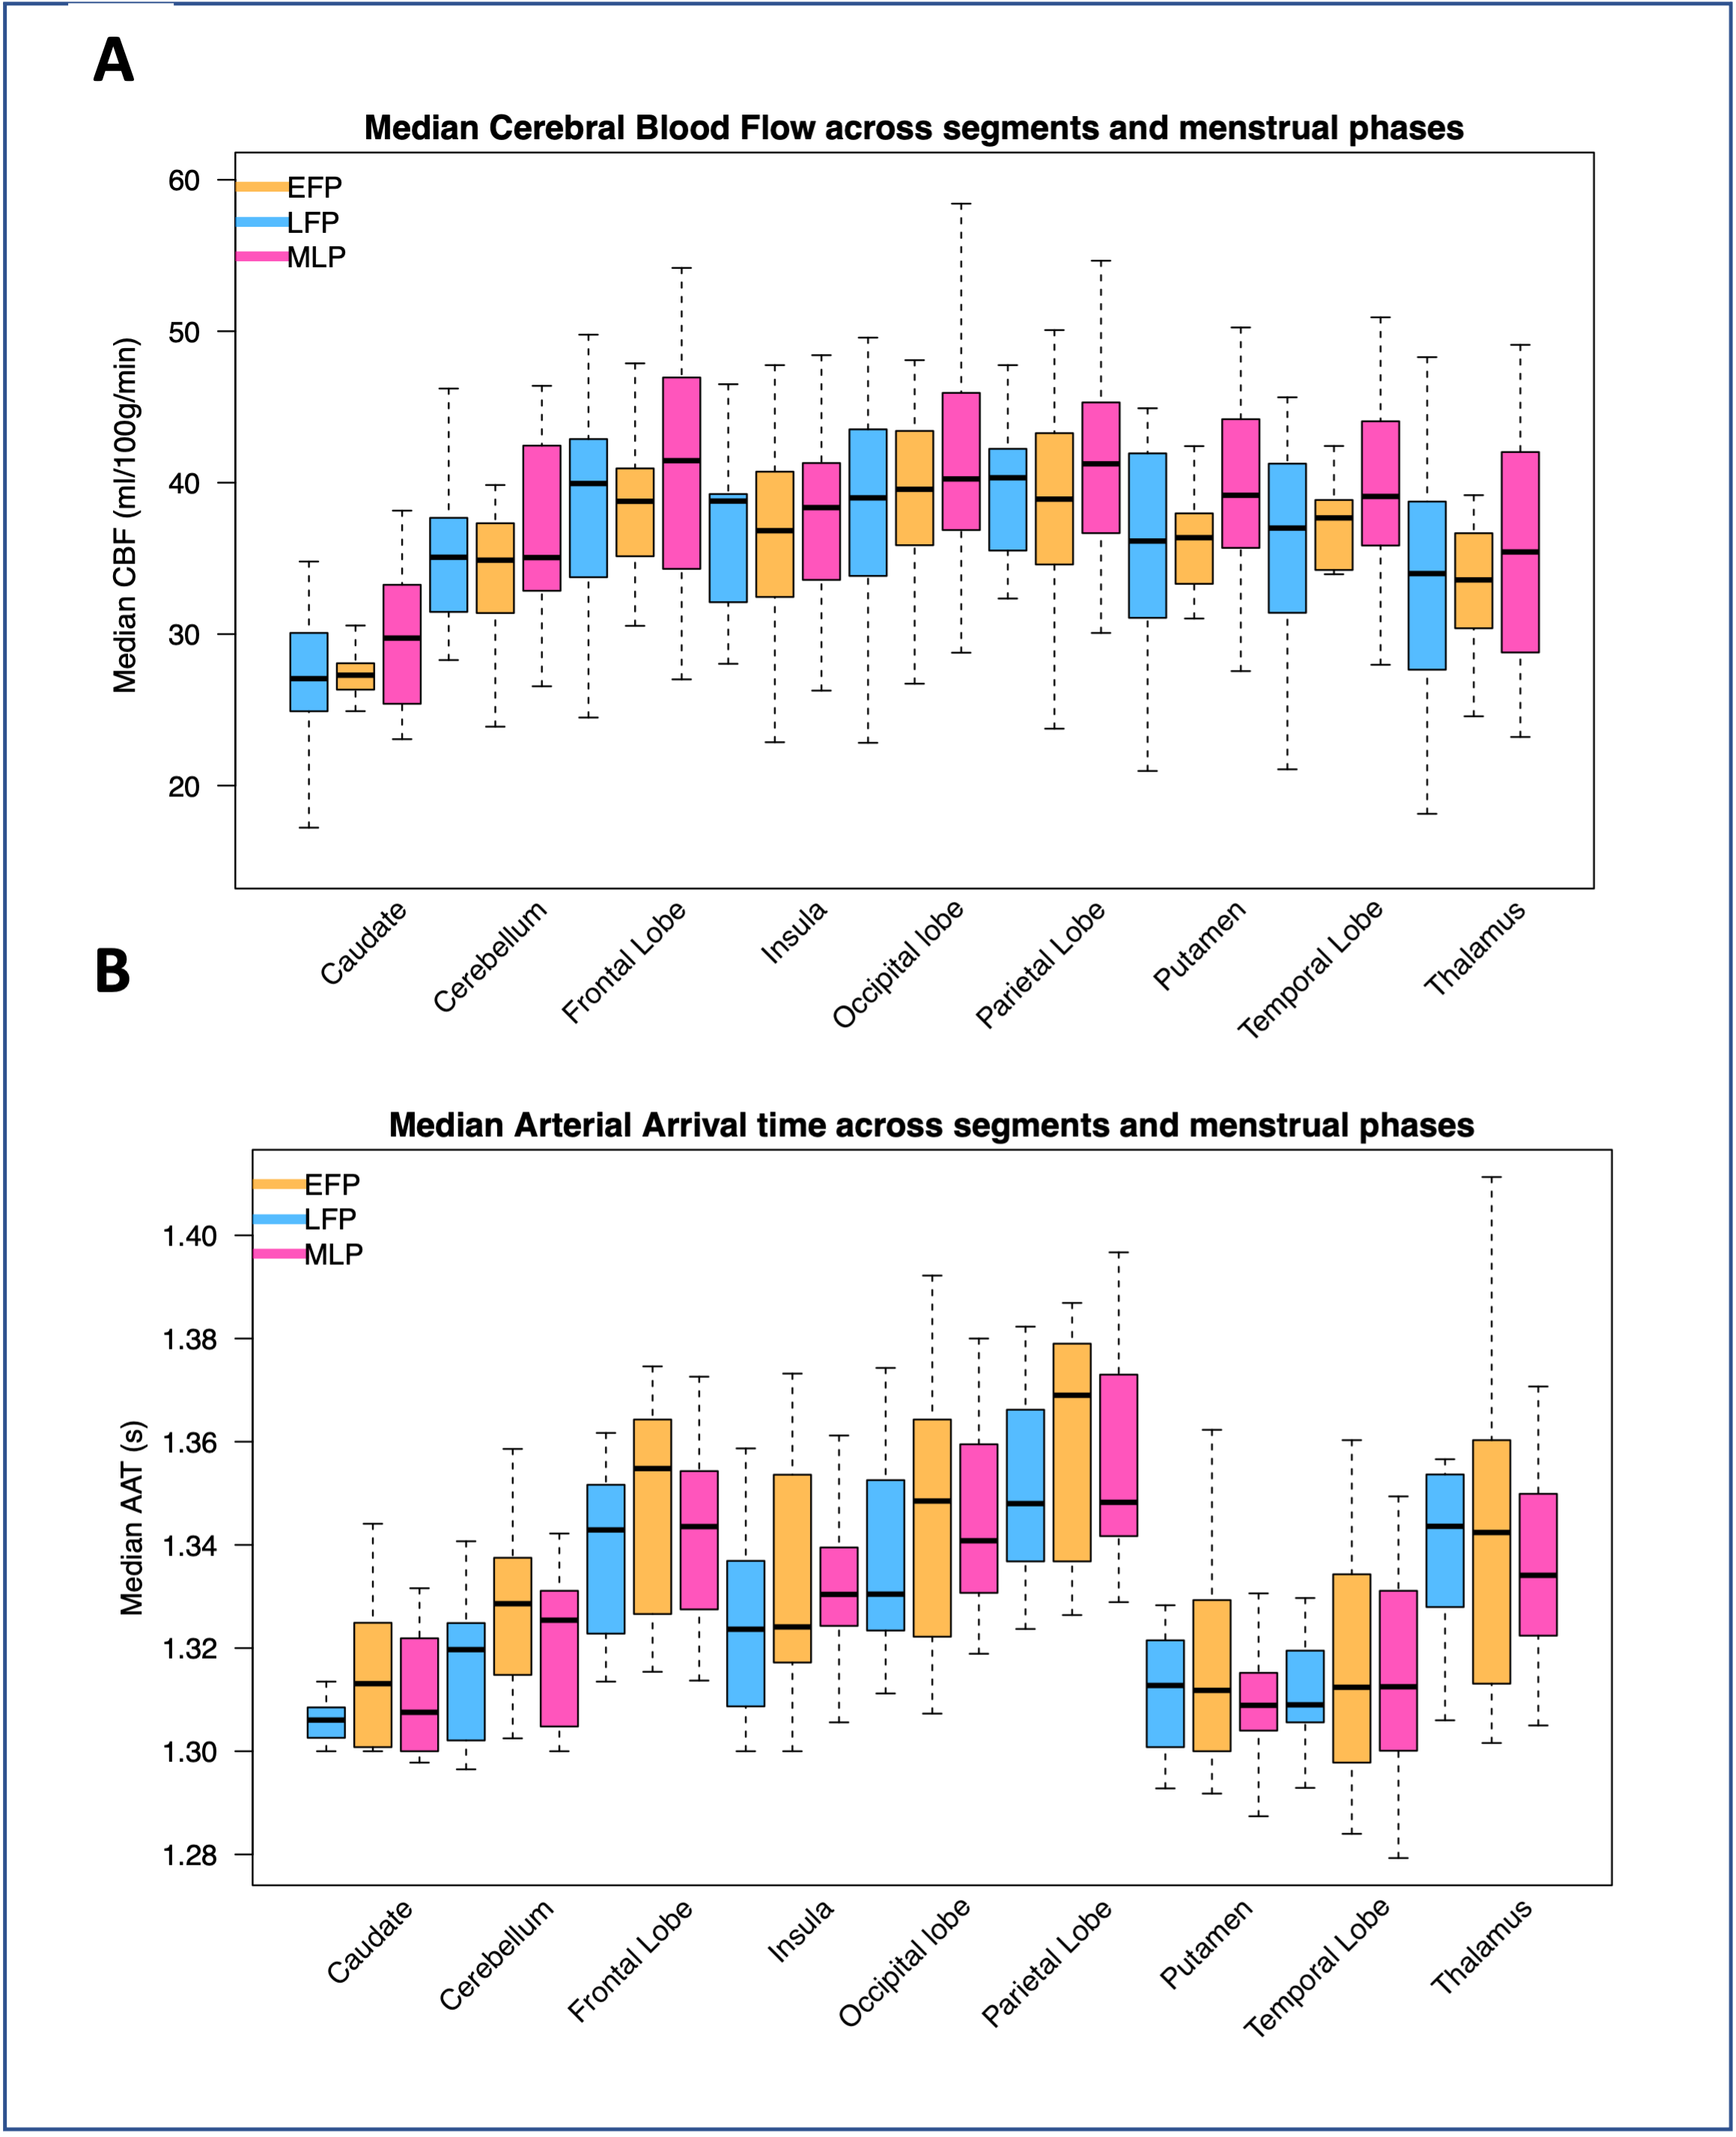
Figure 2 – The median Cerebral Blood Flow (CBF; panel A) and Arterial Arrival Time (AAT; panel B) plotted across menstrual cycle phases and regions-of-interest. EFP=Early follicular phase, LFP=Late follicular phase, MLP=Mid-luteal phase.
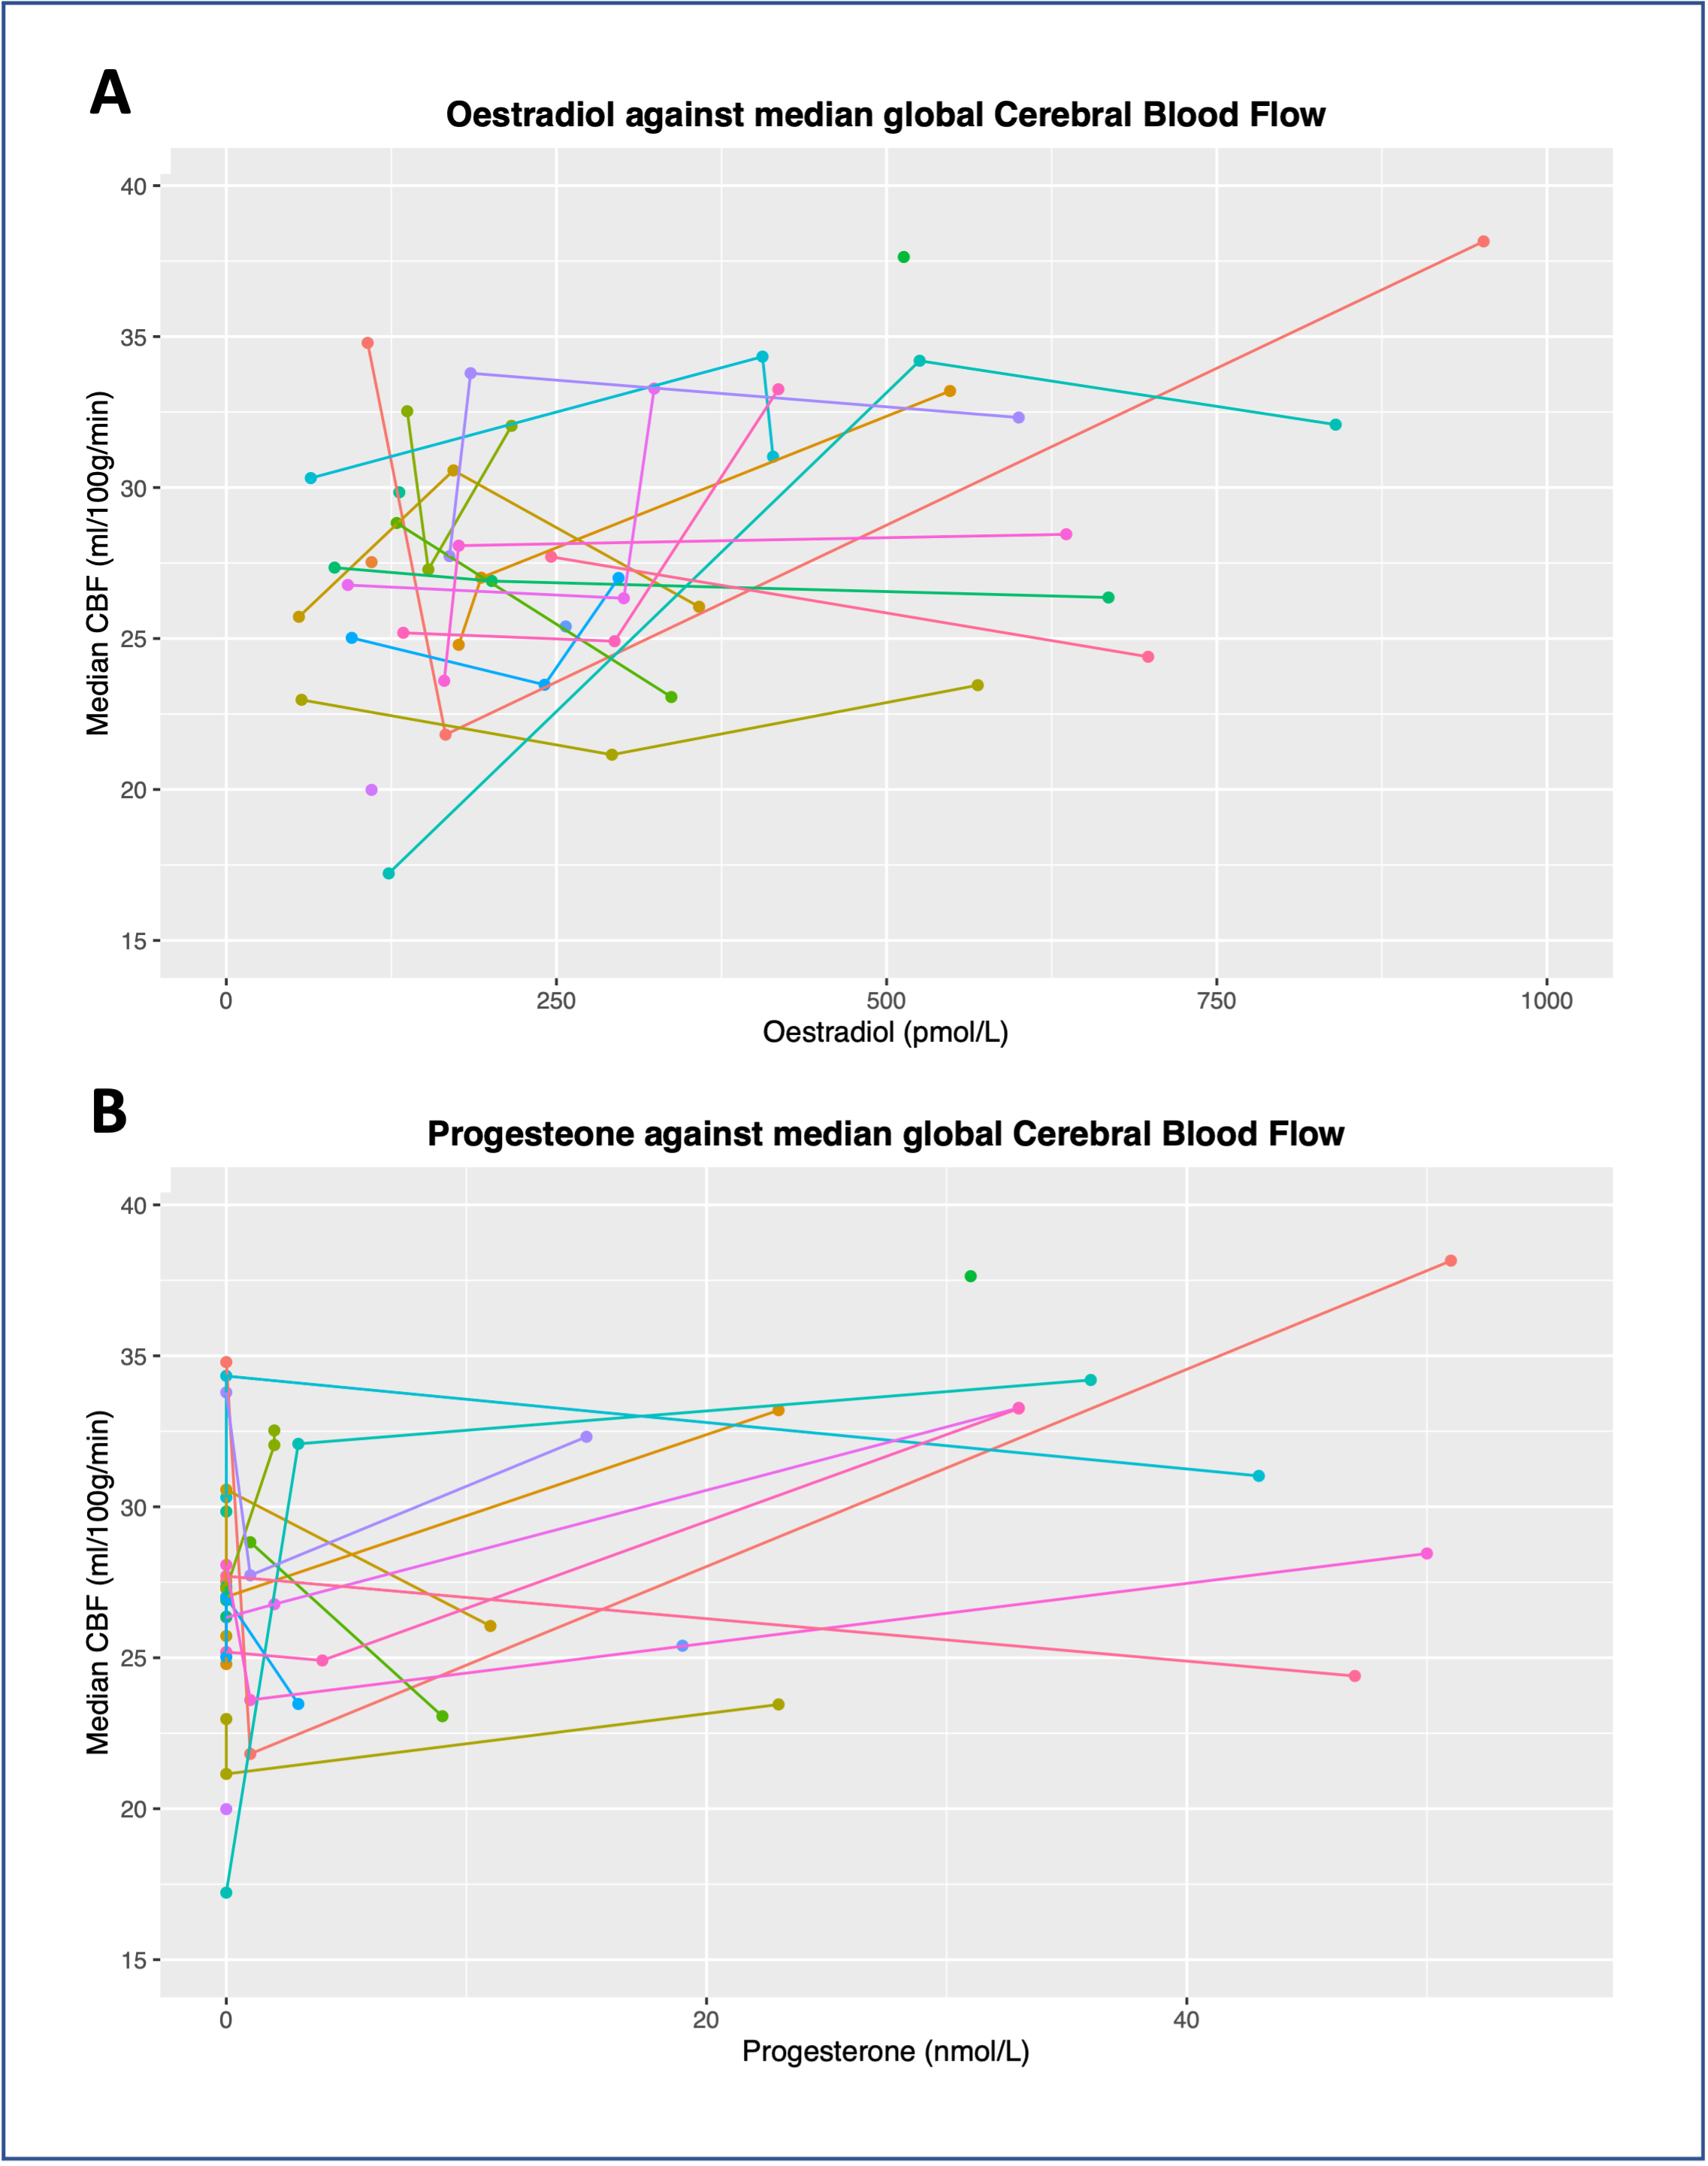
Figure 3 – Global median cerebral blood flow (CBF) plotted against oestradiol (panel A) and progesterone (panel B). Data from all phases included. Different colours indicate different participants. Joined points indicate repeat visits.