2305
Voxel-wise Parametric Mapping of Cerebrovascular Hemodynamics using 4D Flow MRI: A Scan-Rescan Reproducibility Study at 3T1Radiology, Feinberg School of Medicine, Northwestern University, Chicago, IL, United States, 2Neurology, Feinberg School of Medicine, Northwestern University, Chicago, IL, United States, 3Department of Medical Physics, University of Greifswald, Greifswald, Germany
Synopsis
Keywords: Blood vessels, Velocity & Flow
Cerebrovascular dual-venc 4D flow MRI enables measurement of global and local intracranial 3D hemodynamics with full volumetric coverage of the circle of Willis. Hemodynamic analysis was completed using a semi-automated voxel-wise parametric mapping tool, enabling assessment of velocity-based parameters, including mean velocity, peak velocity, kinetic energy and time-to-peak velocity. The workflow reproducibility was evaluated with scan-rescan analysis for 10 subjects who underwent two MRI scans within 30 days. Global circle of Willis and hemispheric analysis regions showed good to excellent reproducibility for all parameters except for time-to-peak velocity. Regional analysis showed better reproducibility for parameters derived from systolic cardiac timepoints.Background
Imaging techniques such as digital subtraction angiography, transcranial Doppler ultrasonography, and 2D phase-contrast MRI are limited by an invasive qualitative analysis, operator dependence and limited anatomical coverage due to insonation windows, or manual placement of 2D planes with a single velocity encoding direction. Cerebrovascular dual-venc 4D flow MRI has enabled the assessment of 3D hemodynamics of the circle of Willis (CoW) and captures the full dynamic range of intracranial vessel blood flow velocities1,2. This technique has shown promising results for evaluation of hemodynamic changes in intracranial atherosclerotic disease, aneurysms, and arteriovenous malformations1,3–5. Previous studies used analysis workflow based on 3D vessel segmentation, automated centerline detection and placement of multiple 2D analysis planes to derive area-based metrics such as flow-rate, pressure drop, etc.1,4,6,7. For this study we have utilized an alternative analysis approach for the streamlined visualization and quantification of intracranial hemodynamics, based on previously developed parameter mapping tools for aortic hemodynamics8. We have expanded upon this approach through the design of a semi-automated analysis workflow for intracranial vessel analysis. In this study, we evaluated scan-rescan parameter reproducibility to establish the reliability of voxel-wise parameter mapping.Methods
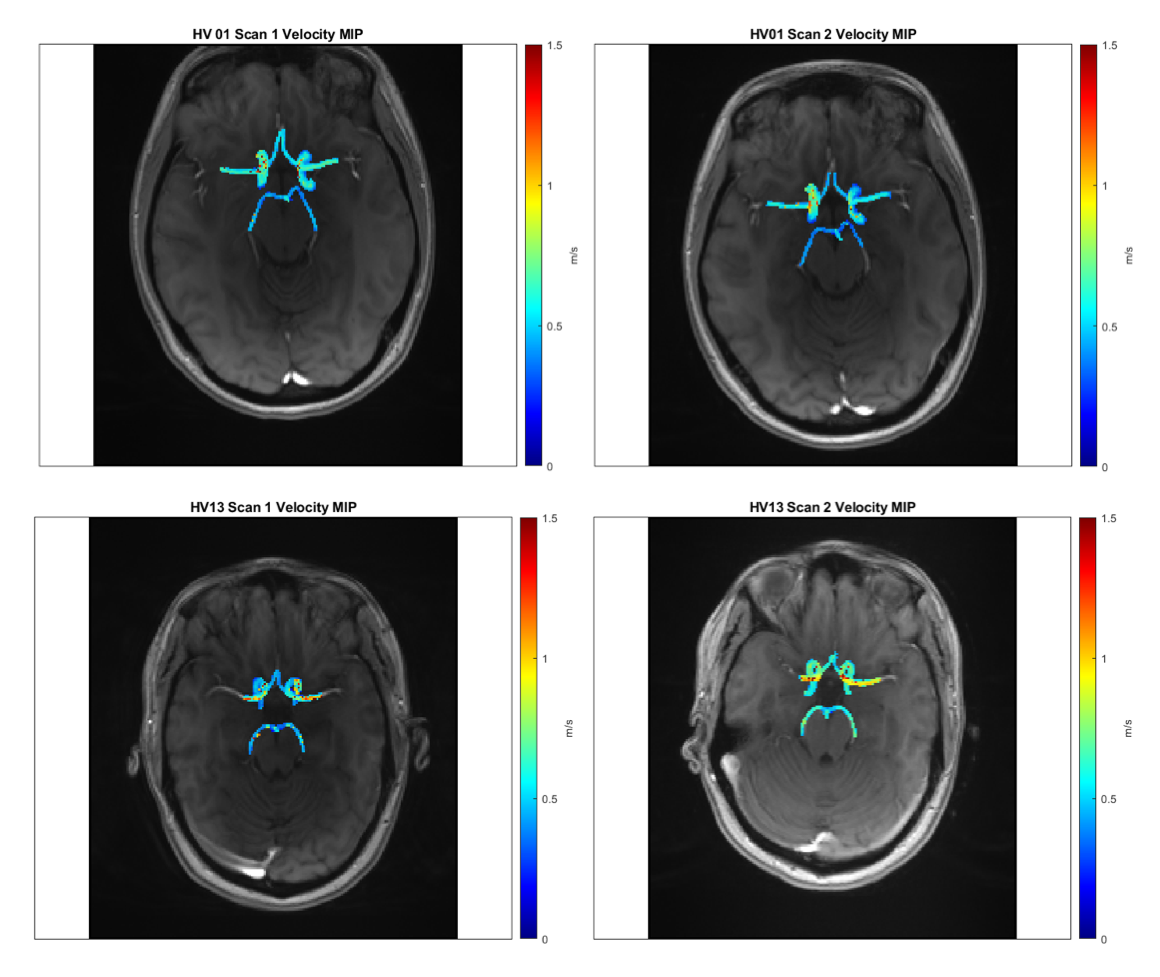
Fourteen subjects were prospectively recruited for this IRB approved study. Four were excluded due to incidental findings, data quality (e.g. movement artifacts), or failure to return for repeat scan. The 10 remaining healthy subjects (26.2±4.9 years, 6F) included for analysis had no history of cerebrovascular disease. All subjects underwent two brain MRI exams (3T MAGNETOM Prisma, Siemens, Erlangen, Germany, 2nd scan within 30 days) including intracranial dual-venc 4D Flow MRI (TR=5.9 ms, TE=3.3 ms, flip angle=15°, low venc=80 cm/s, high venc=160 cm/s, voxel size=1 mm isotropic, temporal resolution=82.6 ms, k-t PEAK-GRAPPA9 acceleration factor of R=5). 4D flow MRI data analysis (Figure 1) included correction for Maxwell fields, eddy currents, noise, and velocity anti-aliasing during reconstruction or using in-house software tools10. The high venc data was used for unwrapping velocities in the low VENC data set, resulting in an anti-aliased high VNR data source11 4D flow data was used to generate time-averaged 3D phase contrast angiograms (PC-MRA) which were used to manually segment the CoW (Mimics, Materialise, Leuven, Belgium). The 3D CoW segmentation was used to mask 4D flow data and calculate velocity-based parametric maps using an in-house analysis tool (MATLAB, MathWorks, Natick, MA). Velocity magnitude was determined for each voxel within the CoW at each cardiac timepoint v(t). Filtering removed voxels with v(t) standard deviation over time > 50% of high venc. Peak velocity (PV) and mean velocity (MV) were defined as the maximum and average v(t) over all timepoints, respectively. To minimize contribution of noisy voxels, the 95th to 98th velocity percentiles were used for PV characterization. Kinetic energy (KE) was determined by:$$ KE = \frac{1}{2} \cdot \rho \cdot dV \cdot v(t)^2$$
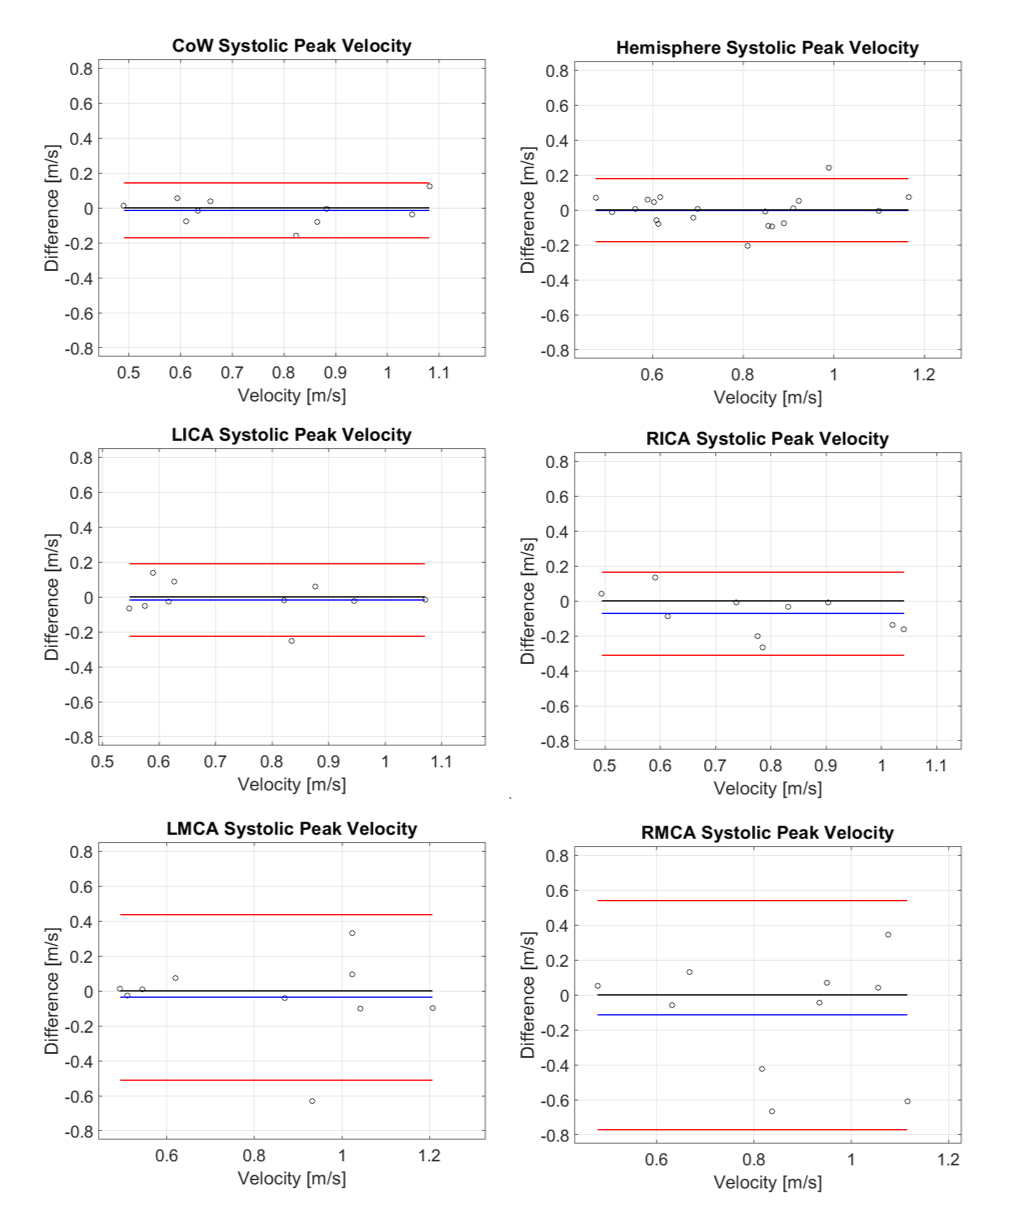
with blood density $$$\rho$$$ of 1060 kg/m3, unit voxel volume $$$dV$$$ of 1 mm3. KE was averaged over the cardiac cycle. To calculate time-to-peak (TTP) velocity, v(t) was interpolated to a temporal resolution of 5ms and the time from the R-wave to the peak velocity was determined for each voxel. Systolic PV and systolic KE were also calculated for a three-timepoint systolic window of the cardiac cycle, centered at TTP. Scan-rescan reliability was determined for the CoW, left and right brain hemispheres, and nine cerebral vessels. Intraclass correlation coefficient (ICC) and Bland-Altman (B-A) analysis were used to evaluate parameter reproducibility between scans.
Results
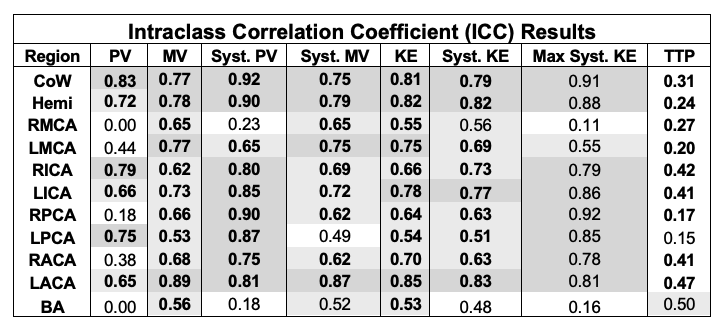
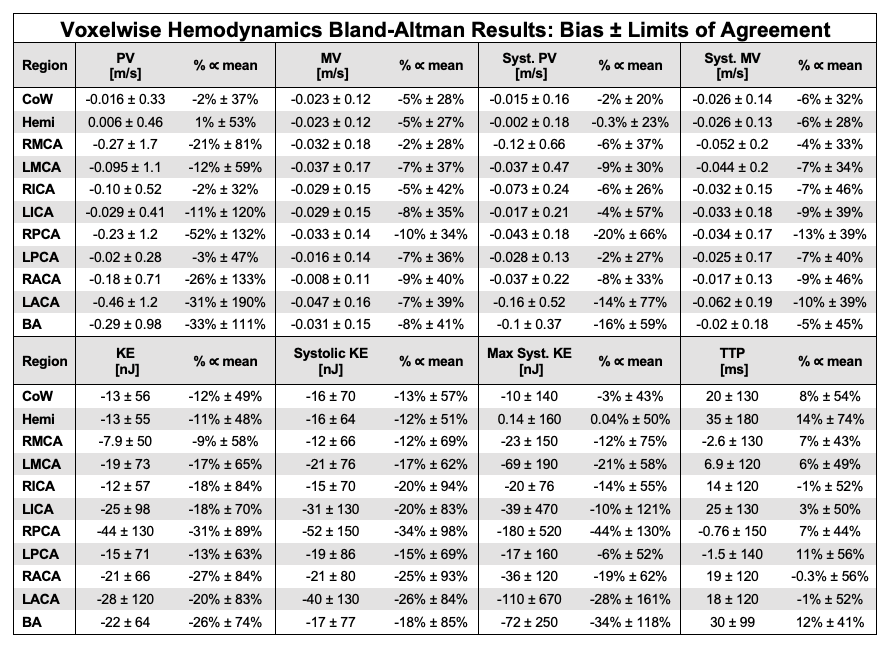
ICC and B-A results are summarized in Tables 1-2. The CoW and hemisphere analysis regions showed good to excellent agreement for all parameters except TTP. Regional results were more varied, but showed the most consistent results for systolic PV and KE followed by MV and systolic MV.PV, MV, KE, and their systolic analogues showed moderate to good reproducibility in the CoW and hemisphere regions (ICC>0.72). Systolic PV had more favorable ICC values than PV, likely related to differences in heart rate and varied coverage of the diastolic phase of the cardiac cycle. Similarly, systolic PV showed better B-A agreement than PV. B-A analysis showed similar levels of agreement and the lowest biases for MV and systolic MV. Systolic KE and KE demonstrated similar moderate to good reproducibility but wider LoA than other parameters.
Calculation of TTP demonstrated poor reproducibility, likely attributable to the low temporal resolution (>80ms) of the 4D flow MRI scan.
Discussion and Conclusion
This study demonstrated voxel-wise parametric mapping as a feasible and promising approach for semi-automated intracranial 4D flow MRI data analysis, including visualization of cerebrovascular hemodynamics by intuitive parametric maps as well as global and regional quantification of velocity-based hemodynamic metrics. Larger analysis regions (entire CoW, hemispheres, MCAs and ICAs) showed a higher degree of repeatability due to a greater number of voxels which dampened noise effects. Current limitations of our approach include the need for manual 3D segmentation of the CoW and lack of area-based flow parameters (e.g. net and peak flow). Future studies will investigate the utility of deep learning for 3D segmentation to further automate the analysis workflow and explore inclusion of area-based flow parameters for a more complete analysis of cerebrovascular 3D hemodynamics.Acknowledgements
This work was funded by the National Institute of Health (NIH NIA P30AG059988, NIH 1R01HL149787, NIH 1R21NS122511).References
1. Aristova M, Vali A, Ansari SA, et al. Standardized Evaluation of Cerebral Arteriovenous Malformations Using Flow Distribution Network Graphs and Dual-venc 4D Flow MRI. J Magn Reson Imaging. 2019;50(6):1718-1730. doi:10.1002/jmri.267842.
2. Youn SW, Lee J. From 2D to 4D Phase-Contrast MRI in the Neurovascular System: Will It Be a Quantum Jump or a Fancy Decoration? J Magn Reson Imaging. 2020:1-26. doi:10.1002/jmri.274303.
3. Wu C, Schnell S, Vakil P, et al. In vivo assessment of the impact of regional intracranial atherosclerotic lesions on brain arterial 3D hemodynamics. Am J Neuroradiol. 2017;38(3):515-522. doi:10.3174/ajnr.A50514.
4. Vali A, Aristova M, Vakil P, et al. Semi‐automated analysis of 4D flow MRI to assess the hemodynamic impact of intracranial atherosclerotic disease. Magn Reson Med. 2019;82(2):749-762. doi:10.1002/mrm.277475.
5. Schnell S, Ansari SA, Vakil P, et al. Three-dimensional hemodynamics in intracranial aneurysms: Influence of size and morphology. J Magn Reson Imaging. 2014;39(1):120-131. doi:10.1002/jmri.241106.
6. Moore J, Aristova M, Abdalla R, et al. Cerebrovascular dual-venc 4D flow MRI: Assessment of arterial pulsatility and resistance measures in intracranial atherosclerotic disease. 29th Int Soc Magn Reson Med. 2021.7.
7. Moore JE, Zvolanek KM, Aristova M, et al. Test-Retest Reproducibility of Cerebrovascular Dual-venc 4D Flow MRI. 30th Int Soc Magn Reson Med. 2022.8.
8. Jarvis K, Pruijssen JT, Son AY, et al. Parametric Hemodynamic 4D Flow MRI Maps for the Characterization of Chronic Thoracic Descending Aortic Dissection. J Magn Reson Imaging. 2019;51(5):1357-1368. doi:10.1002/jmri.269869.
9. Jung B, Ullmann P, Honal M, Bauer S, Hennig J, Markl M. Parallel MRI with extended and averaged GRAPPA kernels (PEAK-GRAPPA): Optimized spatiotemporal dynamic imaging. J Magn Reson Imaging. 2008;28(5):1226-1232. doi:10.1002/jmri.2156110.
10. Bock J, Kreher BW, Hennig J, Markl M. Optimized pre-processing of time-resolved 2D and 3D Phase Contrast MRI data. Proc Intl Soc Mag Reson Med. 2007;15:3138.11.
11. Schnell S, Ansari SA, Wu C, et al. Accelerated dual- venc 4D flow MRI for neurovascular applications. J Magn Reson Imaging. 2017;46(1):102-114. doi:10.1002/jmri.25595
Figures