2303
Magnetic resonance imaging of ultrasound-induced strain fields for discrimination of solid and liquid phases1Department of Radiology, University of Alabama at Birmingham, Birmingham, AL, United States, 2Department of Radiology and Imaging Sciences, University of Utah, Salt Lake City, UT, United States, 3Department of Neurosurgery, University of Alabama at Birmingham, Birmingham, AL, United States, 4Radiology, University of Alabama at Birmingham, Birmingham, AL, United States
Synopsis
Keywords: Blood vessels, Focused Ultrasound
Focused ultrasound (FUS) has gained clinical utility as a non-invasive treatment option, but applications to diseases affecting blood vessels in the brain are just now being investigated. MR acoustic radiation force imaging (MR-ARFI) of FUS-induced displacement and strain fields were evaluated along with diffusion imaging as a method of differentiating solid and liquid material inside a tissue-mimicking gelatin phantom. Apparent diffusion coefficient (ADC) performed best as a solid-liquid classifier, and axial displacement performed worst. Normal and shear strain components performed better than displacement measurements alone.INTRODUCTION
Most therapeutic focused ultrasound (FUS) applications use MR thermometry (MRT) to monitor treatment progress. MRT is a relatively mature monitoring technique with broad utility, but treatment of cerebrovascular lesions like arteriovenous and cavernous malformations pose challenges. Treatment goal for these lesions is blood flow cessation rather than cell death, and efficacy endpoint is phase change from liquid to solid rather than tissue heating to 50-60 °C. The purpose of this in vitro study was to evaluate MR acoustic radiation force imaging (MR-ARFI) and diffusion-weighted imaging (DWI) for their ability to predict whether a tissue-mimicking gelatin was solid or liquid.METHODS
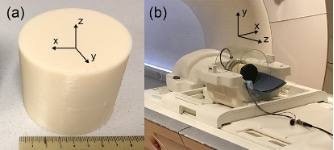
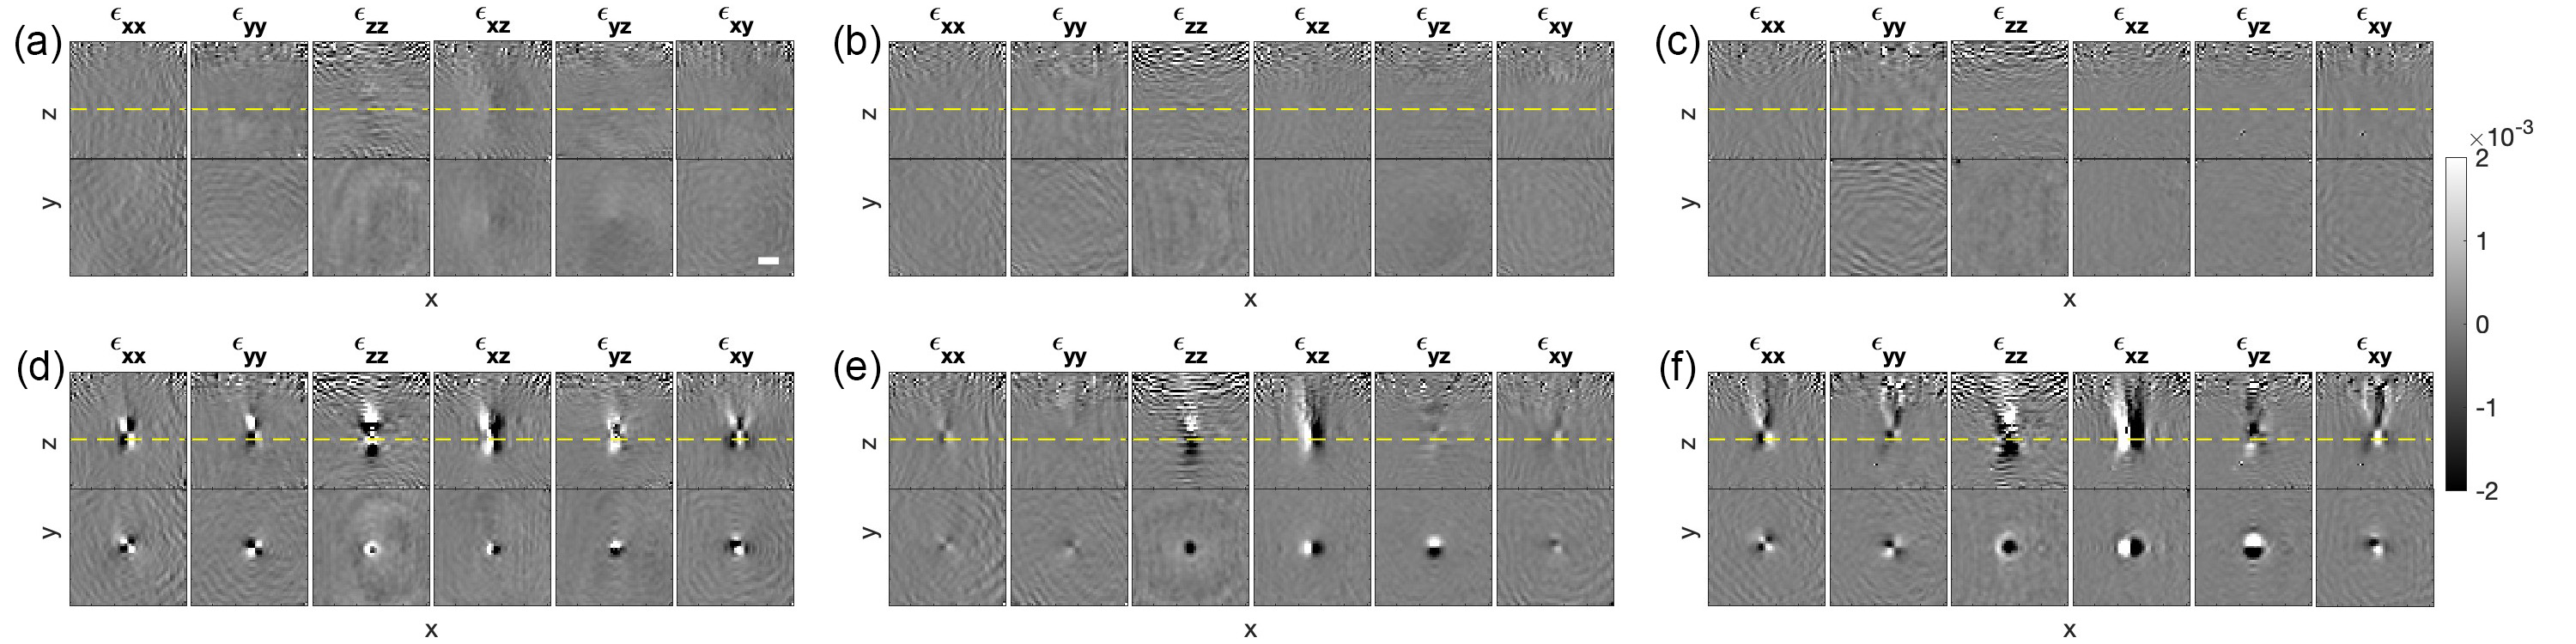
Three gelatin FUS/MR phantoms were made from 175-bloom porcine gelatin powder, Figure 1a.1 A single-element 1.1 MHz FUS transducer with 75 mm aperture and 60 mm radius of curvature operating at 5 W instantaneous power was used for MR-ARFI measurements and FUS heating, Figure 1b. MR-ARFI was implemented using a 3D gradient-recalled echo (GRE) segmented echo-planar imaging (seg-EPI) sequence with monopolar readout and bipolar motion sensitizing gradients (MSGs) applied along the slice direction.2 Each MSG lobe lasted 15 ms, had an amplitude of 30 mT/m, and the slew rate for the MSGs was 100 mT/m/ms. Displacement in three orthogonal directions was measured by imaging slices oriented in three orthogonal planes. The acquisition matrix was 64x64x64 with a field of view (FOV) of 128 mm in each direction. Displacement field components were $$$u_i=\frac{\Delta \phi_i}{\gamma G_{MSG,i} \delta}$$$, where $$$\Delta \phi_i$$$ is the complex phase difference between US on and US off images interleaved on the TR level, $$$\gamma$$$ is the proton gyromagnetic ratio, $$$G_{MSG,i}$$$ was the MSG strength along direction i = x,y,z, and $$$\delta$$$ was the MSG duration. The z-axis was parallel to the ultrasound beam, and the x and y axes were perpendicular to the ultrasound beam. Strain field components were calculated using linear strain theory. The strain components were $$$\epsilon_{ij} = \frac{1}{2}\frac{\partial u_i}{\partial x_j} + \frac{\partial u_j}{\partial x_i}$$$.3 MR thermographic imaging (MRTI) using the proton resonance frequency shift (PRF) method was implemented with a 3D GRE seg-EPI sequence with bipolar readout and no MSGs. A 2D diagonal diffusion-weighted (DWI) EPI MRI sequence with b-values of 0 and 2000 s/mm2 was used to calculate apparent diffusion coefficient (ADC) values in the phantoms. The acquisition parameters were TR 10 s, TE 83 ms, in-plane FOV 128 mm, matrix 64x64, number of slices 24, slice thickness 3 mm.MR-ARFI and DWI measurements were made before FUS heating and after 2-minute heating periods with increasing FUS power. MRTI was run during each heating interval. After each set of measurements, presence of melted gelatin was tested by inserting a 20-gauge needle into the focal volume. Measurements ended after positive indications of liquid gelatin. A region of interest (ROI) was defined that consisted of a 5x5x5 voxel volume centered on the voxel with the greatest measured axial displacement uz. Receiver operating characteristic (ROC) curves were used to evaluate the predictive value of each metric, where solid was the negative class and liquid was the positive class. The area under each curve was used as a figure of merit for each metric in discriminating between solid and liquid.
RESULTS
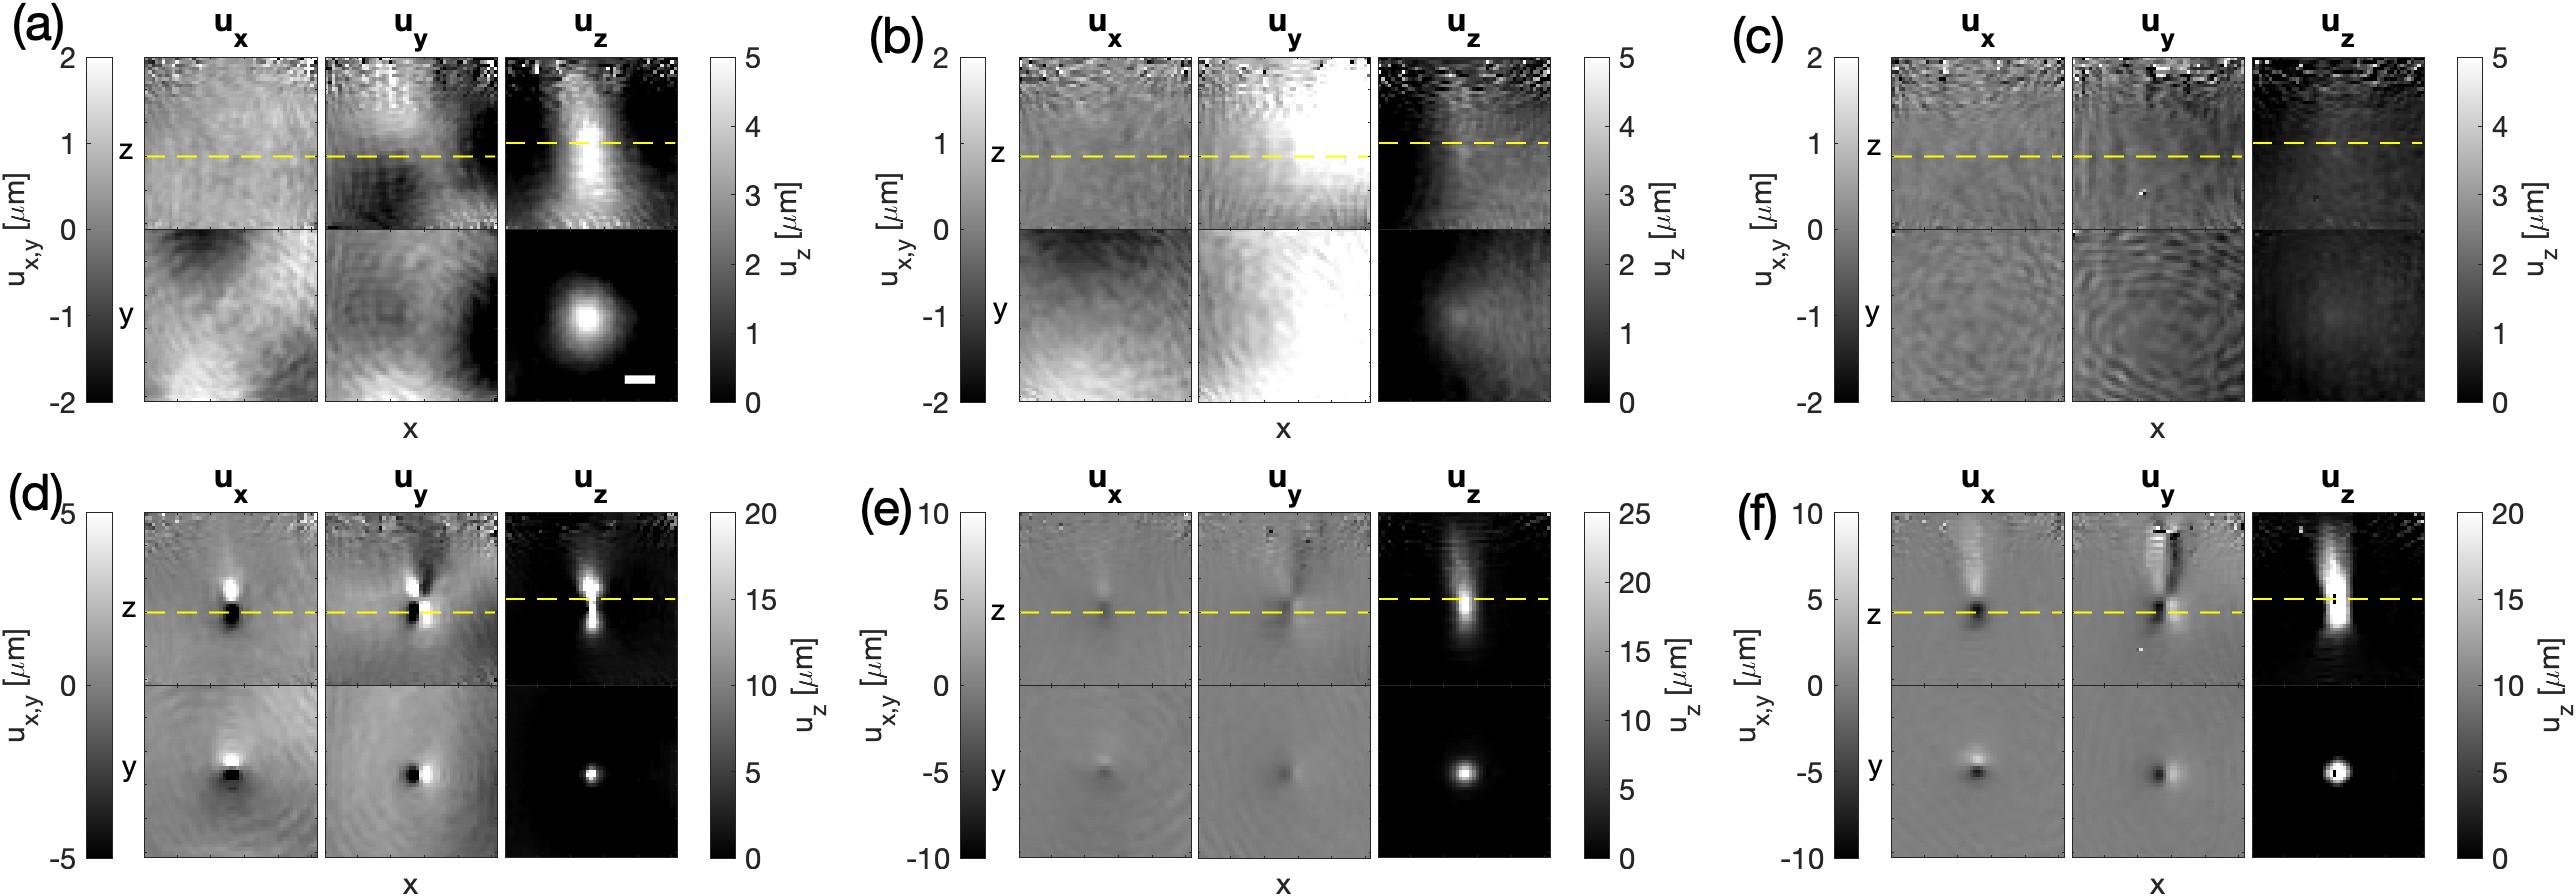
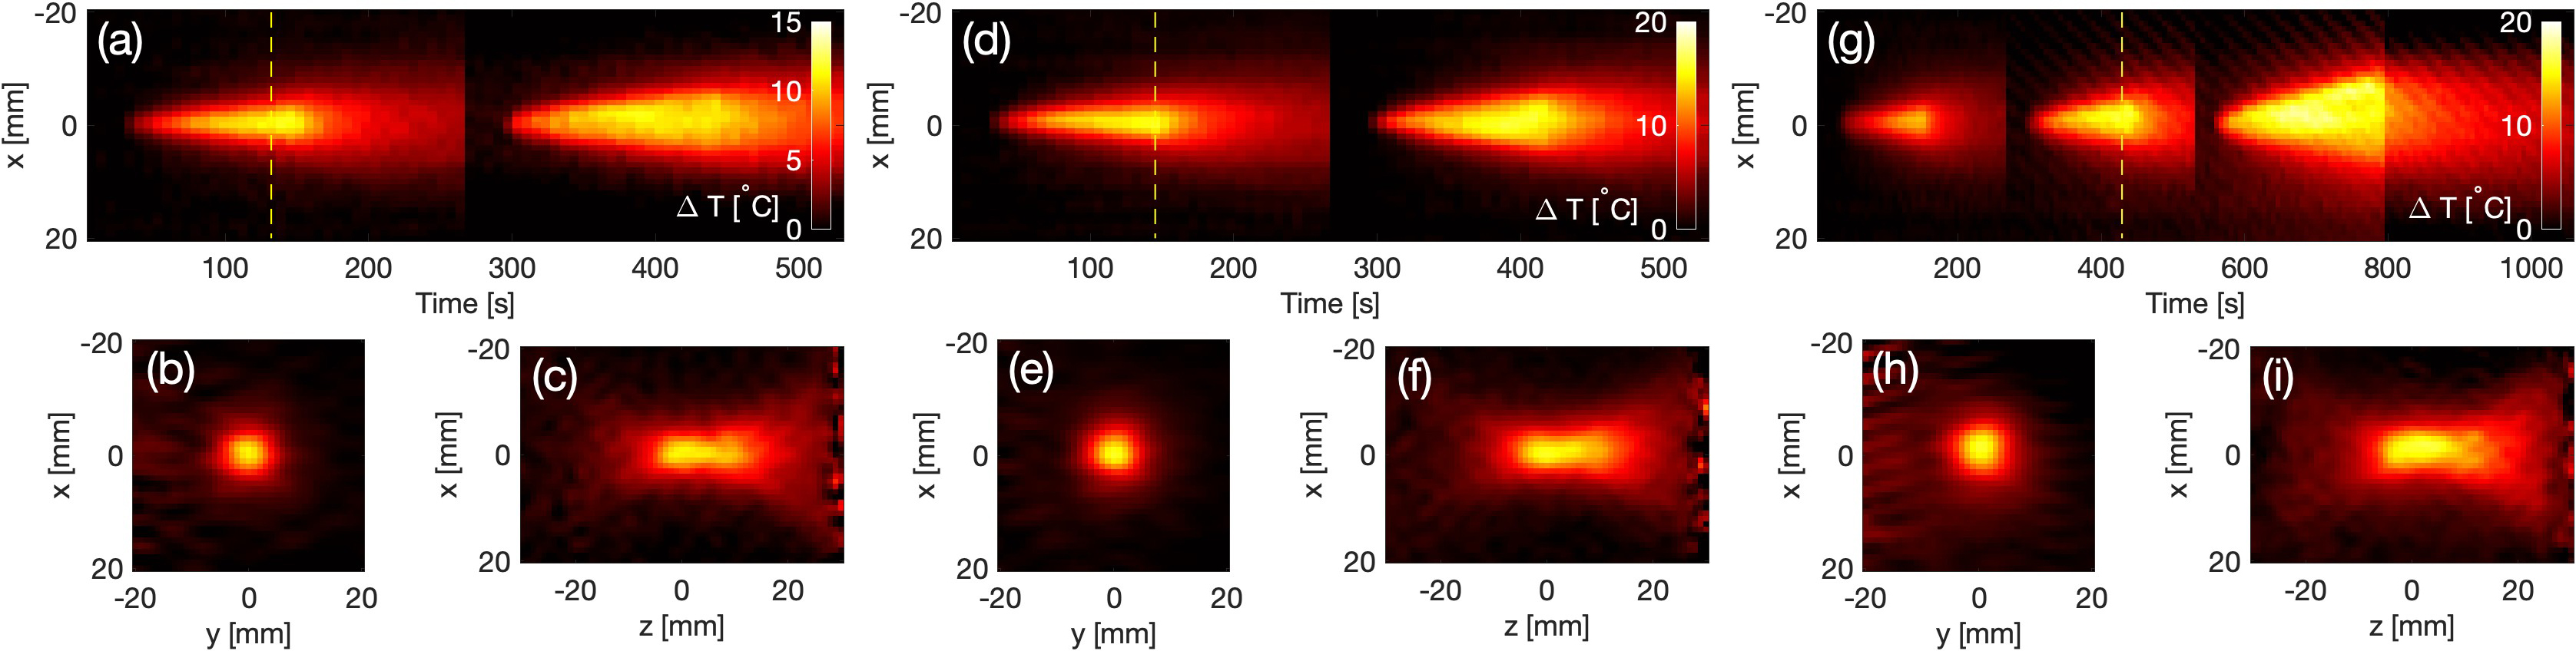
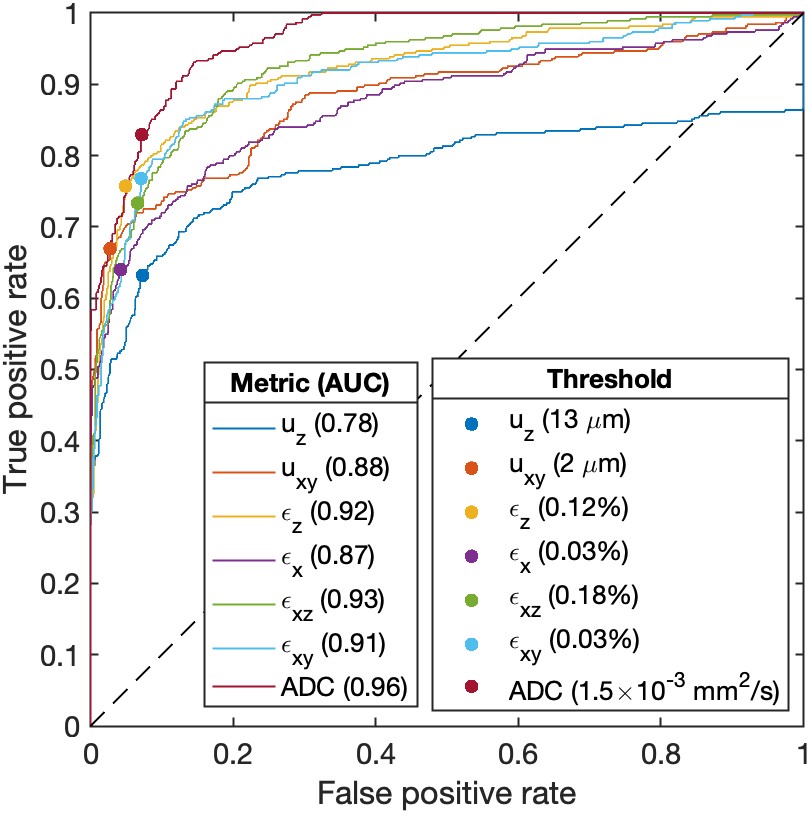
Before heating, axial displacement uz along the FUS beam measured in a 5x5x5 voxel ROI centered on the voxel with maximum uz was (mean ± standard deviation) 5.4 ± 0.53 𝜇m in the 5% sample, 2.1 ± 0.23 𝜇m in the 10% sample, and 1.2 ± 0.11 𝜇m in the 14% sample, Figure 2. Lateral displacement magnitude was 0.77 ± 0.17 𝜇m in the 5% phantom, 1.6 ± 0.24 𝜇m in the 10% phantom, 0.66 ± 0.09 𝜇m in the 14% phantom. ADC values were 1.45×10⁻³ ± 0.024, 1.35×10⁻³ ± 0.026, and 1.23×10⁻³ ± 0.025 mm2/s for the 5%, 10%, and 14% samples, respectively. During FUS heating, the maximum temperature was 34°C in the 5% phantom, 38°C in the 10% phantom, and 39°C in the 14% phantom, Figure 3.4,5 After the final heating, uz increased to 70 ± 39 𝜇m, 14 ± 6.8 𝜇m, and 21 ± 14 𝜇m, lateral displacement uxy increased to 8.9 ± 5.2 𝜇m, 1.2 ± 0.91 𝜇m, 2.7 ± 2.4 𝜇m, and ADC values increased to 1.64×10⁻³ ± 0.033, 1.43×10⁻³ ± 0.035, and 1.46×10⁻³ ± 0.027 mm2/s in the 5% phantom, 10% phantom, and 14% phantom, respectively. Strain components εzz, εxz, εxy increased by about one order of magnitude after heating, Figure 4. The ROC curve for uz had the smallest area of 0.78, and the curve for ADC had the largest area of 0.96. The ROC curve for uxy had an area of 0.88, and for strain components εzz, εxz, and εxy had areas above 0.9, Figure 5.DISCUSSION AND CONCLUSION
ADC had the most favorable ROC values which suggests that ADC was overall most effective in classifying solid or liquid material. Axial displacement, which is typically measured in MR-ARFI exams, performed the worst overall within this sample set. The strain components εzz, εxz, and εxy yielded better ROC values than either axial or lateral displacement. Imaging of FUS-induced strain fields may prove useful for FUS treatment monitoring and viscoelastic analysis of tissue in vivo.Acknowledgements
The MR-ARFI pulse sequence was acquired from University of Utah via MTA with UAB. This study was supported by a grant from the UAB Center for Clinical and Translational Science and by a Faculty Development grant.
References
1. Farrer AI, Odéen H, de Bever J, et al. Characterization and evaluation of tissue-mimicking gelatin phantoms for use with MRgFUS. J Ther Ultrasound. 2015;3:9. doi:10.1186/s40349-015-0030-y2.
2. Bever JT de, Odéen H, Hofstetter LW, Parker DL. Simultaneous MR thermometry and acoustic radiation force imaging using interleaved acquisition. Magn Reson Med. 2018;79(3):1515-1524. doi:10.1002/mrm.268273.
3. Anand L, Govindjee S. Continuum Mechanics of Solids. First edition. Oxford University Press; 2020.4.
4. Ninan G, Joseph J, Aliyamveettil ZA. A comparative study on the physical, chemical and functional properties of carp skin and mammalian gelatins. J Food Sci Technol. 2014;51(9):2085-2091. doi:10.1007/s13197-012-0681-45.
5. Osorio FA, Bilbao E, Bustos R, Alvarez F. Effects of Concentration, Bloom Degree, and pH on Gelatin Melting and Gelling Temperatures Using Small Amplitude Oscillatory Rheology. Int J Food Prop. 2007;10(4):841-851. doi:10.1080/10942910601128895
Figures