2302
Correlation of volume transfer constant measured from WEPCAST and DCE-MRI: A pilot study1Department of Radiology, Johns Hopkins University, Baltimore, MD, United States, 2Johns Hopkins University, Baltimore, MD, United States, 3Department of Neurology, Johns Hopkins University, Baltimore, MD, United States
Synopsis
Keywords: Blood vessels, Contrast Agent
There is an unmet need of a non-invasive technique to compute the water exchange between vascular and extra-vascular space in the brain since blood brain barrier (BBB) disruption is common in many pathologies and the state of art exogenous contrast agent based method cann’t be applied to all clinical population. So, the current study is aimed at computing a volume transfer constant (Ktrans) from water-extraction-with-phase-contrast-arterial-spin-labelling (WEPCAST) method and to compare it with the global Ktrans from DCE-MRI data. Results of the study finds a good correlation between Ktrans computed from WEPCAST and DCE-MRI data.Introduction
Blood-brain barrier (BBB) is one of the key components of the central nervous system which helps in restricting the exchange of macromolecules and neurotoxins to the extra-cellular and extra-vascular space. BBB disruption is associated with different pathologies such as Alzheimer’s, multiple sclerosis (MS), stroke, brain tumor etc1,2. The state of art clinical studies exploits invasive contrast agent based imaging methods such as dynamic contrast enhanced (DCE)-MRI for the quantitative evaluation of BBB disruption in these pathologies. The recently reported non-invasive water-extraction-with-phase-contrast-arterial-spin-labelling (WEPCAST) provides a global estimate of BBB permeability to water by detecting the labelled spins in the draining veins of the human brain, particularly superior sagittal sinus (SSS)3. Since DCE-MRI is not widely used in clinics for most of the neurological pathologies like Alzheimer’s, MS etc. and since those diseases affect the major portions of the brain, WEPCAST could potentially have a clinical benefit in these conditions. So, the current study is designed to evaluate and demonstrate the correlation of global volume transfer constant (Ktrans) measured from WEPCAST and DCE-MRI (from whole brain frontal gray matter), which could open-up a possibility of addressing the limitations of DCE-MRI in neurological evaluations.Methods
Ten subjects (3 male and 7 female) with mean age 40.3 were included in this study. Study population included 4 healthy volunteers (mean age 25), and 6 MS patients (mean age 46.8)WEPCAST MRI were performed with the following parameters: FoV=200×200mm2, slices thickness=10mm,spatial resolution=64×64,TR=9200ms,TE=9.5ms,labeling duration=4000ms, post-labeling delay=3000ms, VENC=20cm/s, GRAPPA=3.DCE-MRI data were acquired from all subjects with the following parameters. FoV=210×210×100 mm3, slices thickness=5mm, spatial resolution=192×192, temporal resolution=14.7 s, TR=8 ms, TE=3ms and flip angle=150. All subjects were administered with 0.01mM/Kg of Gd-DO3A-butrol at the 3rd timepoint at a rate of 3mL/s. To perform T1 mapping, multiple images were acquired at flip angles (FA) 20, 50, 100, 120, 150 with TR=5.14 s and TE=2.22 s before CA administration.
WEPCAST data processing are specifically described elsewhere3. In short, it measures the labeled blood signals in the SSS to estimate the water extraction fraction (E) which determines the fraction of the water that exchanged into the brain tissue at the capillary-tissue interface. Global CBF f was also quantified by phase contrast (PC) velocity MRI and normalized by whole brain volume measure by a T1-MPRAGE scan4. Permeability-surface-area product (PS) thus can be directly calculated from E and f according to the Renkin-Crone Model3
DCE-MRI data processing was performed using in-house scripted MATLAB based application. As a pre-processing, all DCE-MRI images were co-registered with respect to pre-contrast T1-W images acquired at FA 150 using SPM5. Initial segmentation of gray matter (GM) regions was also performed using SPM. Frontal GM regions were then manually segmented from the SPM generated mask and structural images. Mean curves from the segmented GM were then computed and mean signal-intensity (S(t)) curves were generated from it. S(t) were converted to concentration time (C(t)) curves using the T1 maps computed from the multi-FA data6. Arterial input function (AIF) was manually determined from SSS and a Levenberg-marquardt based non-linear least square method was used to fit eTofts7 model to estimate Ktransve (extracellular-volume-fraction) and vp (plasma-volum-fraction) using Eq. 2
$$C(t) = v_{p} C_{p}(t) + K^{trans}\int C_{p}(t).exp(-Kep(t-\tau )) d\tau $$ (2)
Where Kep = Ktrans / ve, t1 is the bolus arrival time (BAT) and tn is the final temporal point, and Cp is the AIF.
Since Ktrans computed using Eq.2 is a combination of CBF and PS in unknown proportion, we introduce a new Ktrans for comparison from the WEPCAST data, and is computed using Eq. 3 as given below:
Ktrans = E. CBF (3)
To evaluate the correlation of Ktrans computed from WEPCAST and DCE-MRI, Pearson’s correlation co-efficient and a linear regression model were used. Also, a 2-tailed student’s t-test was performed to test the significance level. Co-efficient of variation (CoV) was used as a metric to evaluate the inter-subject variations of mean C(t), AIFs and Ktrans.
Results and Discussion
Figure-1 shows the WEPCAST control and difference images (figure-1(a),(b)) and DCE-MRI images at the baseline (c), first-pass peak (d) and final temporal point (e). Figure-2 shows the error bars of C(t) (red plot) and AIF (blue plot) measured across the cohort (figure-2 (a)) along with the box plot of estimated Ktrans values. eTofts model was able to fit all the mean curves with the estimated AIF from SSS with a mean good-ness of fit (R2) > 0.85. Even though relatively large variability in AIF (CoV = ~53%) introduced variabilities in Ktrans from DCE-MRI data, it didn’t affect the reliability of data fitting and computation. Ktrans computed from DCE-MRI and WEPCAST data were in good agreement as shown in figure-3 with correlation co-efficient 0.76 (p = 0.01). It could be noted that a linear regression model fits the data with good agreement. Since the sample size of the data presented in this study is relatively small, further optimization and validation of this study is required in much larger cohort before clinical translation.Conclusion
In conclusion, global volume transfer constant (Ktrans) computed from WEPCAST as well as from DCE-MRI data (whole brain fontal gray matter) exhibit good correlation.Acknowledgements
No acknowledgement found.References
1. Wong SM, Jansen JFA, Zhang CE, et al. Measuring subtle leakage of the blood–brain barrier in cerebrovascular disease with DCE-MRI: Test–retest reproducibility and its influencing factors. Journal of Magnetic Resonance Imaging. 2017;46(1):159-166. doi:10.1002/jmri.25540
2. Li KL, Zhu X, Zhao S, Jackson A. Blood–brain barrier permeability of normal-appearing white matter in patients with vestibular schwannoma: A new hybrid approach for analysis of T1-W DCE-MRI. Journal of Magnetic Resonance Imaging. 2017;46(1):79-93. doi:10.1002/jmri.25573
3. Lin Z, Li Y, Su P, et al. Non-contrast MR imaging of blood-brain barrier permeability to water. Magn Reson Med. 2018;80(4):1507-1520. doi:10.1002/mrm.27141
4. Aslan S, Xu F, Wang PL, et al. Estimation of labeling efficiency in pseudocontinuous arterial spin labeling. Magn Reson Med. 2010;63(3):765-771. doi:10.1002/mrm.22245
5. Ashburner J, Chen C chuan, Moran R, Henson R, Phillips C. SPM12 Manual The FIL Methods Group ( and honorary members ). :1-508.
6. Conte GM, Altabella L, Castellano A, et al. Comparison of T1 mapping and fixed T1 method for dynamic contrast-enhanced MRI perfusion in brain gliomas. Published online 2019:3467-3479.
7. Sourbron SP, Buckley DL. On the Scope and Interpretation of the Tofts Models for DCE-MRI. 2011;745:735-745. doi:10.1002/mrm.22861
Figures
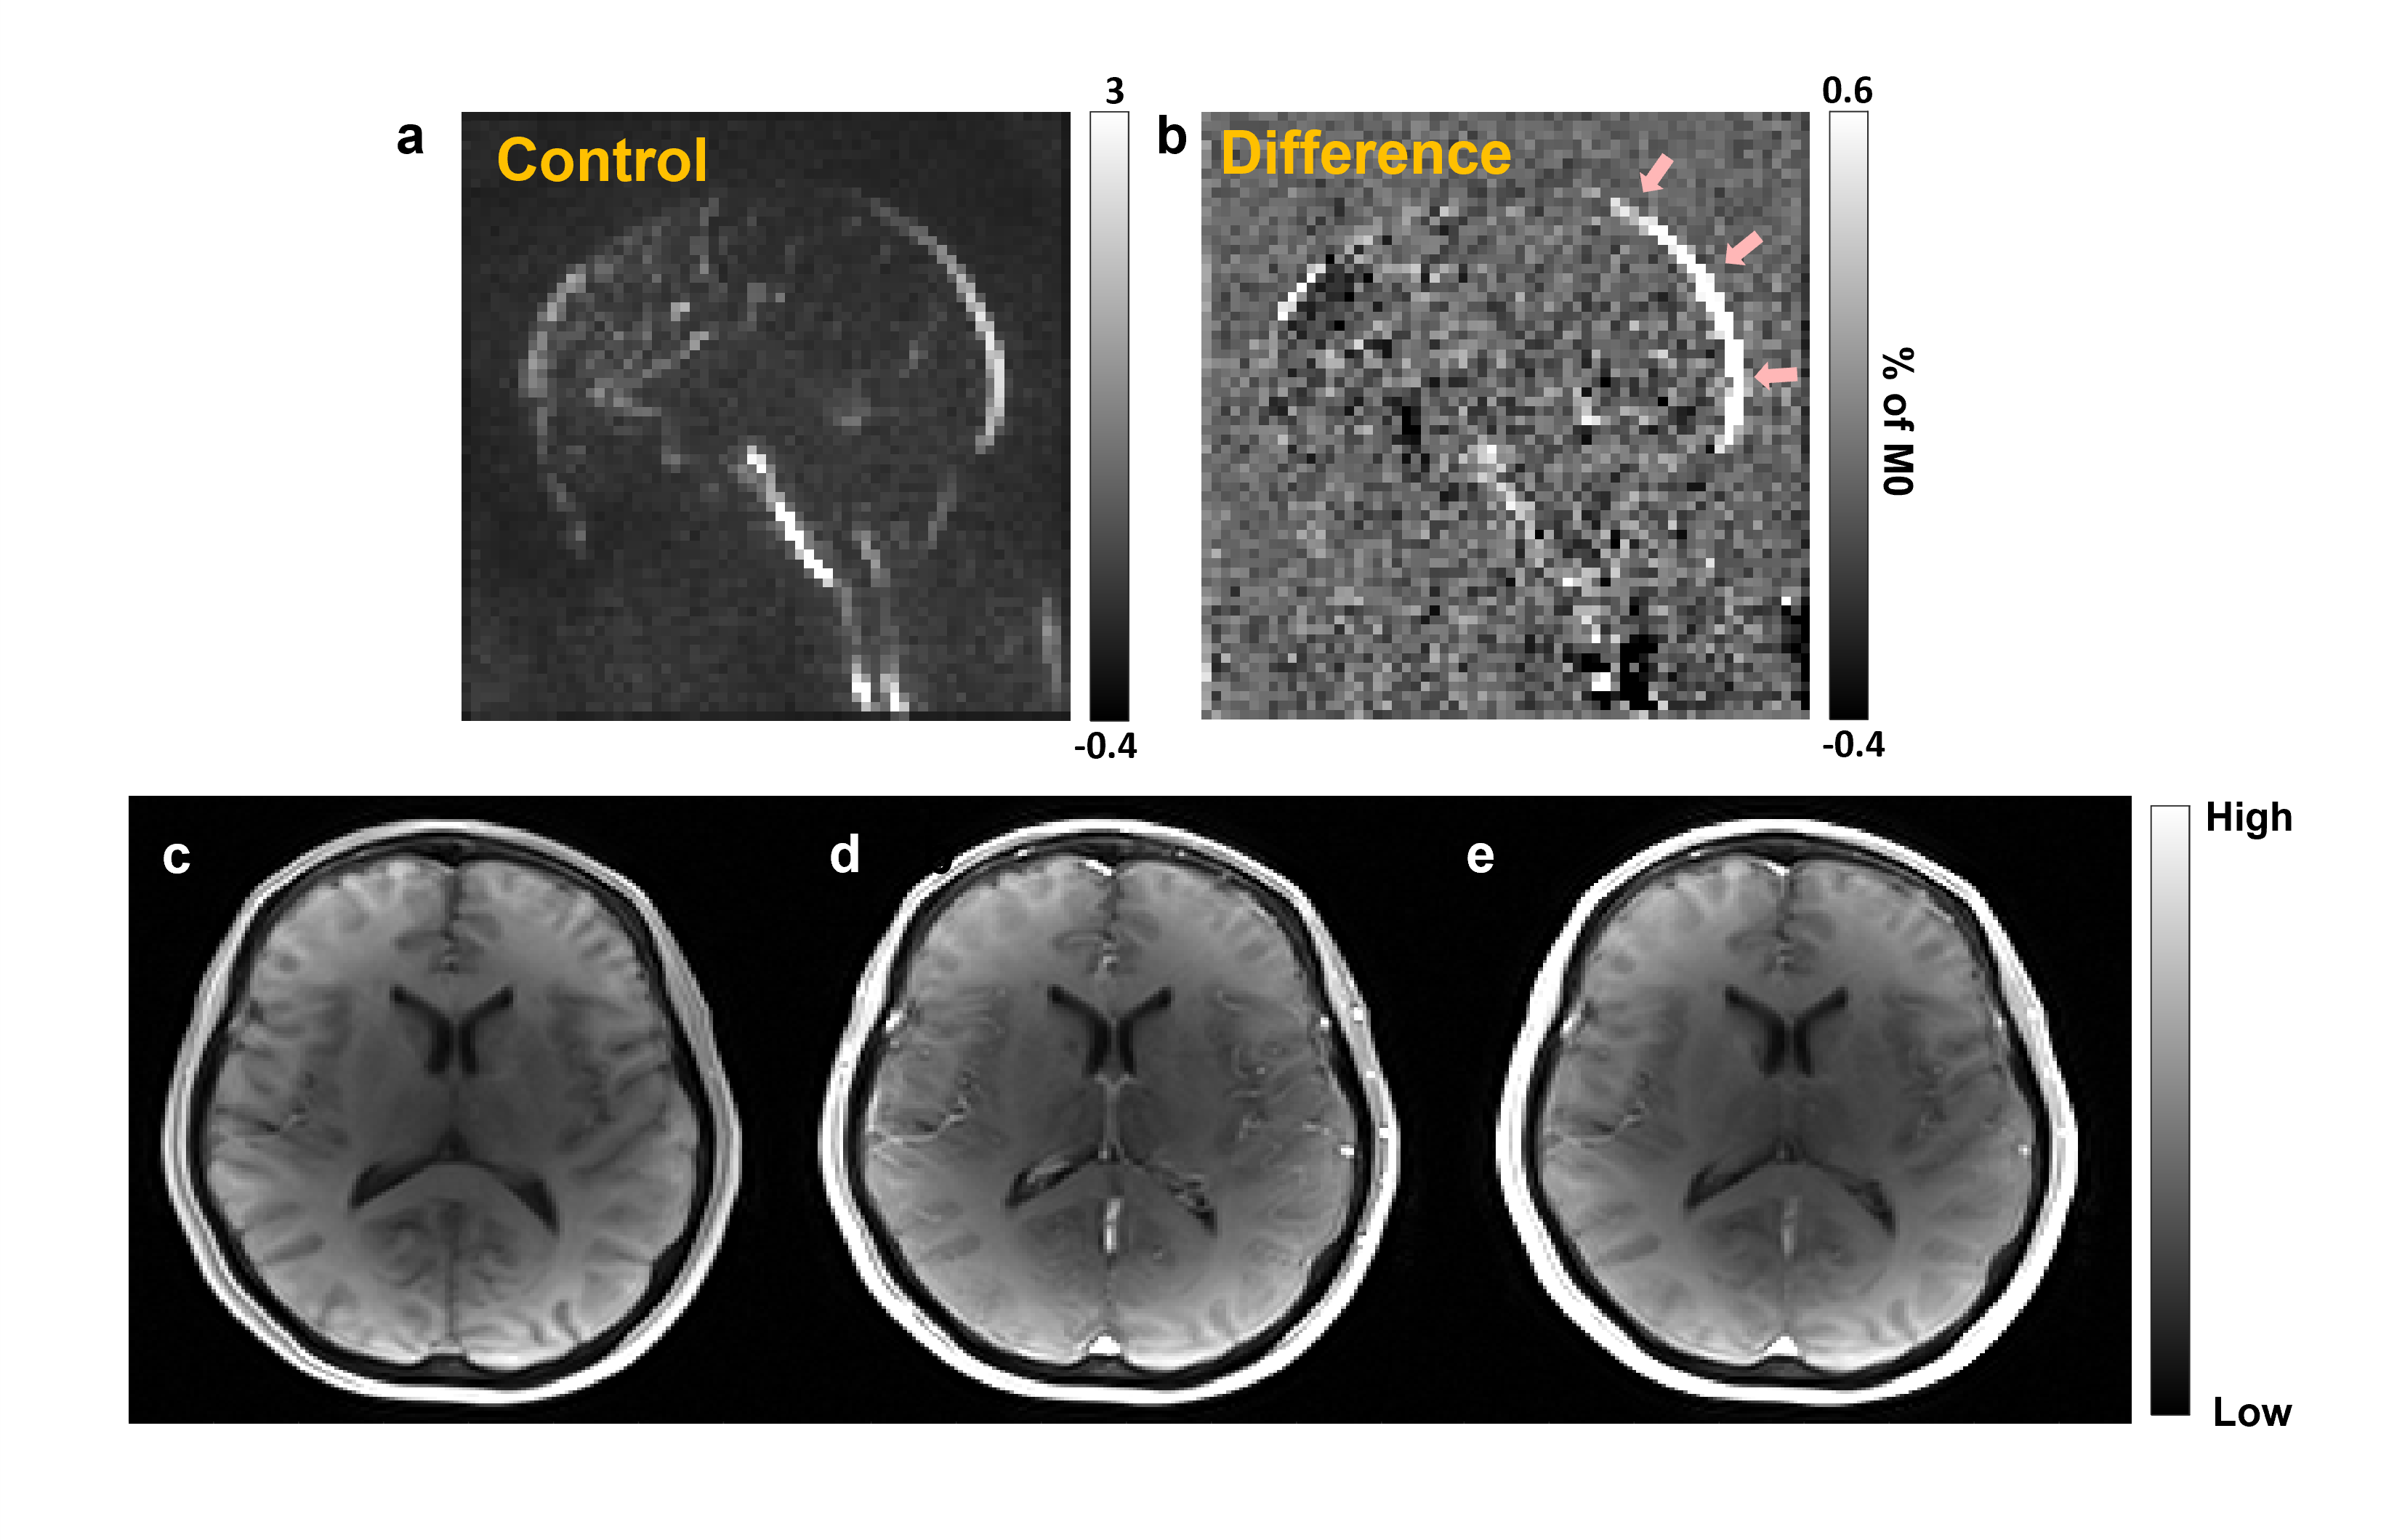
Figure-1: (a), (b) show the control and difference images computed from WEPCAST data. Arrows in (b) highlights the regions where we computed the global Ktrans. (c)-(e) represent the DCE-MRI dunamic images acquired before contrast agent intake (c), peak of first-pass (d) and during final temporal point (e)
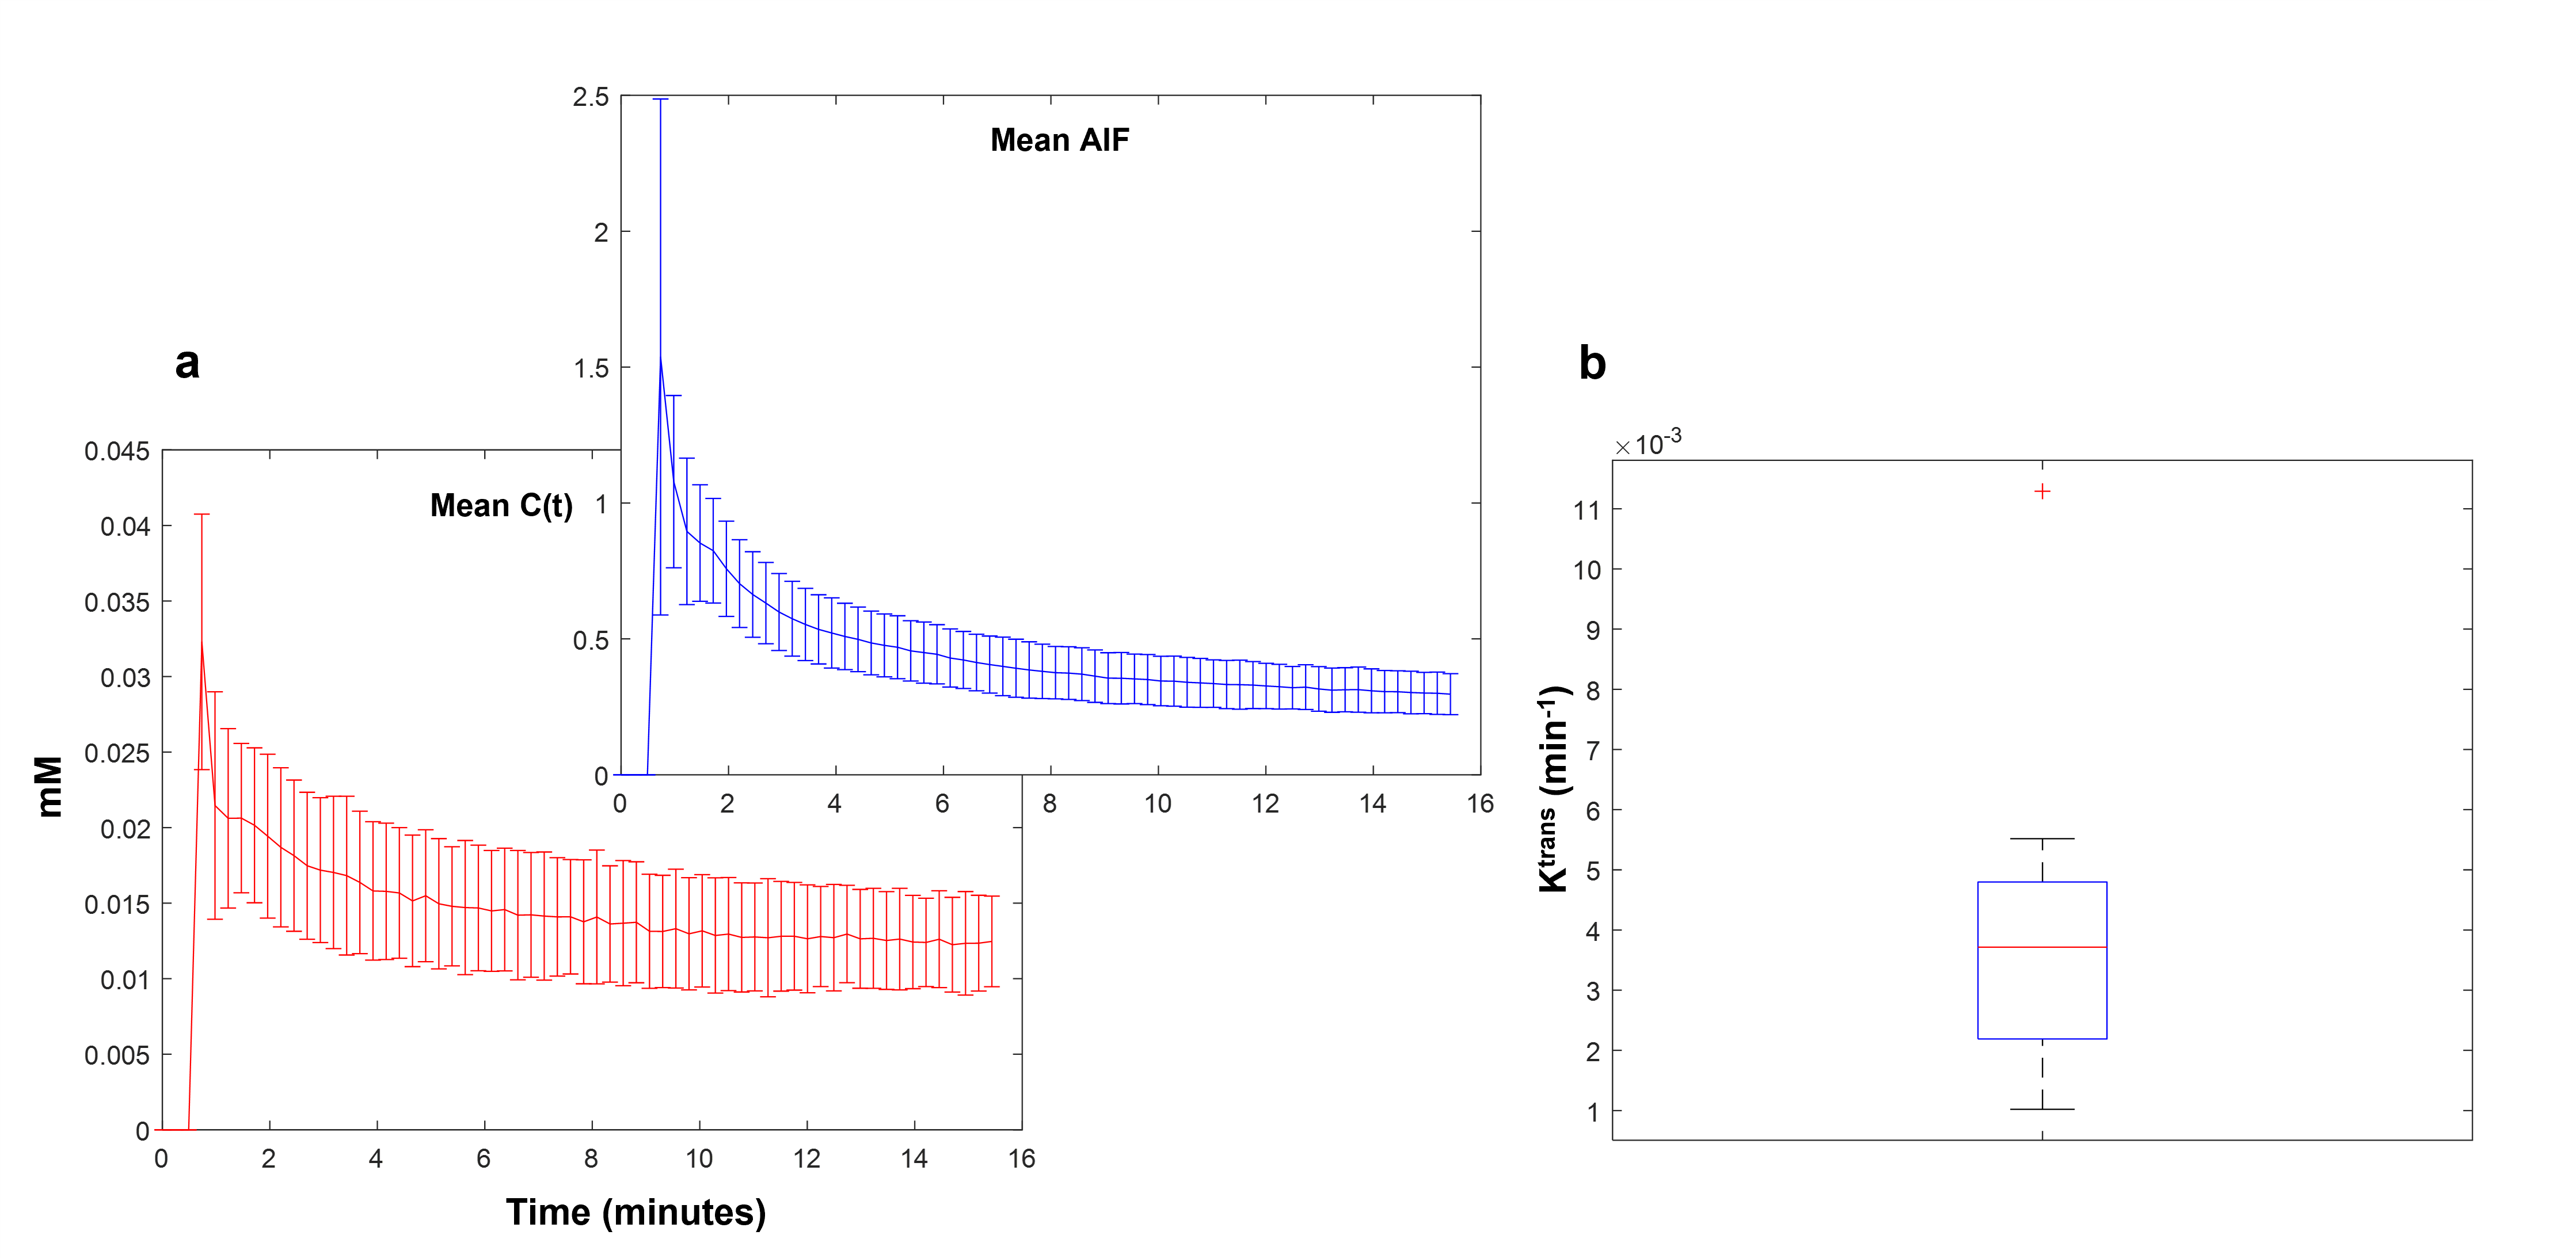
Figure-2: Panel (a) shows the error bar of mean concentration time curves computed across all subjects from the gray matter (red plot) and the mean AIF computed across the subject (blue plot). (c) shows the box-whisker diagram of Ktrans computed from all the curves.
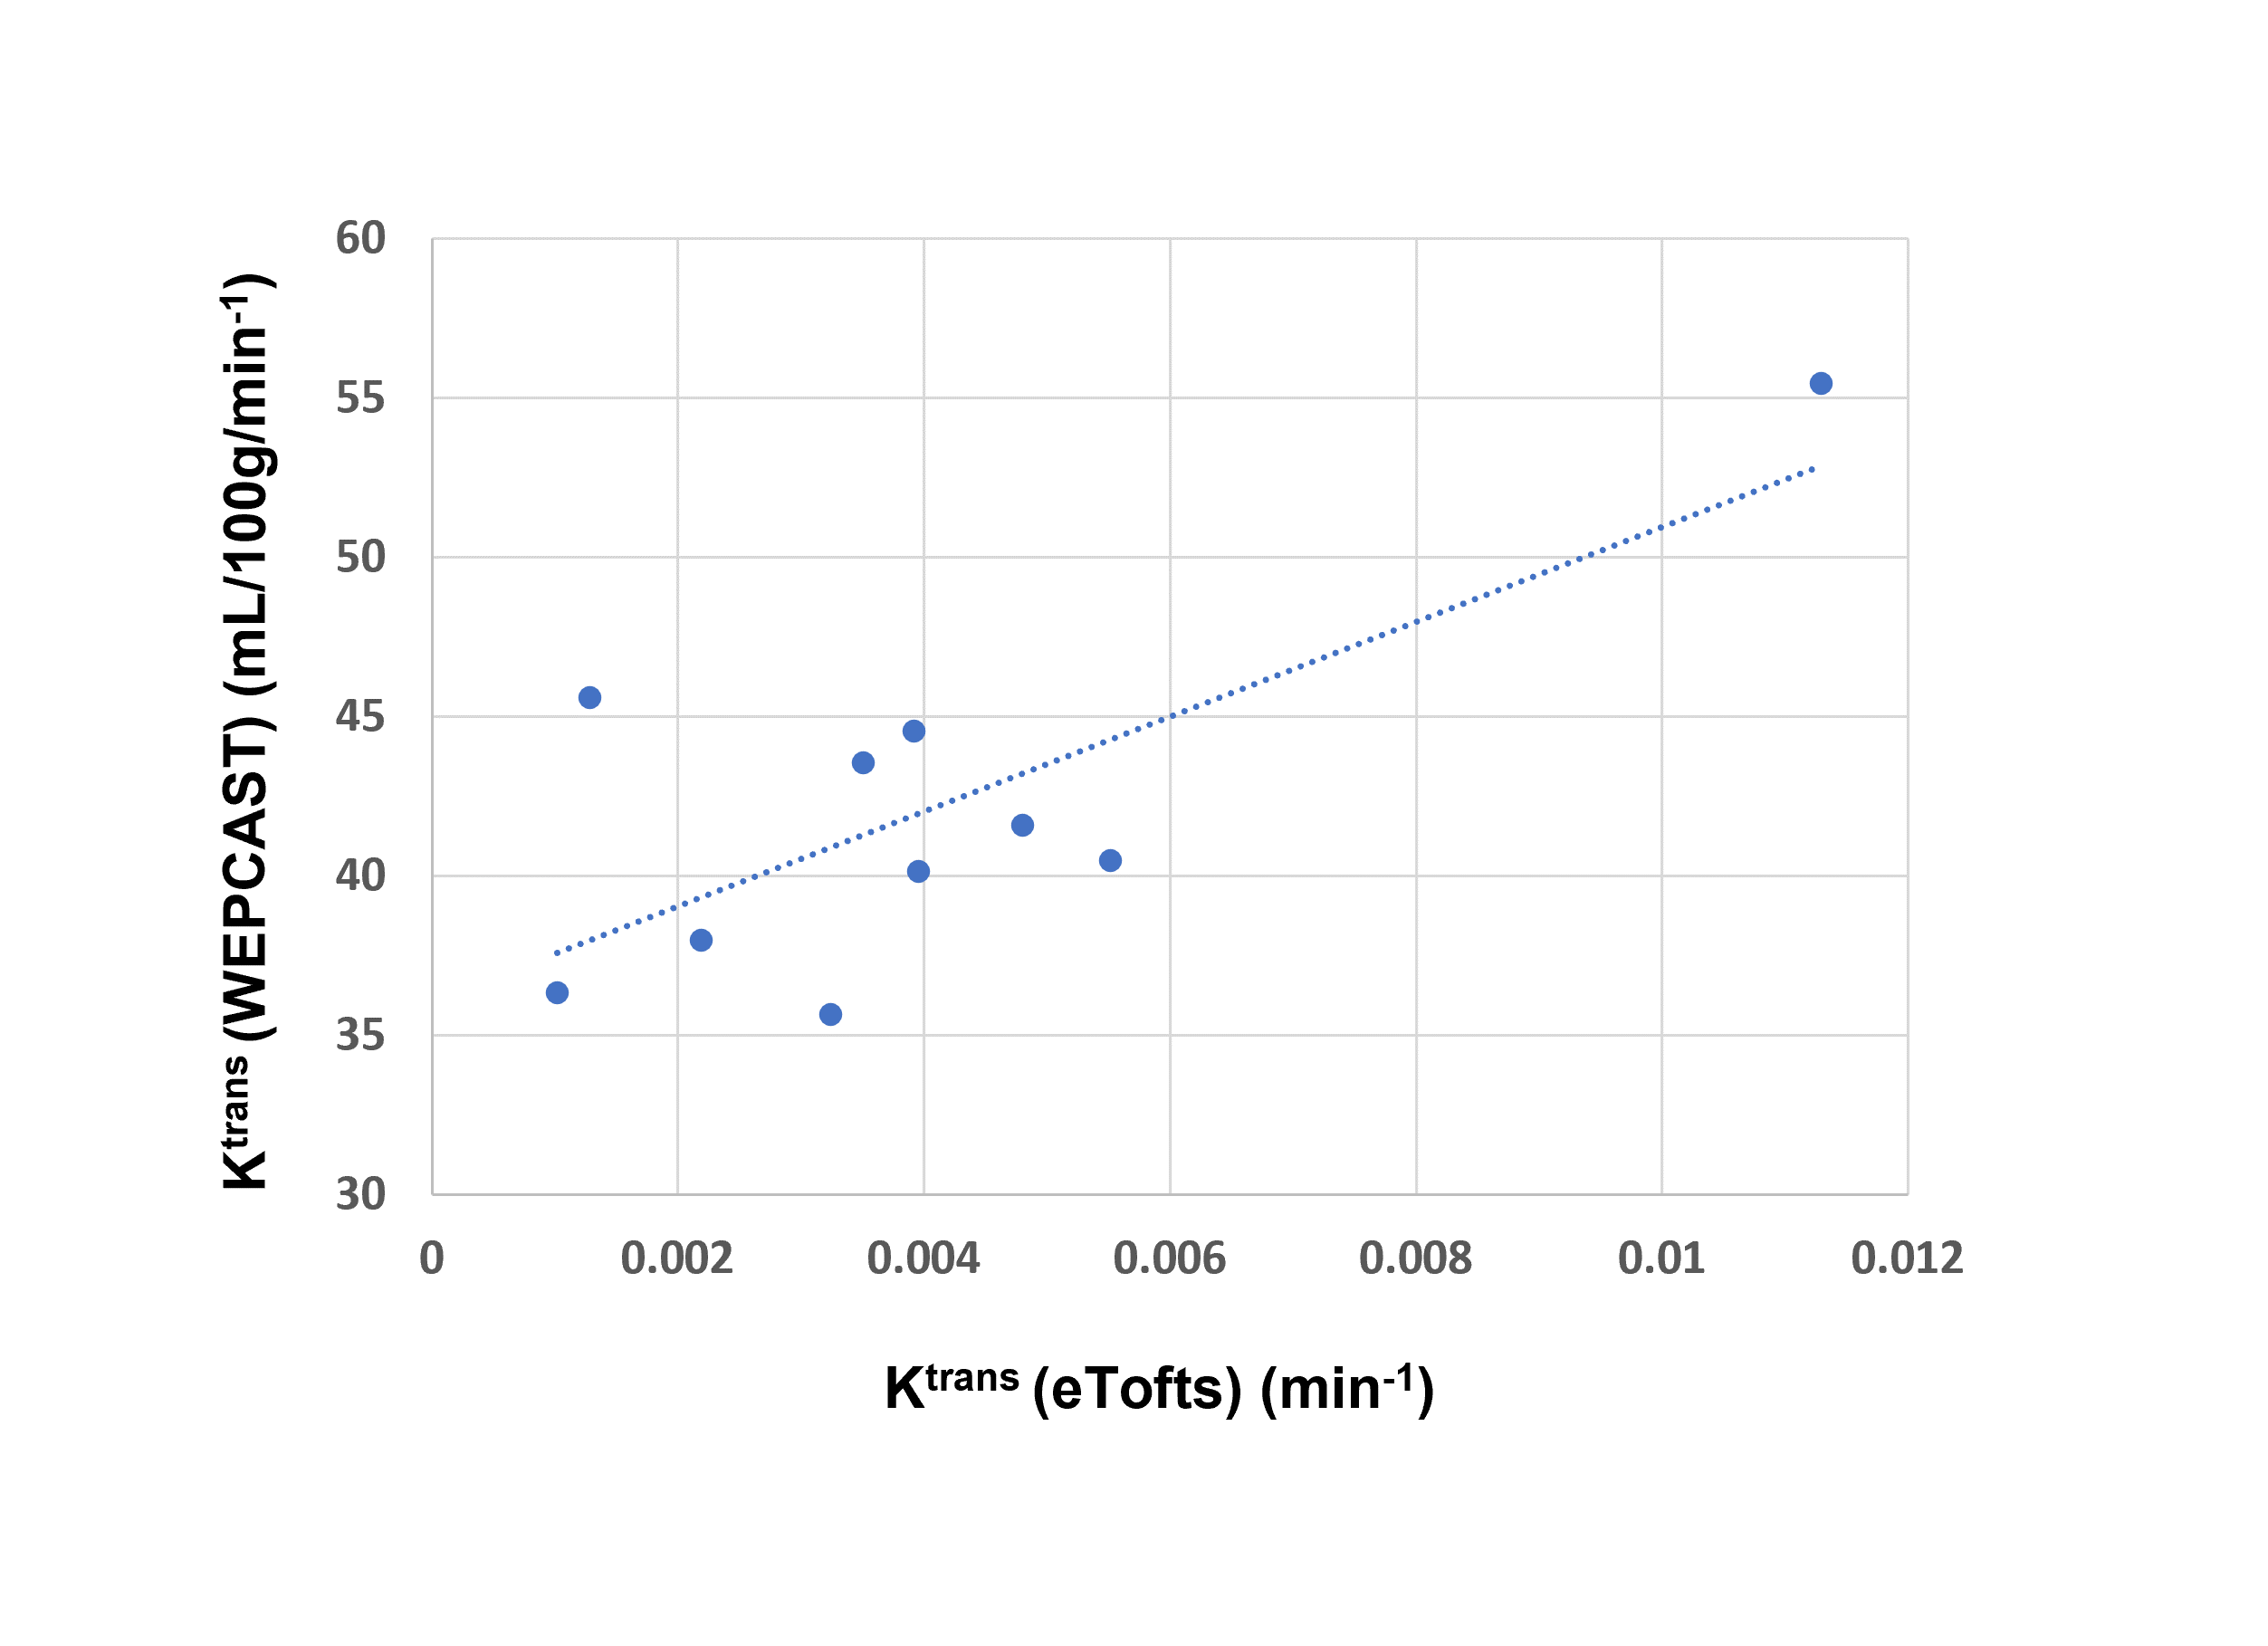
Figure-3: Figure shows the scatter-plot of Ktrans computed from WEPCAST and DCE-MRI data across all subjects (p = 0.01)