2299
The relationship between unruptured intracranial aneurysm morphology and hemodynamics - 7T 4D flow MRI1Radiology, UMC Utrecht, Utrecht, Netherlands, 2Pediatric Cardiology, UMC Utrecht, Utrecht, Netherlands, 3Neurology, UMC Utrecht, Utrecht, Netherlands
Synopsis
Keywords: Blood vessels, Velocity & Flow, High-Field MRI, Aneurysm
We investigated relationships between unruptured intracranial aneurysm (UIA) morphology and hemodynamics parameters measured with 7T 4D flow imaging in 35 patients with an UIA. Blood flow measured in the UIA was positively correlated with UIA size, and negatively correlated with elongation and shape index of UIA (a decrease in shape index is characteristic for unstable UIA (either growing or rupture)). Therefore, blood flow is an important parameter for risk evaluation of UIA. The described relations help toobtain better insight in risk parameters of UIA development, growth, and possible rupture.Introduction
Approximately 3% in the general adult population has an unruptured intracranial aneurysm (UIA) (1). 3D quantification of UIAs allow for 3D morphology or shape measurements potentially giving more insight into growth and rupture risk status of UIA (2). Detailed measurements of flow and hemodynamics of UIAs can be obtained with 7T MRI and a 4D flow protocol (3). In this paper, we investigate relationships between aneurysm hemodynamics obtained from 7T 4D flow imaging, and aneurysm morphology. Additionally, the relationship between the maximum wall shear stress (WSSMAX) in the UIA and aneurysm size is studied. The overall aim is to obtain insight in the pathophysiology of intracranial aneurysms development.Methods
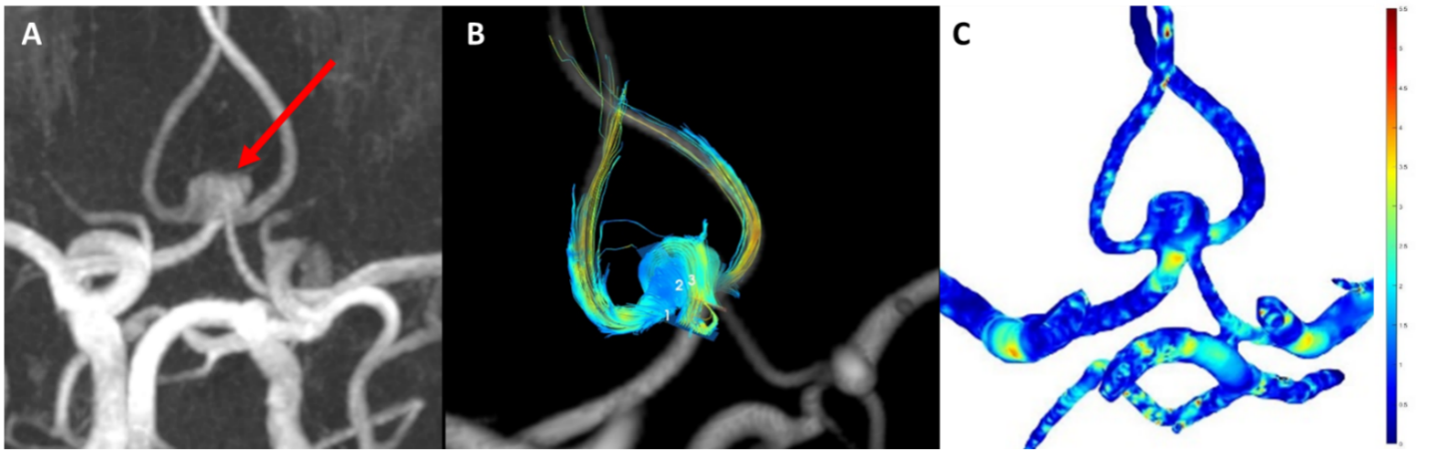
35 patients with an UIA underwent for radiological follow-up a 3T MRI which included a 3D TOF-MRA (0.5mm isotropic) acquisition. In addition, a 7T MRI scan (Philips Healthcare, Best, The Netherlands) was performed using a 32-channel receive coil for the 4D PC-MRI acquisition and the AMC ‘PROspective Undersampling in multiple Dimensions’ (PROUD) software patch. 4D PC-MRI acquisition parameters were as follows: angulated coronal FOV 190(Feet-Head)x190(Right-Left)x20(Anterior-Posterior)mm3, acquired resolution=0.5x0.5x0.5mm3, TR/TE=7.0/2.2ms, VENC=50cm/s, FA=10° with an acquisition duration of 10 minutes. We reconstructed 12 cardiac phases, and the reconstructed temporal resolution was 83ms for an average heart rate of 60 bpm. 4D PC-MRI datasets were analysed using CAAS MR Solutions v5.1.2 software (Pie Medical Imaging, Maastricht, The Netherlands) (Figure 1). CAAS automatically generates the centerline and perpendicular slices which were visually checked and automatically propagated to create volumetric flow rate traces and separate velocity and area traces over the cardiac cycle. Velocity traces were obtained for each UIA, for three planes located in the middle of the UIA. The velocity pulsatility index (vPI=(Velocitymax-Velocitymin)/Velocitymean) was calculated from each velocity trace. WSS waveforms were calculated for a manually drawn ROI covering the complete UIA, using an in-house-developed software in Matlab R2018a (4). The WSSMAX was calculated for all patients with UIAs and expressed as the spatial mean value.2D morphological measurements were manually performed on the TOF images by an experienced neuroradiologist (ICvdS), yielding UIA length and width. Besides, ten morphology metrics were obtained from a 3D segmentation of the UIA, using in-house developed software (implemented in MeVisLab). We categorize these morphology measurements in 4 different subgroups based on; 1. Size (2D UIA measurement, volume, and area), 2. volume and area ratios (compactness1, compactness2 and sphericity), 3. axis length ratio (elongation and flatness) and 4. local form (curvedness and shape index). A detailed description of the measurement procedure has been described previously (2). To study possible relationships between hemodynamic measurements and morphologic measurements,Pearson’s correlation coefficients were calculated. Next, a scatterplot of WSSMAX vs. aneurysm size was created and the correlation between these was computed. Significance threshold was P<0.05.Results
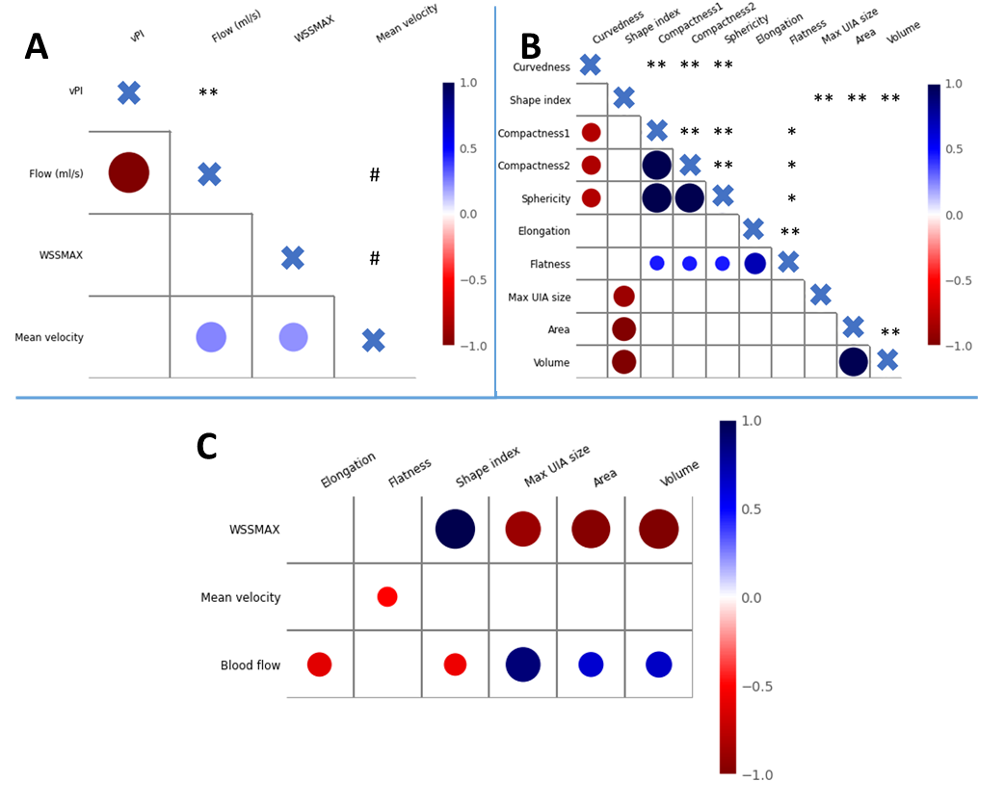
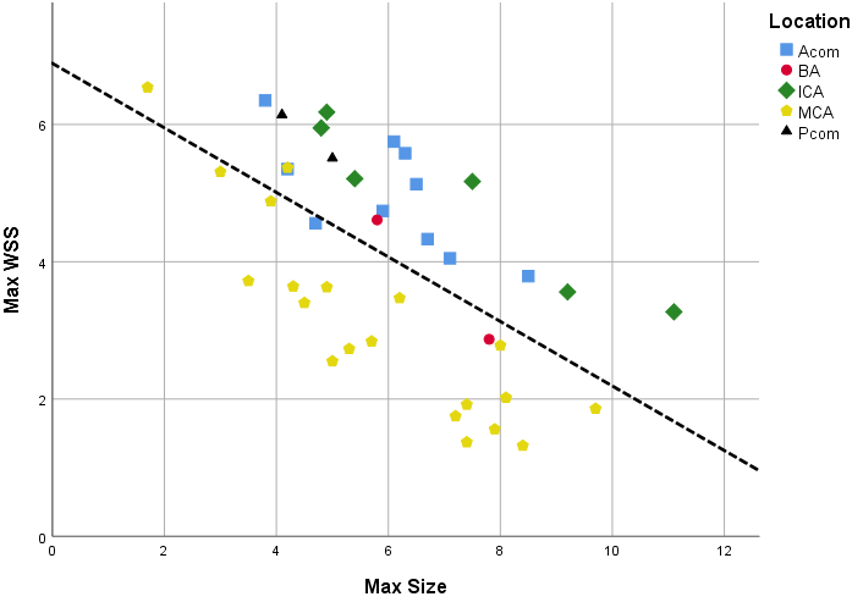
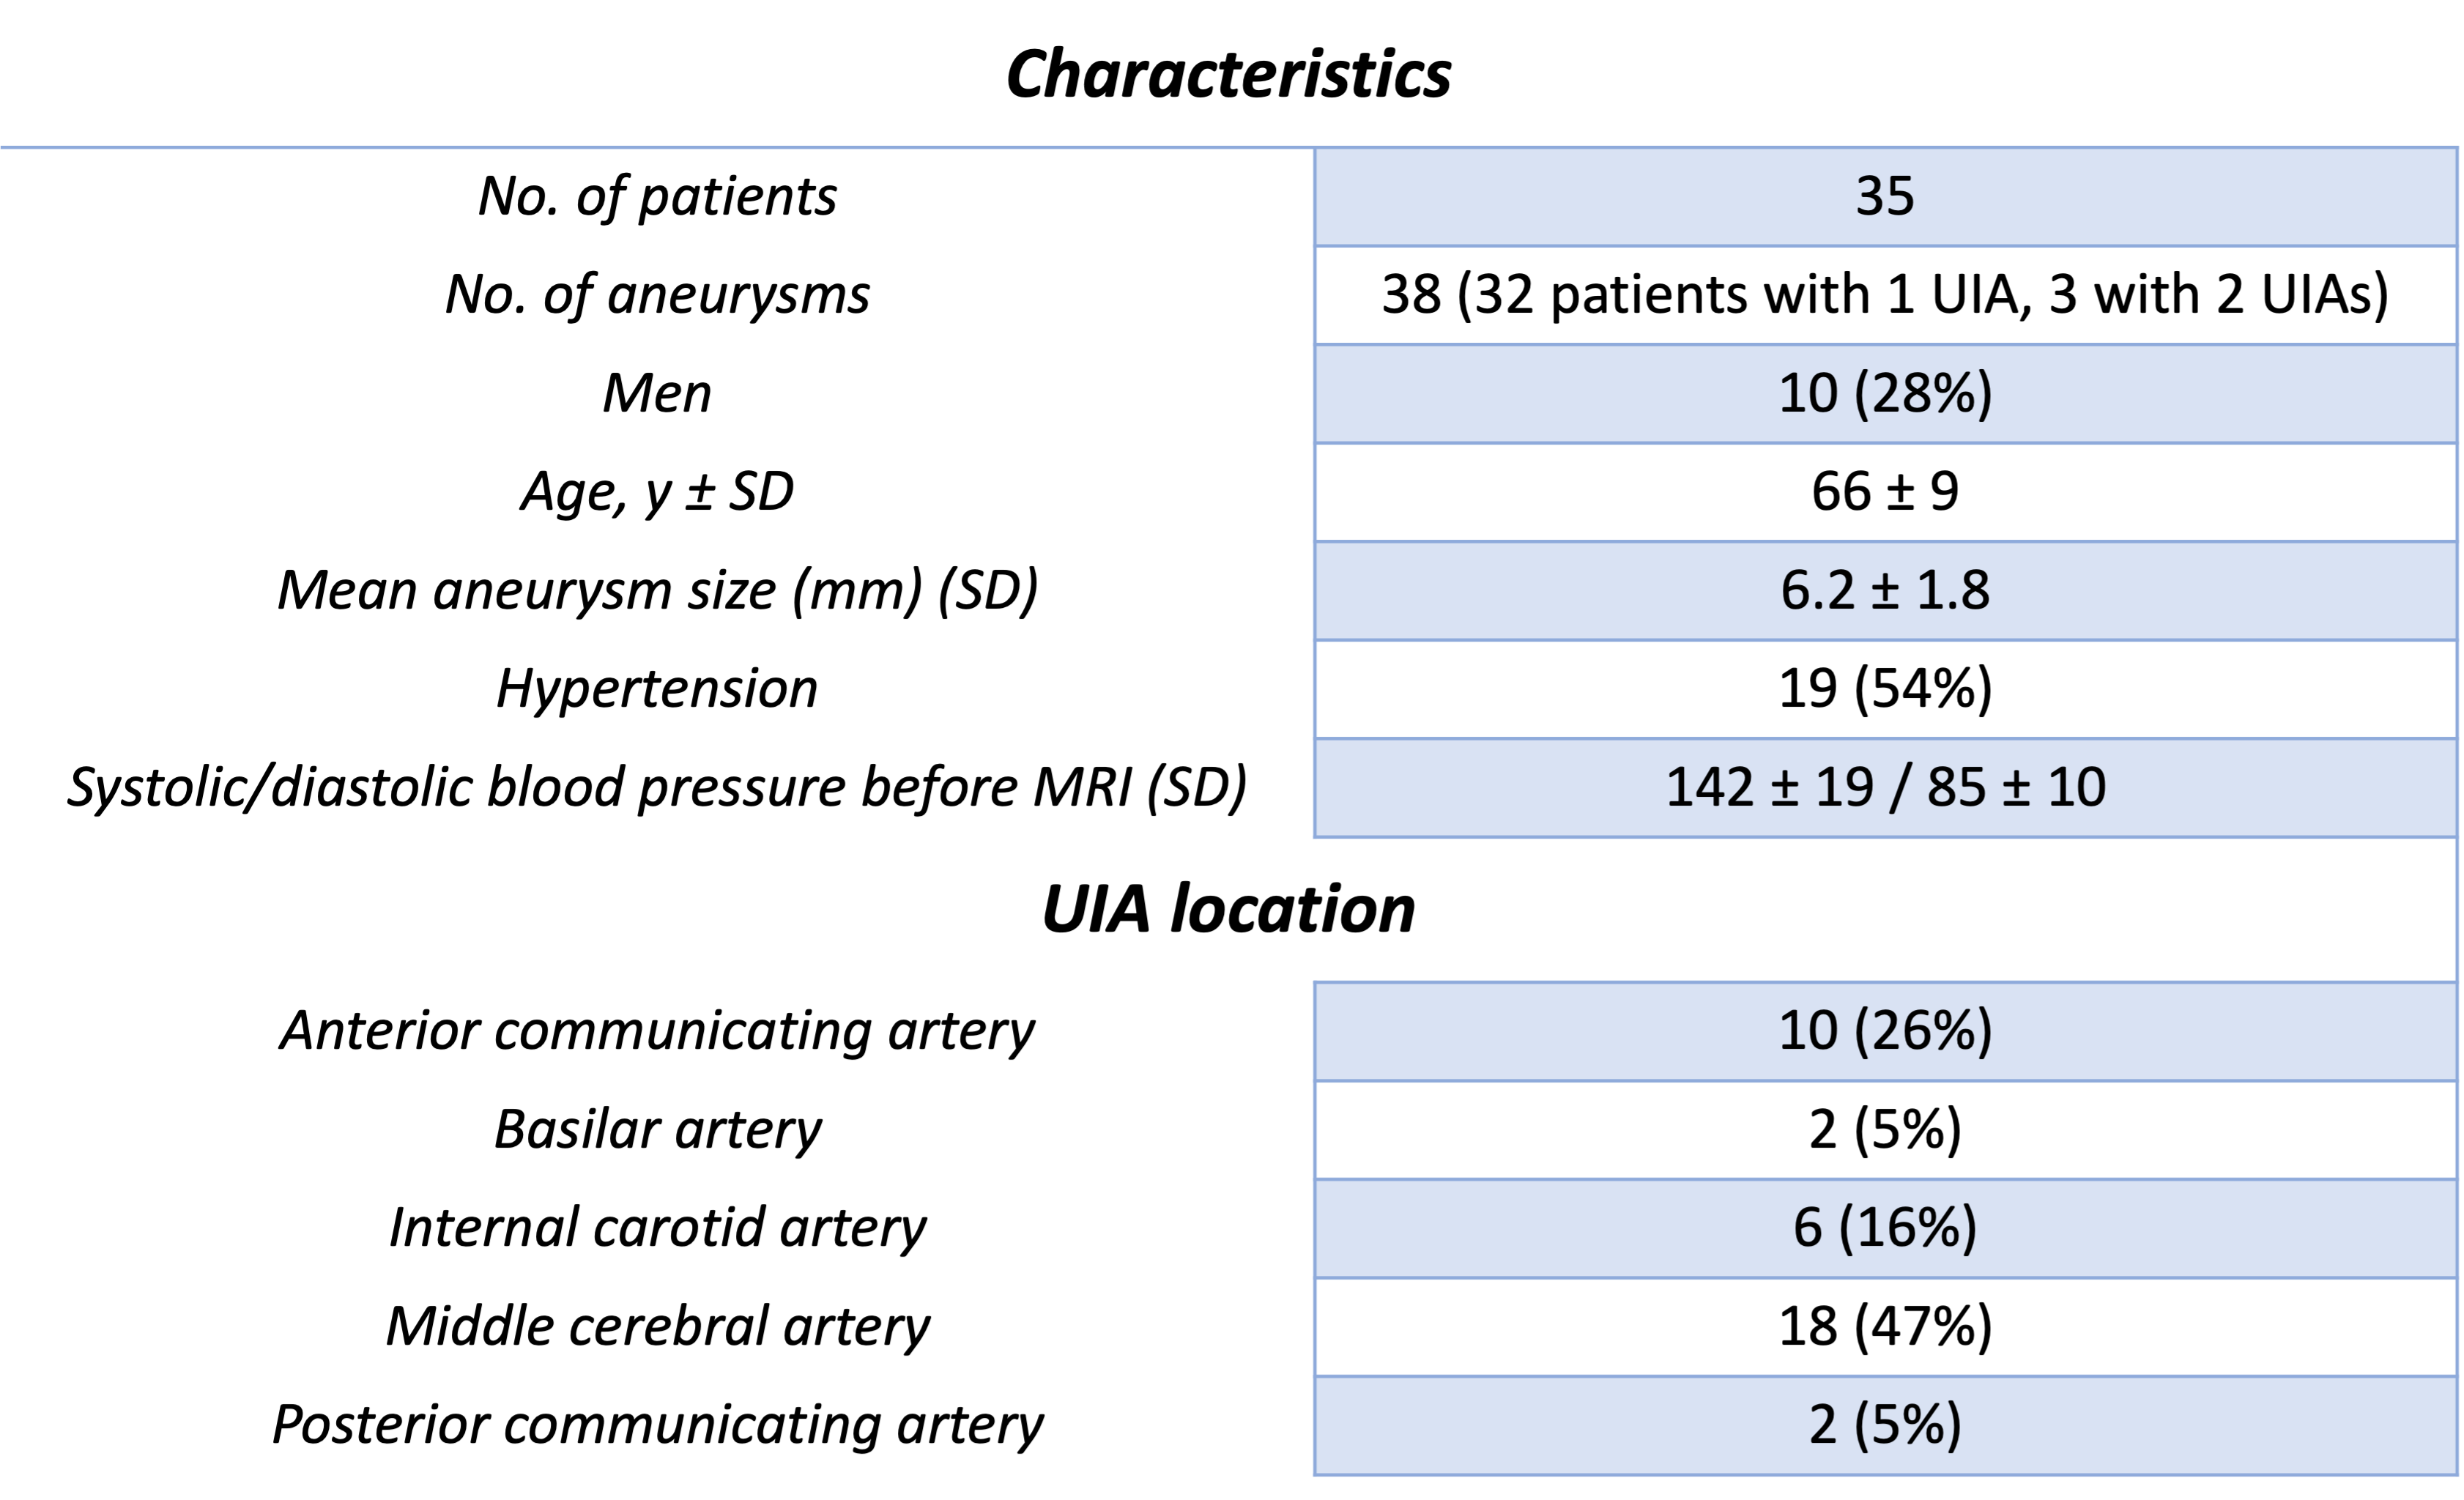
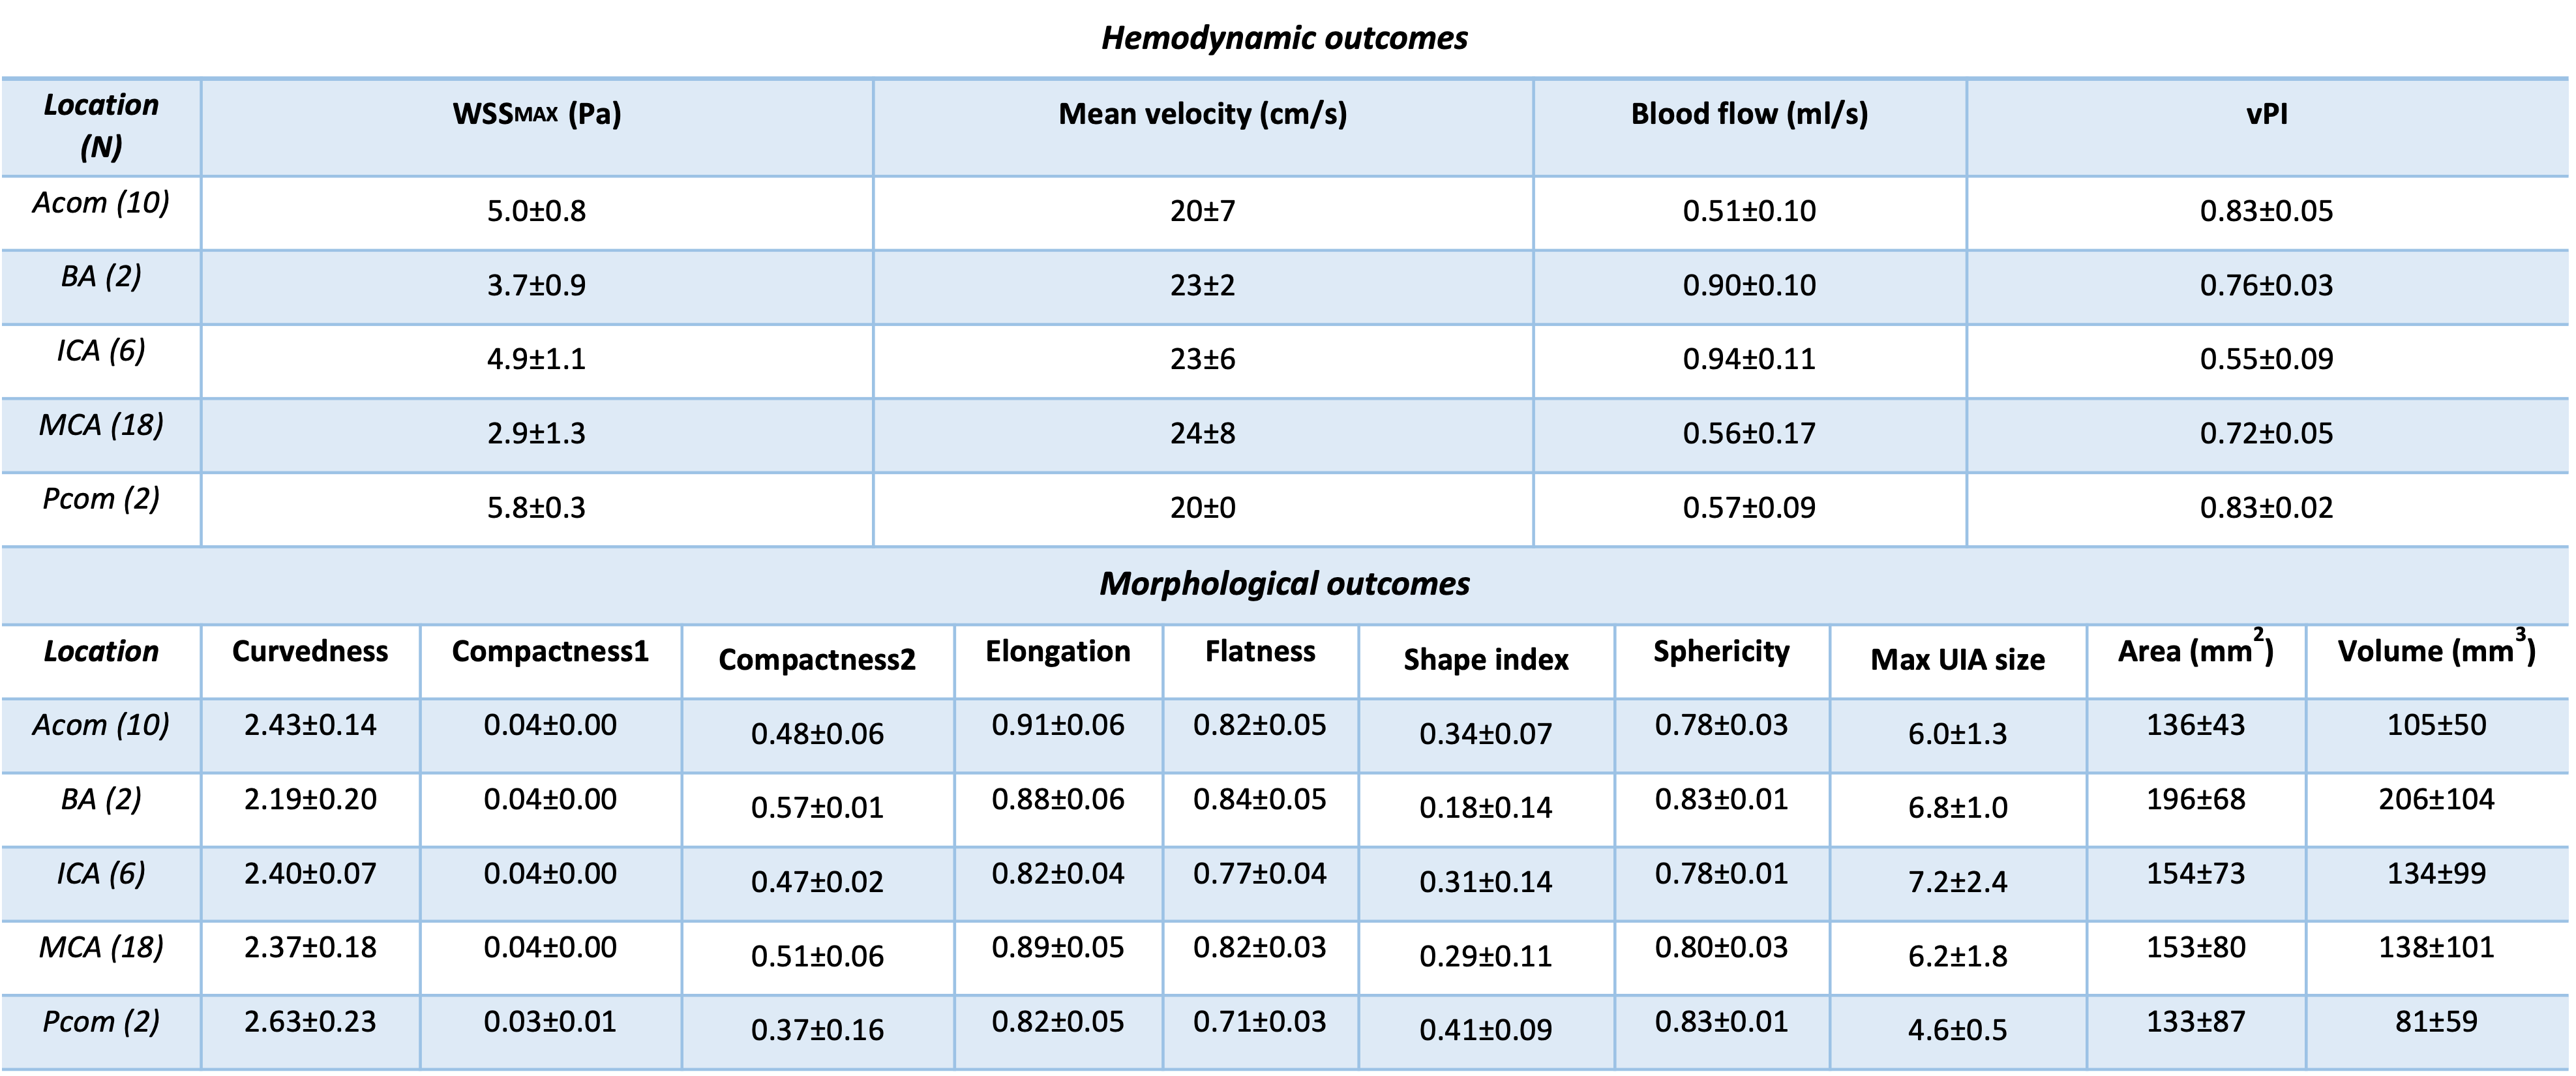
Table 1 shows the baseline characteristics of the 35 UIA patients, including the UIA locations. Thehemodynamic and morphological outcome measurements per UIA location are shown in Table 2. The significant hemodynamic and morphology correlations are shown in Figure 2.The blood flow correlated positively with UIA area and volume, but negatively with elongation and shape index. A negative correlation was found for WSSMAX versus the area and volume of an UIA. A positive correlation between WSSMAX and shape index was found. vPI was not associated with any morphological outcome. WSSMAX decreased linearly with increasing UIA size (Figure 3), with statically significant correlation (R2=0.78, p<0.001).Discussion
This study showed multiple hemodynamic and morphologic relationships in studying UIA. Blood flow was positively correlated with UIA size, whereby size is considered as a predictor for UIA rupture. Additionally, blood flow correlated negatively with elongation and shape index of UIA whereby a decrease in shape index is related to unstable (growing or ruptured) intracranial aneurysms (2).Our study shows an inverse correlation between WSSMAX and UIA size. More specifically, a negative correlation between WSSMAX and both area and volume of the UIA is found. A negative linear relation between WSSMAX and UIA size independent of location has been reported before (5) and therefore our findings support that low WSS may be associated with the process of aneurysm wall degeneration, which is in line with previous studies(6). vPI was not associated with any morphological outcome. A relation of pulsatility and rupture is seen in a retrospective review of ruptured aneurysms whereby pulsatility and non-sphericity where the only risk factors to consistently identify risk before and after aneurysms rupture for all aneurysms (7). Therefore, vPI is an important hemodynamic outcome parameter to consider for predicting the risk of rupture and seems independent of the other considered parameters in this work. Mean velocity and the flatness of the UIA are negatively correlated, while literature described an increase of flatness that showed statistically significant correlation with UIA growth (2). Lower intra-aneurysmal velocity result in higher vPI, which are both associated with unstable growing aneurysms. Therefore, blood flow seems to be an important parameter for risk evaluation of UIA.Conclusion
In conclusion, by combining the hemodynamic outcomes and morphological measurements and studying relationships between those, we obtained better insight in risk parameters of UIA development.Acknowledgements
We thank the study participants and MR technicians. We acknowledge the Amsterdam Medical Center for using the ‘PROspective Undersampling in multiple Dimensions’ (PROUD) software patch, which enables a pseudospiral ky/kz-plane acquisition scheme designed for incoherent undersampling with a variable sampling density. We acknowledge the support of the Netherlands CardioVascular Research Initiative: the Dutch Heart Foundation (CVON 2018-02 ANEURYSM@RISK).
References
1. Vlak MHM, Algra A, Brandenburg R, Rinkel GJE. Prevalence of unruptured intracranial aneurysms, with emphasis on sex, age, comorbidity, country, and time period: A systematic review and meta-analysis. Lancet Neurol. 2011;10:626–636 doi: 10.1016/S1474-4422(11)70109-0.
2. Timmins KM, Kuijf HJ, Vergouwen MDI, Ruigrok YM, Velthuis BK, van der Schaaf IC. Relationship between 3D Morphologic Change and 2D and 3D Growth of Unruptured Intracranial Aneurysms. Am. J. Neuroradiol. 2022;43:416–421 doi: 10.3174/ajnr.A7418.
3. Gottwald LM, Töger J, Markenroth Bloch K, et al. High spatiotemporal resolution 4D flow MRI of intracranial aneurysms at 7T in 10 minutes. Am. J. Neuroradiol. 2020;41:1201–1208 doi: 10.3174/AJNR.A6603.
4. van Ooij P, Potters WV, Guédon A, et al. Wall shear stress estimated with phase contrast MRI in an in vitro and in vivo intracranial aneurysm. J Magn Reson Imaging. 2013 Oct; 38:876-884 doi: 10.1002/jmri.24051.
5. Zhang M, Peng F, Li Y, He L, Liu A, Li R. Associations between morphology and hemodynamics of intracranial aneurysms based on 4D flow and black-blood magnetic resonance imaging. Quant. Imaging Med. Surg. 2021;11:597–607 doi: 10.21037/QIMS-20-440.
6. Kadasi LM, Dent WC, Malek AM. Colocalization of thin-walled dome regions with low hemodynamic wall shear stress in unruptured cerebral aneurysms: Clinical article. J. Neurosurg. 2013;119:172–179 doi: 10.3171/2013.2.JNS12968.
7. Chien A, Sayre J. Morphologic and hemodynamic risk factors in ruptured aneurysms imaged before and after rupture. Am. J. Neuroradiol. 2014;35:2130–2135 doi: 10.3174/ajnr.A4016.
Figures