2298
Construction of a contrast enhancement map of intracranial vessel wall MRI with 3D volume rendering1Bioengineering, University of Washington, Seattle, WA, United States, 2University of Washington, Seattle, WA, United States, 3University of North Carolina, Chapel Hill, NC, United States, 4University of Utah, Salt Lake City, UT, United States
Synopsis
Keywords: Vessel Wall, Atherosclerosis
Contrast enhancement (CE), by the administration of gadolinium, has been shown as an important intracranial vessel wall MRI biomarker. In this study we have developed a CE map with 3D volume rendering, extended from a previously developed intracranial atherosclerosis analysis pipeline MOCHA. 3D CE map can help clinicians easily identify plaque contrast enhancement. It demonstrates CE’s spatial location relative to the vessel and provides reliable quantification of its intensity. It is a promising tool for future longitudinal studies to focus on the association between 3D CE map features and disease development.Introduction
Intracranial atherosclerotic disease (ICAD) is a major cause of ischemic stroke worldwide especially in Asian, Black, and Hispanic populations, and the burden of ICAD is expected to grow with the aging of the population overall1. ICAD is also associated with an increased risk of stroke recurrence2. Intracranial vessel wall MRI (VWI) has been recommended over angiographic techniques in clinical practice to detect both stenotic and non-stenotic lesions and monitor disease progression3. Contrast enhancement (CE), by the administration of gadolinium (Gd), has been shown as an important VWI biomarker in identifying culprit symptomatic plaques and is associated with increased neovascularization and endothelial permeability4. Beyond the presence or absence of CE, measuring the degree and distribution of CE may demonstrate additional features in predicting plaque development, which requires an objective quantification and an intuitive visualization of CE, preferably in 3D. Sanchez et al., has demonstrated a pipeline of 3D CE map using orthogonally extended probes from vessel lumen to the arterial wall5. However, this method only depicted a thin surface of CE and cannot assess CE in the case of eccentric or complex plaque. In this study, we aimed to develop a 3D CE map based on volume rendering, extended from a previously demonstrated ICAD analysis workflow, MOCHA6.Methods
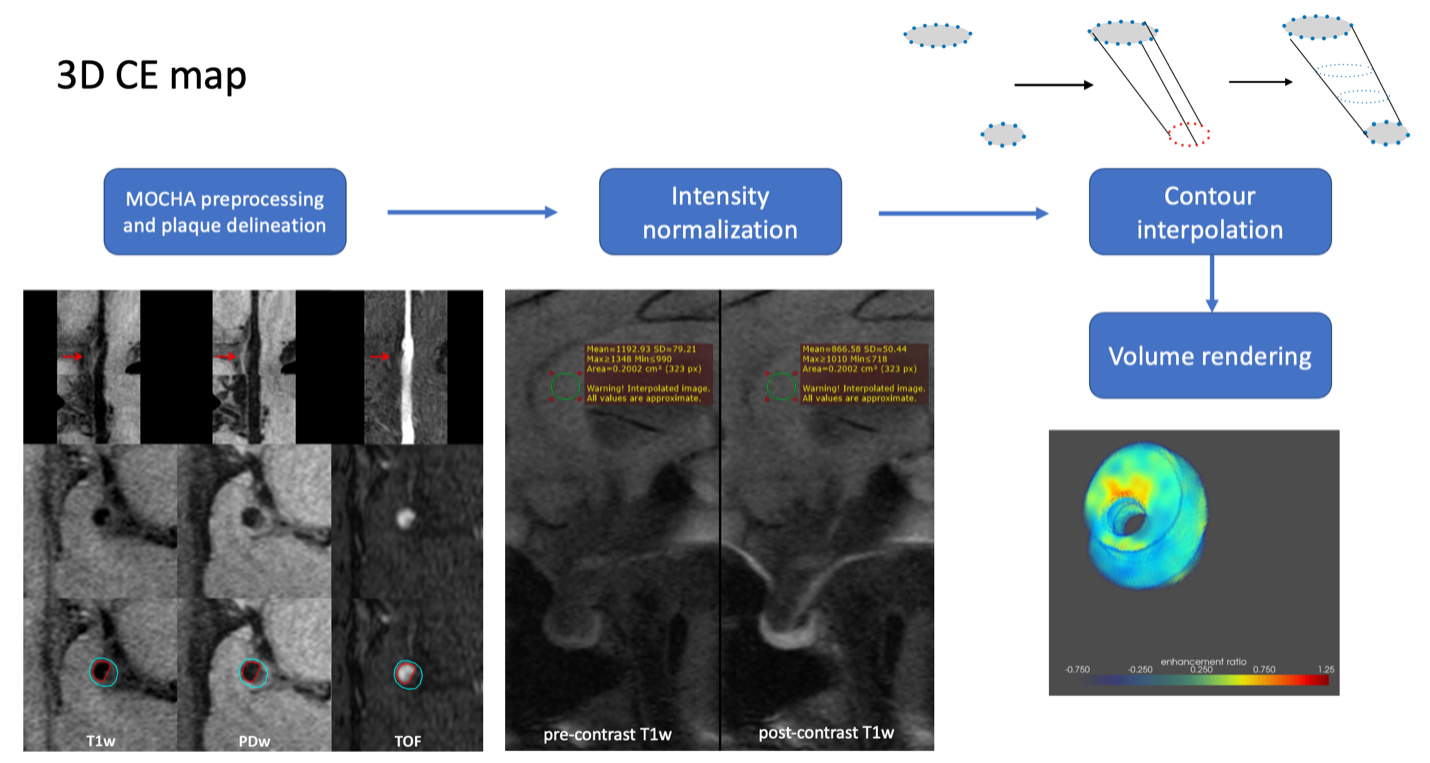
3D CE map includes the following components (Fig 1): MOCHA preprocessing, plaque delineation, intensity normalization, contour interpolation and volume rendering. Twenty-four subjects in the WALLI study (R01 NS092207) with known intracranial atherosclerosis underwent VWI at baseline and one-year follow-up. Images of the two time points were co-registered, and CE maps were constructed.MOCHA preprocessing and plaque delineation: Registered cross-sections of both pre- and post-contrast T1-VISTA images perpendicular to the vessel centerline were generated with MOCHA. Plaques from major intracranial segments were subsequently identified and delineated by expert reviewers.
Intensity normalization: The genu of the corpus callosum (CC), a brain region with uniform signal intensity which does not enhance after the injection of Gd, was used as an anatomical structure in normalizing signal intensities of the pre- and post-contrast images. It has been proved to yield reproducible calculation of enhancement ratio and to be comparable with non-normalized raw data7. The CE map in 2D cross sections was calculated as follows:
Enhancement ratio = (SIpost/SIpost_cc - SIpre/SIpre_cc)/(SIpre/SIpre_cc).
Contour interpolation: In order to render smooth surfaces between 2D cross-sectional CE maps, we further up-sample 10x and interpolated the images along the vessel direction. Lumen and arterial wall boundaries were interpolated by resampling and matching the corresponding contour control points.
Volume rendering: To maintain the information about the intensity and spatial location of the enhancement, especially the position relative to the vessel, we leveraged volume rendering to visualize the 3D CE map. Particularly, we carefully designed a transfer function that assigns larger opacities to the pixels that are more enhanced. Then, the visualization result of the 3D CE map along any direction was calculated by performing an integration (weighted by the opacity and color) along the corresponding light ray that passes through the map.
Results
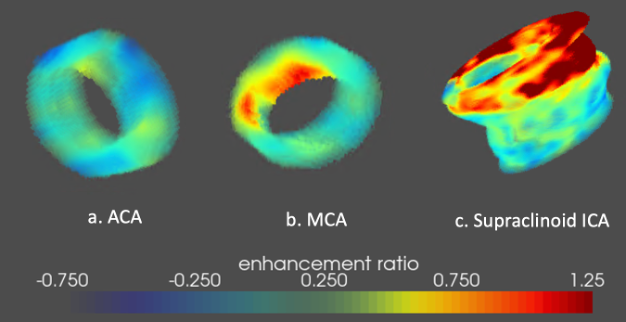
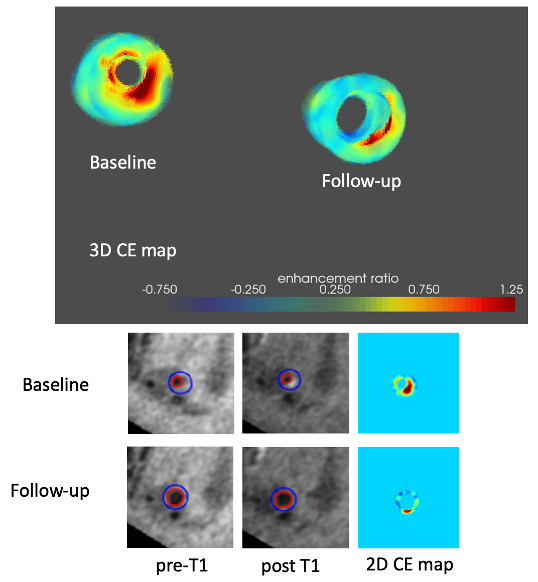
Among 24 subjects, expert reviewers identified 51 plaques in the supraclinoid ICA, MCA, ACA, PCA, BA and V4. Contrast enhancement ratio decreased from baseline, 0.67±0.46, to follow-up, 0.53±0.42 (p=0.11). Three example 3D CE maps (Fig 2) were displayed to demonstrate (a) a non-enhanced ACA plaque, (b) a lumen-side enhanced MCA plaque and (c) a supraclinoid ICA plaque with diffused enhancement at the distal end. Another example (Fig 3) aligned and compared 3D CE maps of both time points. We found that, although CE was strongly visible at baseline, it dissipated at follow-up accompanying the regression of plaque (the expansion of lumen and thinning of the arterial wall).Discussion
Intracranial atherosclerotic plaques, likely distributed in one or many major arterial branches, are dynamic lesions showing progression and regression, which may represent different risk profiles. However, few tools have been proposed which demonstrate the capability of reliably visualize and quantify both the changes of vessel wall morphology and CE in longitudinal studies. In this study, we extended our previous 2D CE map7 into a 3D version. Unlike previously proposed methods by Sanchez et al.5, our method utilized volume rendering so that the distribution of CE (focal, uniform, etc.) and its relative distribution in terms of the plaque (closer to the lumen or outer wall) can be easily identified. In Fig 3, we found that the focal CE (with its decrease) corresponded well with the quadrant where plaque experienced regression. Future longitudinal studies may focus on the association between such CE features and patterns of plaque development.Conclusion
In this study, we have developed a 3D CE map with volume rendering, extended from a previously developed ICAD analysis pipeline MOCHA. 3D CE map can help clinicians easily identify plaque contrast enhancement. It demonstrates CE’s spatial location relative to the vessel and provides reliable quantification of its intensity. 3D CE map may serve as a promising tool for characterizing ICAD and other vascular pathologies.Acknowledgements
No acknowledgement found.References
[1] Banerjee, Chirantan, and Marc I. Chimowitz. "Stroke caused by atherosclerosis of the major intracranial arteries." Circulation research 120.3 (2017): 502-513.
[2] Yaghi, Shadi, et al. "Imaging parameters and recurrent cerebrovascular events in patients with minor stroke or transient ischemic attack." JAMA neurology 73.5 (2016): 572-578.
[3] Sun, Jie, et al. "Characterization of non-stenotic plaques in intracranial arteries with multi-contrast, multi-planar vessel wall image analysis." Journal of Stroke and Cerebrovascular Diseases 31.10 (2022): 106719.
[4] Qiao, Ye, et al. "Intracranial plaque enhancement in patients with cerebrovascular events on high-spatial-resolution MR images." Radiology 271.2 (2014): 534.
[5] Sanchez, S., et al. "3D Enhancement Color Maps in the Characterization of Intracranial Atherosclerotic Plaques." American Journal of Neuroradiology 43.9 (2022): 1252-1258.
[6] Guo, Yin, et al. "Multi‐planar, multi‐contrast and multi‐time point analysis tool (MOCHA) for intracranial vessel wall characterization." Journal of Magnetic Resonance Imaging 56.3 (2022): 944-955.
[7] Guo, Yin, et al. "Semi-automatic normalization and segmentation of contrast enhancement in intracranial atherosclerotic vessel wall imaging." 34th Annual Conference of Society for Magnetic Resonance Angiograph, Los Angeles, CA, 2022
Figures