2290
Alterations of T1 and proton density values of deep brain nuclei based on synthetic MRI in Parkinson’s disease patients1The First Affiliated Hospital of Dalian Medical University, Dalian, China, 2Clinical&Technical Support, Philips Healthcare, Beijing, China
Synopsis
Keywords: Parkinson's Disease, Parkinson's Disease
The objective of this study was to explore whether the alterations of T1 and proton density values could reflect the occurrence of Parkinson's disease (PD) and contribute to the prevention and diagnosis of PD. The T1 values of the left caudate nucleus (CN) and the proton density values of all nuclei were significantly reduced in the PD group compared with the control group. The T1 values of the left globus pallidus (GP) and right thalamus (THU) in the PD group were significantly reduced compared with those of the contralateral side.Introduction
Synthetic magnetic resonance imaging using multi-dynamic multi-echo sequences and quantitative maps of multiple sequences (proton density, T1, R2*) can be obtained by one scan, and different weighted images can be synthesized [1]. The T1 and proton density images of MRI mainly show structural changes (mainly gray matter), which reflect the physical properties of the tissue and are the basis for quantitative analysis [2]. However, the specific clinical uses are still the challenges for radiologists. Parkinson' s disease (PD) is considered to be the second most common neurodegenerative diseases in developed countries. In this study, we aimed to quantify the T1 and proton density values of various deep gray nuclei in patients with PD and healthy controls (HC) by using T1 maps and proton density maps to analyze whether the alterations of T1 and proton density values can reflect the occurrence of PD and to explore whether it is helpful to the prevention and diagnosis of PD.Materials and Methods
Twenty-one PD patients and 20 volunteers as the control group were prospectively collected. MRI examinations were performed with GE signa HDXT 3.0T MRI scanner, with STAGE scans of brain MRI. T1 maps and proton density maps were obtained after post-processing. The nuclei included in this study were caudate nucleus (CN), putamen (PUT), globus pallidus (GP), thalamus (THU), red nucleus (RN), black nucleus (SN) and dentate nucleus (DN). The regions of interest (ROIs) representing these structures were manually tracked on T1 maps and proton density maps by two researchers using SPIN (Signal Processing in NMR, SpinTech, Inc., Bingham Farms, MI, United States). Three levels were measured continuously in the same part, and the mean value was calculated. The T1 and proton density values of all nuclei of the same patient were measured by two researchers for consistency test (ICC>0.95). All the datas were analyzed by SPSS20.0 software, and the normal distribution was tested in each group. Those in accordance with normal distribution were expressed as means ± standard deviation, and those did not accord with normal distribution were expressed by median (upper and lower quartiles). Independent sample t-test or Mann-Whitney U test (not in accordance with normal distribution) were used to compare the mean value of T1 and proton density between PD and control group in both hemispheres, and the differences between the left and right were tested by paired sample t-test. A P-value <0.05 was considered statistically significant.Results
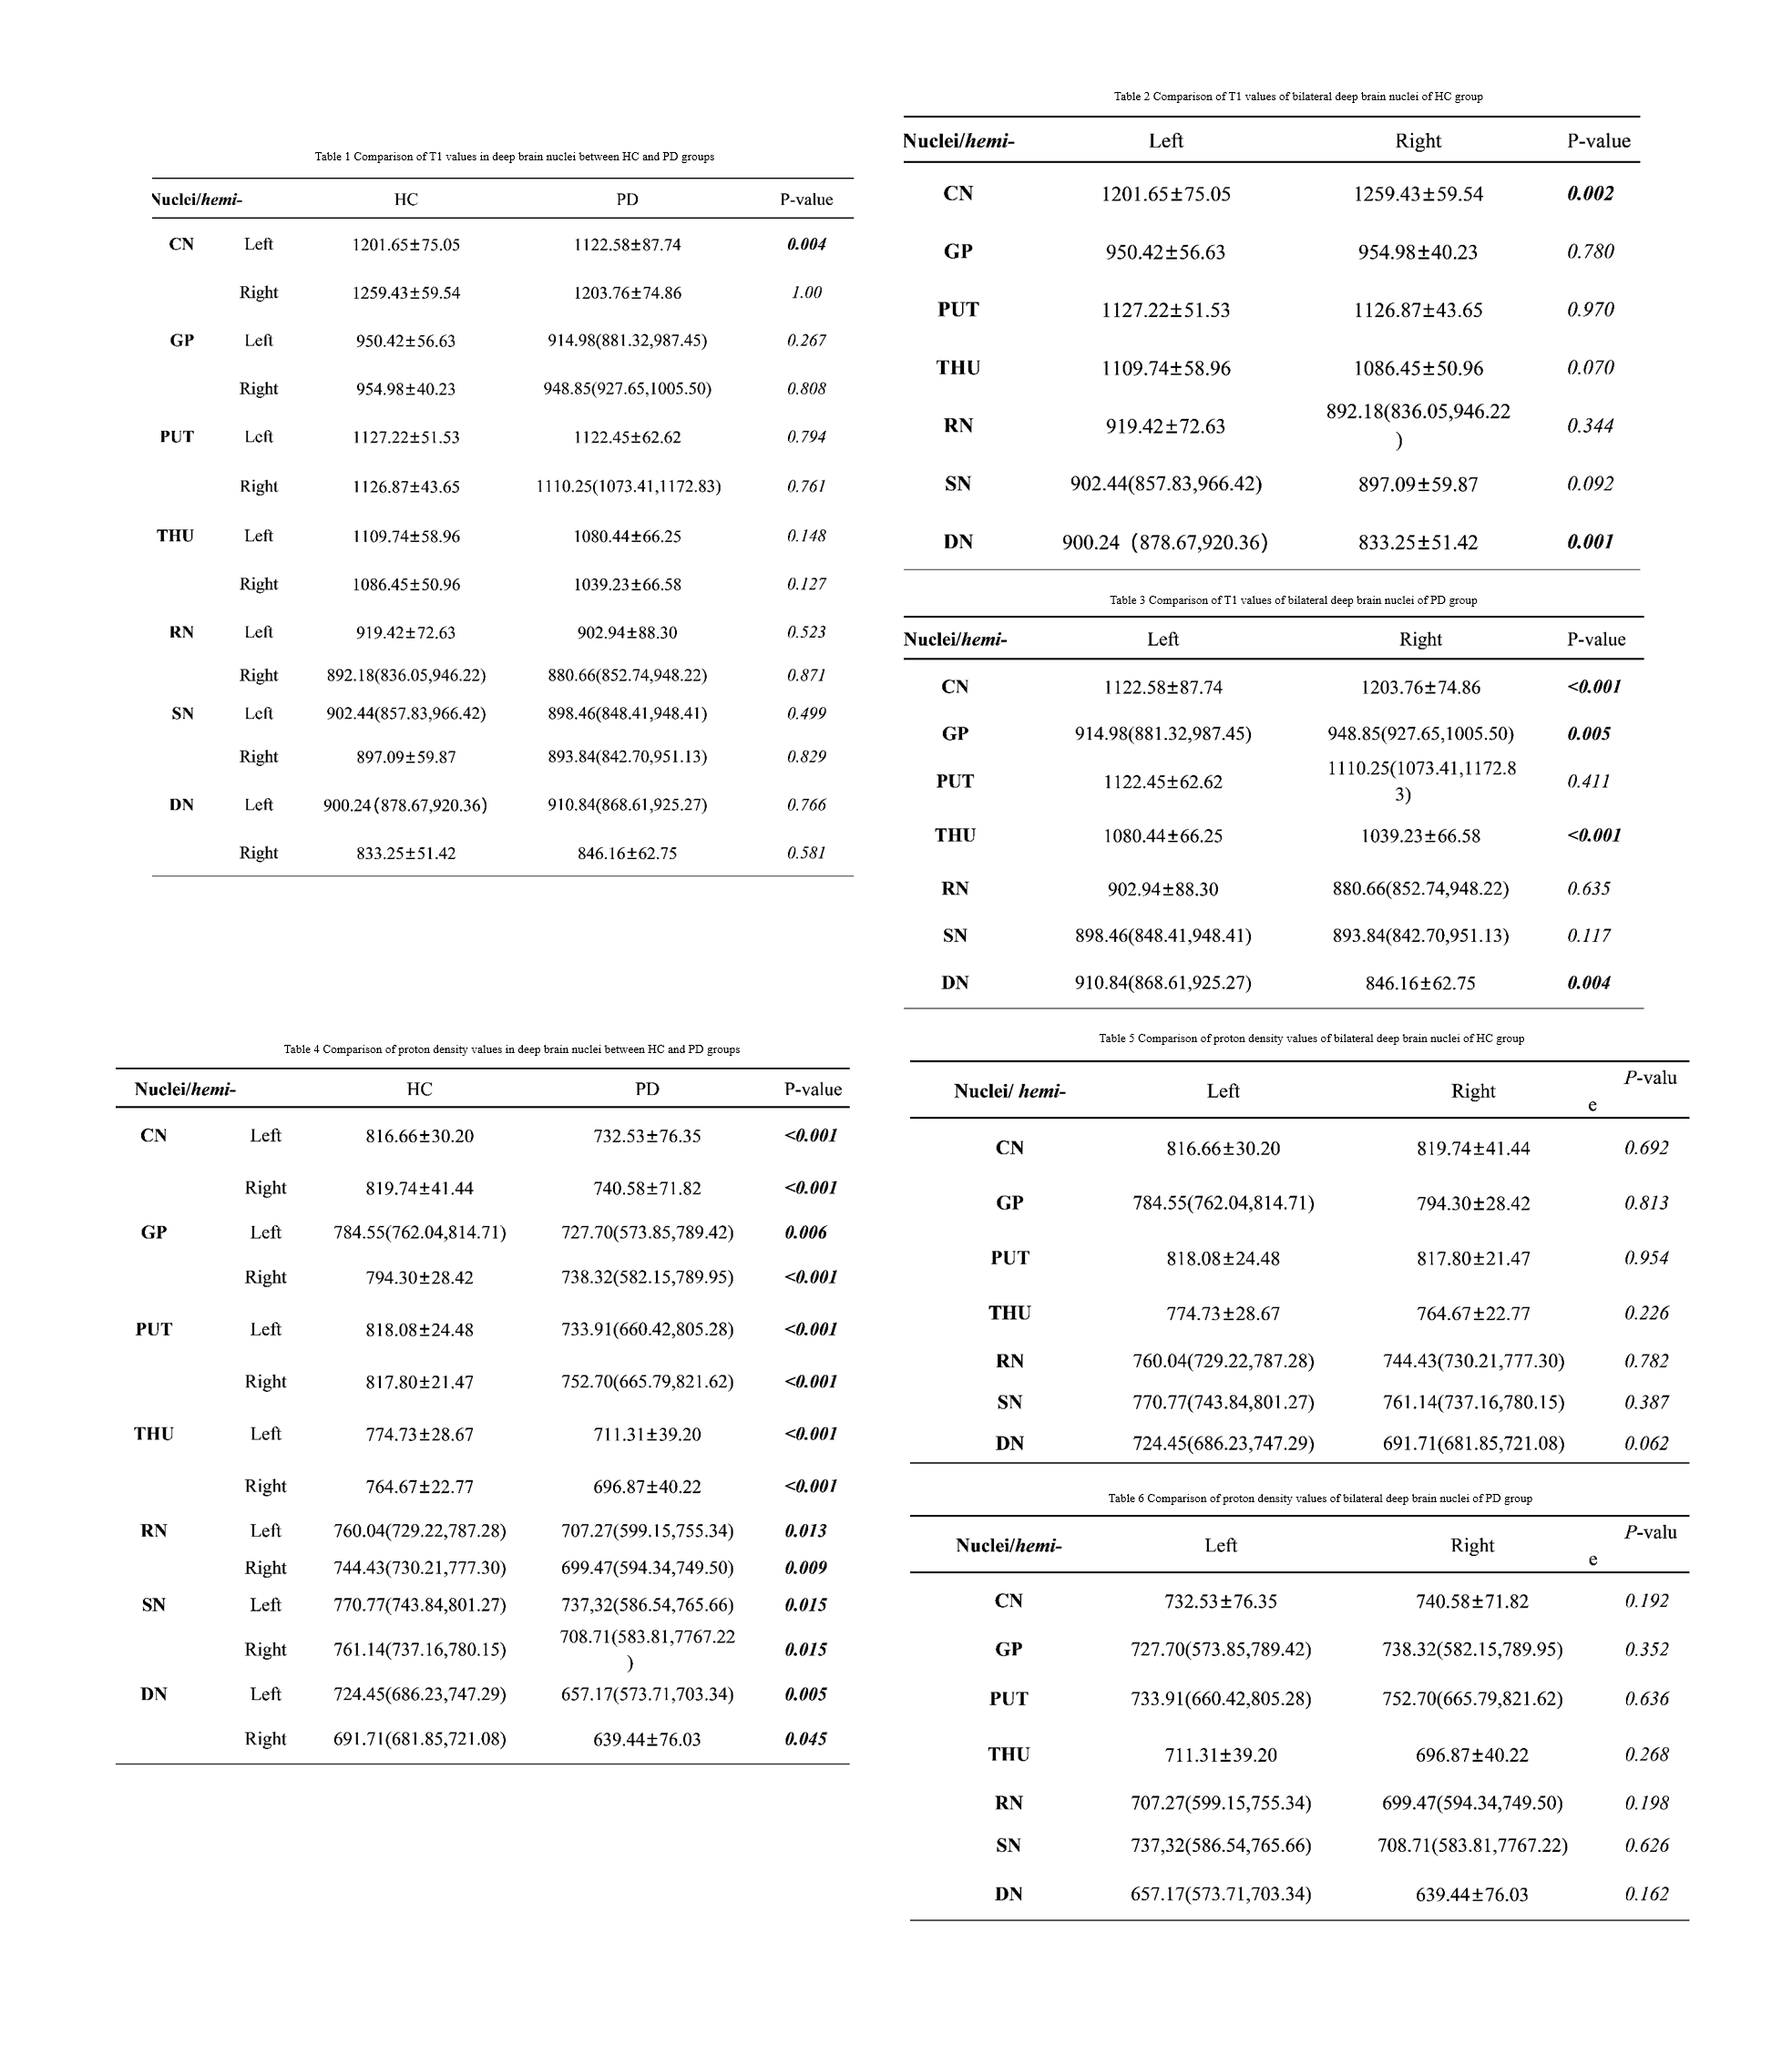
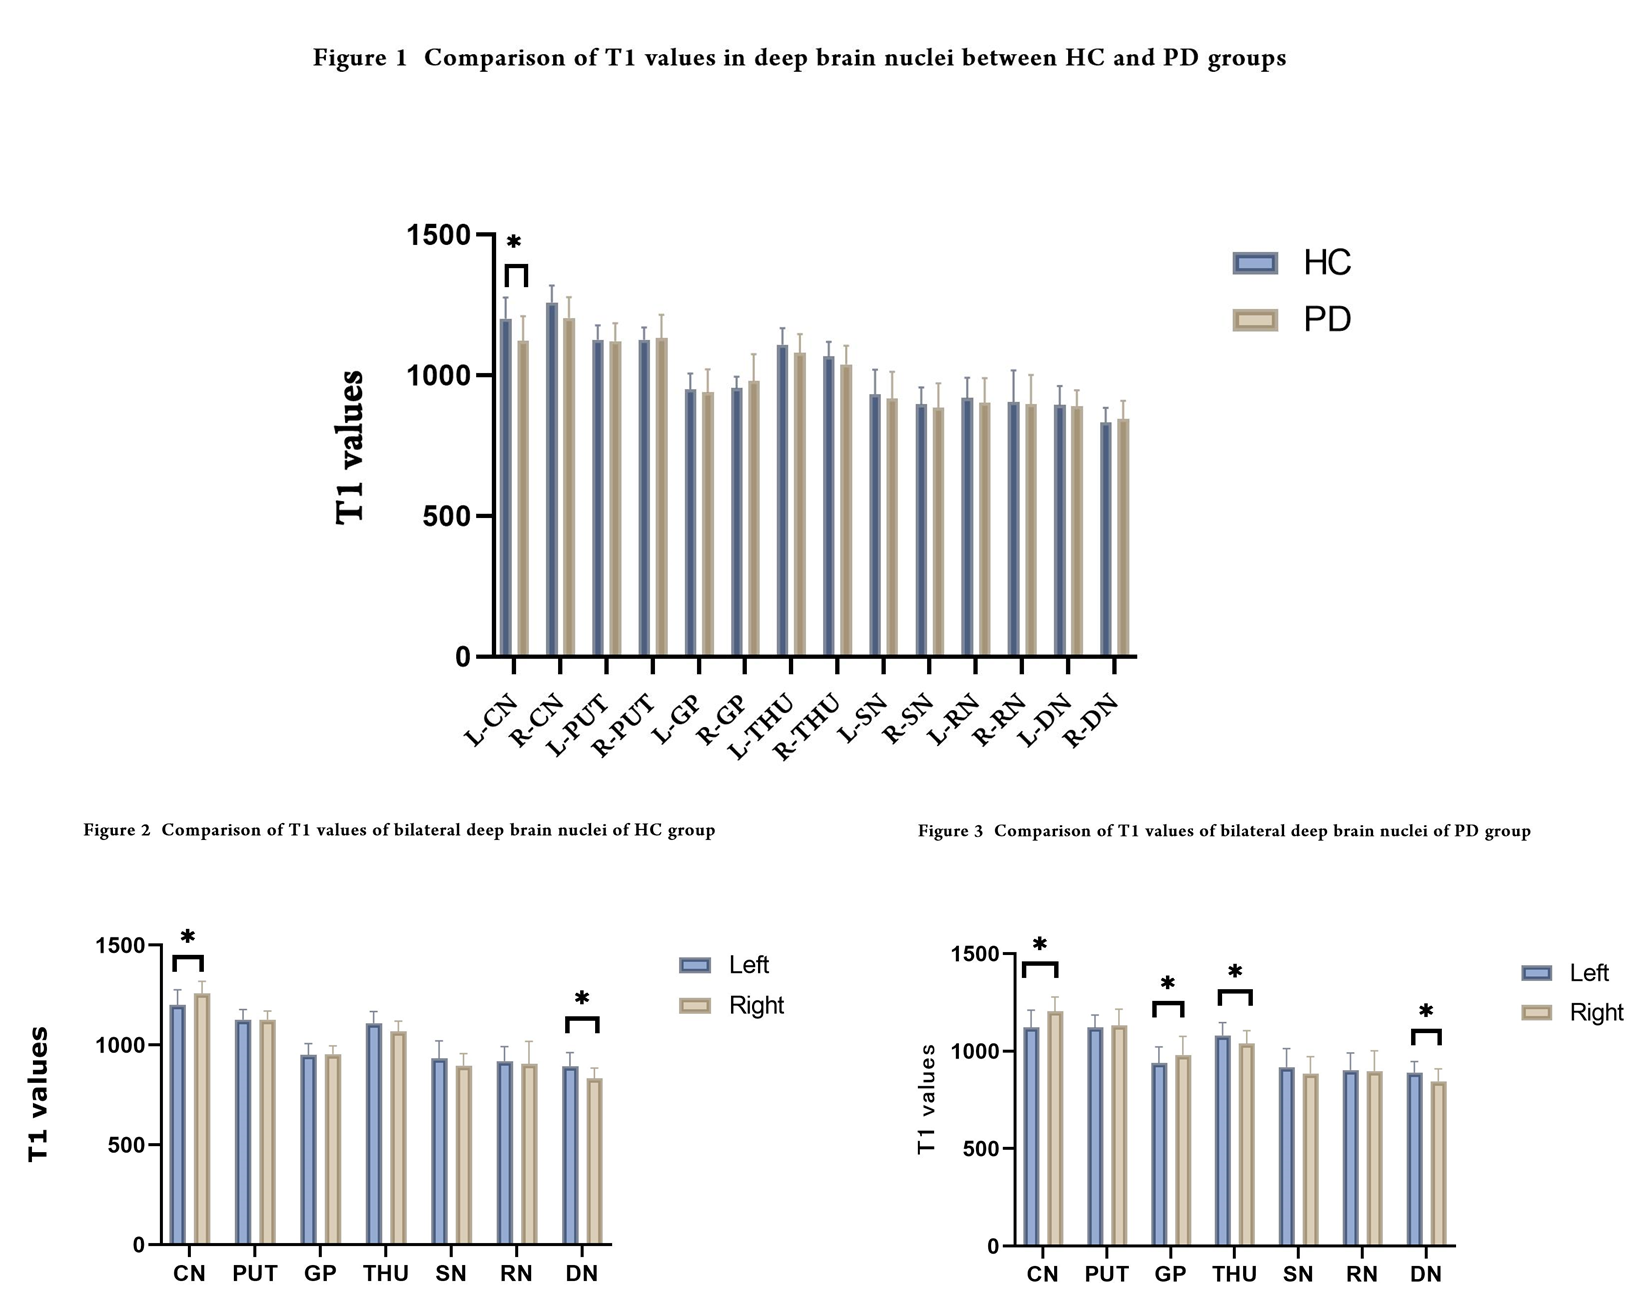
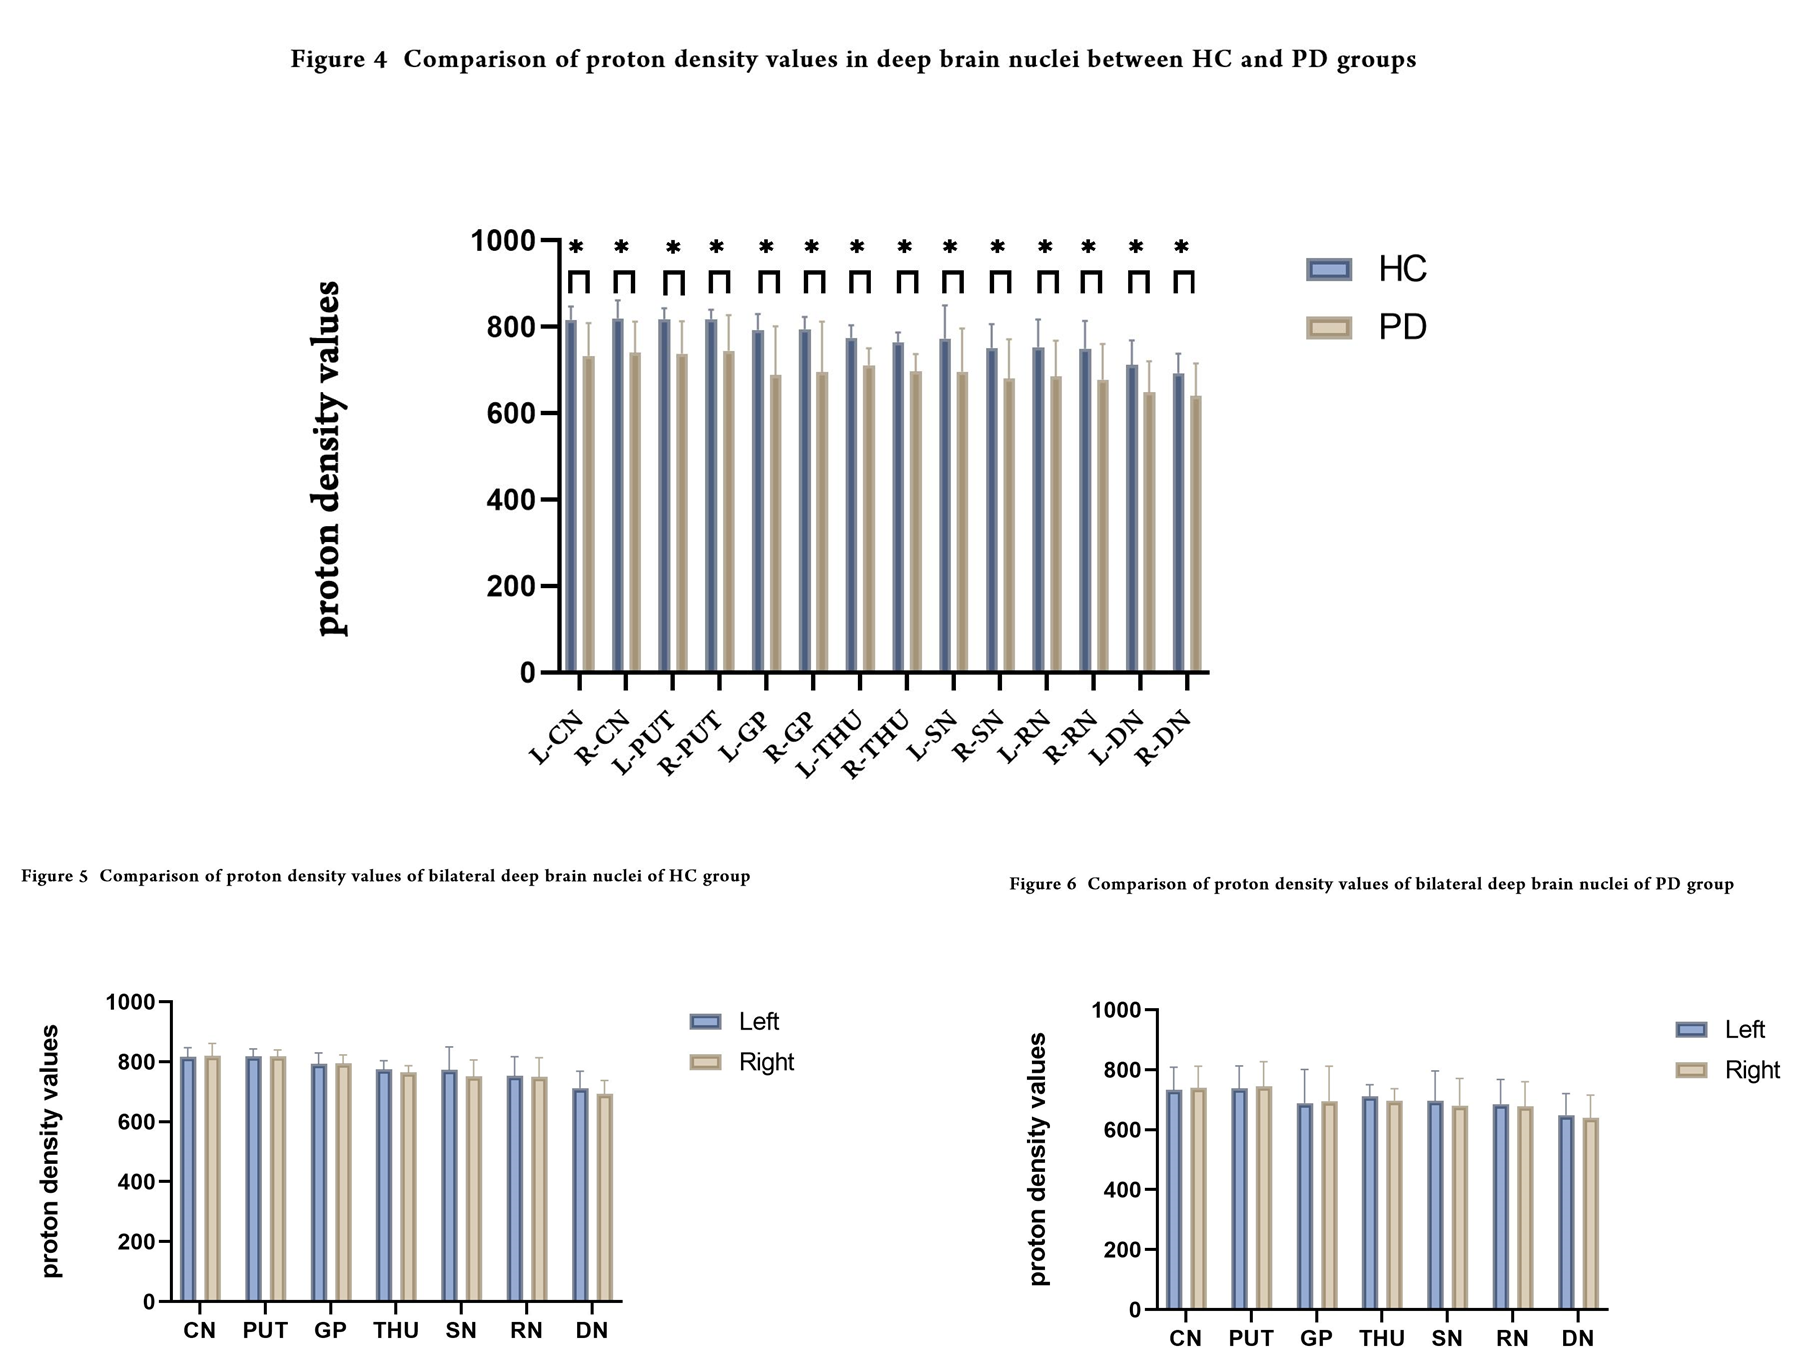
Compared to the control group, the T1 values of the left CN and the proton density values of all nuclei were significantly reduced in the PD group(P<0.05)(Table 1,4, Figure 1,4). The T1 values of the left CN and DN were significantly reduced both in the PD group and the HC group compared with those of the right side. The T1 values of the left GP and right THU in the PD group were significantly reduced compared with those of the contralateral side(P<0.05)(Table 2-3, Figure 2-3).Discussion
Basal ganglia atrophy is one of the main pathological changes of PD. The CN is the main component of the basal ganglia and an important gray matter nucleus in the deep part of the brain, which participates in functions such as planning, execution and control of movements [3]. In this study, the T1 values of the left CN were significantly reduced in the PD group, suggesting structural changes happened in the left CN in PD patients. However, the T1 values of the left CN were significantly reduced both in the PD group and the HC group compared with those of the contralateral side, indicating that whether the left CN is more prone to have structural changes than the right side in PD patients remains unclear. The T1 values of the left GP and the right THU were significantly reduced compared with those of the contralateral side in the PD group rather than the HC group, suggesting that the left GP and right THU of PD patients may have microstructural changes, which is consistent with the results of Breen et al [4]. However, the studies of Crutcher et al [5] showed that there was no significant difference between the volume of the CN, GP, PUT, and dorsal thalamus in the PD group and the HC group. This may be related to the technical level of the examiners, the equipment used, and the selection of sequence parameters. The use of multi-dynamic multi-echo (MDME) sequences to quickly scan parameters can also affect the quantitative measurement of brain tissues [5]. In addition, the PD values of all nuclei were significantly reduced in the PD group compared with the control group, suggesting that the nuclei of PD patients may have undergone microstructural changes. However, the cause of this result still needs to be further studied.Conclusion
In summary, we found T1 and proton density maps are potentially promising and valuable methods in detection of structural changes in deep brain nuclei.Acknowledgements
No acknowledgement found.References
1.Warntjes JB, Leinhard OD, West J, et al. Rapid magnetic resonance quantification on the brain: optimization for clinical usage[J]. Magn Reson Med, 2008, 60(2): 320-329. DOI:10.1002/mrm.21635.
2. Zheng ZF, Wang ZC, Yang JF, et al. The effect of fast scan parameters on evaluation of T1, T2 relaxation times and proton density of normal brain using synthetic MRI[J]. Chin J Magn Reson Imaging, 2021, 12(12): 62-66.
3. Yelink J. Functional anatomy of the basalganglia[J]. Mov Disord, 2002, 17(3):515-521.
4. Breen DP, Nombela C, Vuono R, et al. Hypothalamic volume loss is associated with reduced melatonin output in Parkinson's disease[J]. Mov Disord, 2016, 31(7): 1062-1066. DOI:10.1002/mds.26592.
5. Crutcher MD, DeLong MR. Single cell studies of the primate putamen[J]. Exp Brain Res, 1984, 53(2): 233-243. DOI:10.1007/bf00238153.
Figures