2286
Quantitative Susceptibility Mapping in Distinguishing Between Patients with Mild and Moderate Parkinson’s Disease1China-Japan Union Hospital of Jilin University, Jilin, China, 2MR Collaboration, Central Research Institute, United Imaging Healthcare, Shanghai, China
Synopsis
Keywords: Parkinson's Disease, Quantitative Susceptibility mapping
Iron concentrations were associated with many significant pathological processes in the brain. The advent of Quantitative Susceptibility Mapping (QSM) enabled the assessment of magnetic susceptibility in Parkinson’s Disease (PD) brains. Our study revealed that magnetic susceptibilities of regional brain structures varied in mild and moderate PD and we investigated the possibility of early detection of PD using QSM.Introduction
Increased brain iron deposits in the substantia nigra have been reported paralleled with the occurrence of Parkinson’s Disease (PD)1. Although previously the measurement of brain iron concentrations was restricted to histopathology, Quantitative Susceptibility Mapping (QSM) is an MRI technique that captures magnetic susceptibility variations in the tissue and reflects the iron diposition2. This study aims to evaluate magnetic susceptibility changes in deep gray matter sub-regions of mild and moderate PD brains through QSM images.Methods
A total of 33 patients with PD (22 female, age 61.4±10.4 years) were enrolled and underwent multi-echoes GRE-based QSM scanning on a 3.0 T scanner (uMR 780, United Imaging Healthcare, Shanghai, China). All MR images were acquired through the following protocol: TR 35.5 ms, slice selection 2 mm, slice spacing 2 mm, FOV 190×224 mm2, matrix size 435×512. QSM was then reconstructed automatically using magnitude and phase images.To measure the severity of PD, the Unified Parkinson’s Disease Rating Scale (UPDRS) testing was adapted. Patients with a total score of 1 in the testing were considered in the mild stage of PD and patients scored 2 were considered having moderate disease. Then two sub-groups were determined: patients presenting mild PD and moderate PD. ROIs of inferior parietal lobule, calcarine sulcus, temporal lobe and cerebellum were drawn on QSM by an experienced neural radiologist, and mean susceptibilities in these structures were measured as well.
We performed all statistical analyses on the commercial software (IBM SSPS Statistics, version 26.0). To compare regional susceptibilities of the brain in groups with mild and moderate PD, the Student’s t test was applied in each of the brain sub-region. Receiver operating characteristic (ROC) curve were plotted and the area under the curve (AUC) was calculated to assess the performance of quantitative metric in differentiating PD of mild and moderate degrees. A significance threshold was set to p<0.05.
Results
Susceptibility values of the left inferior parietal lobule, the left calcarine sulcus, the left middle temporal gyrus, and the right superior temporal gyrus were found significantly lower in the mild group than that in the moderate group (Table 1). While for the left cerebellar cortex, the mean susceptibility was significantly higher in the mild PD brains than that in moderate PD brains (Table 1). For the right inferior parietal lobule, the right calcarine sulcus, the right middle temporal gyrus, the left superior temporal gyrus, and the right cerebellar cortex, no significant difference was revealed between two sub-groups.AUC values were 0.765, 0.815, 0.787, 0.796, and 0.759 for the left inferior parietal lobule, the left calcarine sulcus, the left middle temporal gyrus, the right superior temporal gyrus, and the left cerebellar cortex, respectively. The best AUC was found for the left calcarine sulcus.
Discussion
Regional iron level changes in neurodegenerative brain disorders have been reported in several studies3-5, and QSM has been presented as a valuable imaging tool to detect iron distributions6. Our study showed that QSM was sensitive to capture stage-related variations of the susceptibility in inferior parietal lobule, calcarine sulcus, temporal lobe and cerebellum, in which the mean susceptibility of the left calcarine showed the best performance in differentiating mild PD from moderate PD in the ROC analysis. Therefore, quantifications of regional susceptibilities in the brain may be potentially applied to characterize PD brains.Conclusion
In summary, QSM revealed that susceptibility in certain brain sub-regions differed in mild and moderate PD brains, and may facilitate the detection of PD in the early stage.Acknowledgements
No acknowledgements
References
1. GÖTZ, M.E., DOUBLE, K., GERLACH, M., YOUDIM, M.B.H. and RIEDERERE, P. (2004), The Relevance of Iron in the Pathogenesis of Parkinson's Disease. Annals of the New York Academy of Sciences, 1012: 193-208.
2. Christian Langkammer, Ferdinand Schweser, Nikolaus Krebs, Andreas Deistung, Walter Goessler, Eva Scheurer, Karsten Sommer, Gernot Reishofer, Kathrin Yen, Franz Fazekas, Stefan Ropele, Jürgen R. Reichenbach, Quantitative susceptibility mapping (QSM) as a means to measure brain iron? A post mortem validation study, NeuroImage, Volume 62, Issue 3, 2012, Pages 1593-1599.
3. S.M. Hossein Sadrzadeh, PhD, Yasi Saffari, MD, Iron and Brain Disorders, Pathology Patterns Reviews, Volume 121, Issue suppl_1, 1 May 2004, Pages S64–S70.
4. GÖTZ, M.E., DOUBLE, K., GERLACH, M., YOUDIM, M.B.H. and RIEDERERE, P. (2004), The Relevance of Iron in the Pathogenesis of Parkinson's Disease. Annals of the New York Academy of Sciences, 1012: 193-208.
5. Berg D, Becker G, Riederer P, Riess O. Iron in neurodegenerative disorders. Neurotox Res. 2002 Nov-Dec;4(7-8):637-653.
6. Liu C, Wei H, Gong NJ, Cronin M, Dibb R, Decker K. Quantitative Susceptibility Mapping: Contrast Mechanisms and Clinical Applications. Tomography. 2015 Sep;1(1):3-17.
Figures
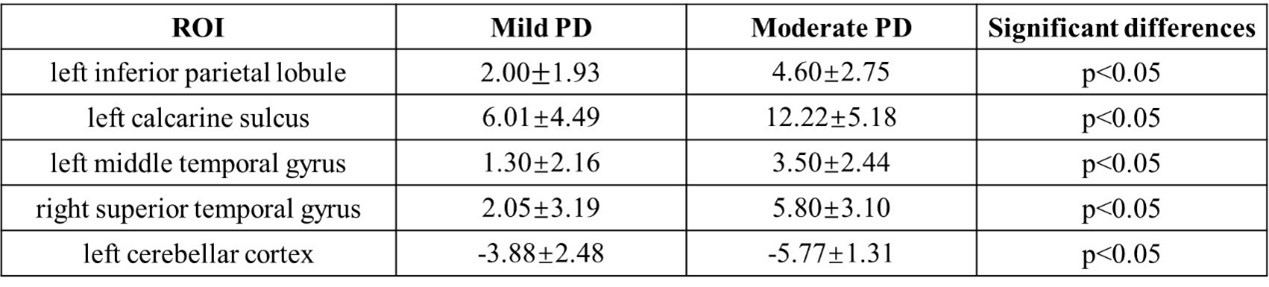
Table 1 Summary of group differences in magnetic susceptibilities between mild and moderate PD brains. All the data was display by mean![]() standard deviation (units: parts per billion).
standard deviation (units: parts per billion).
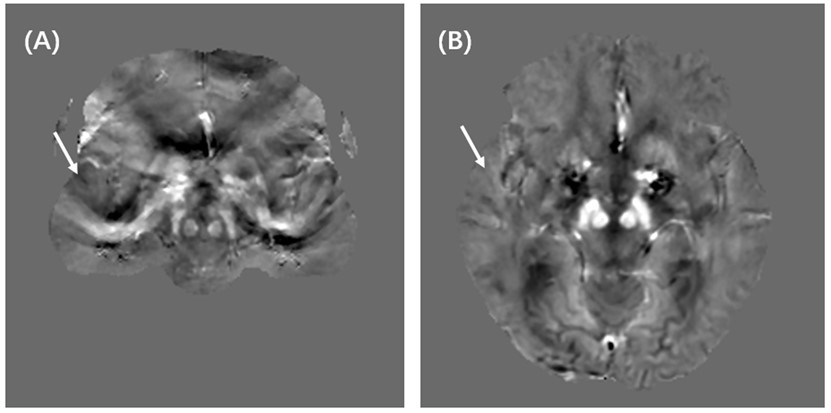
Figure 1 Quantitative susceptibility mappings from two patients in mild (A) and moderate (B) stage of PD. The white arrow shows the right superior temporal gyrus where susceptibilities were higher in the moderate PD brain.
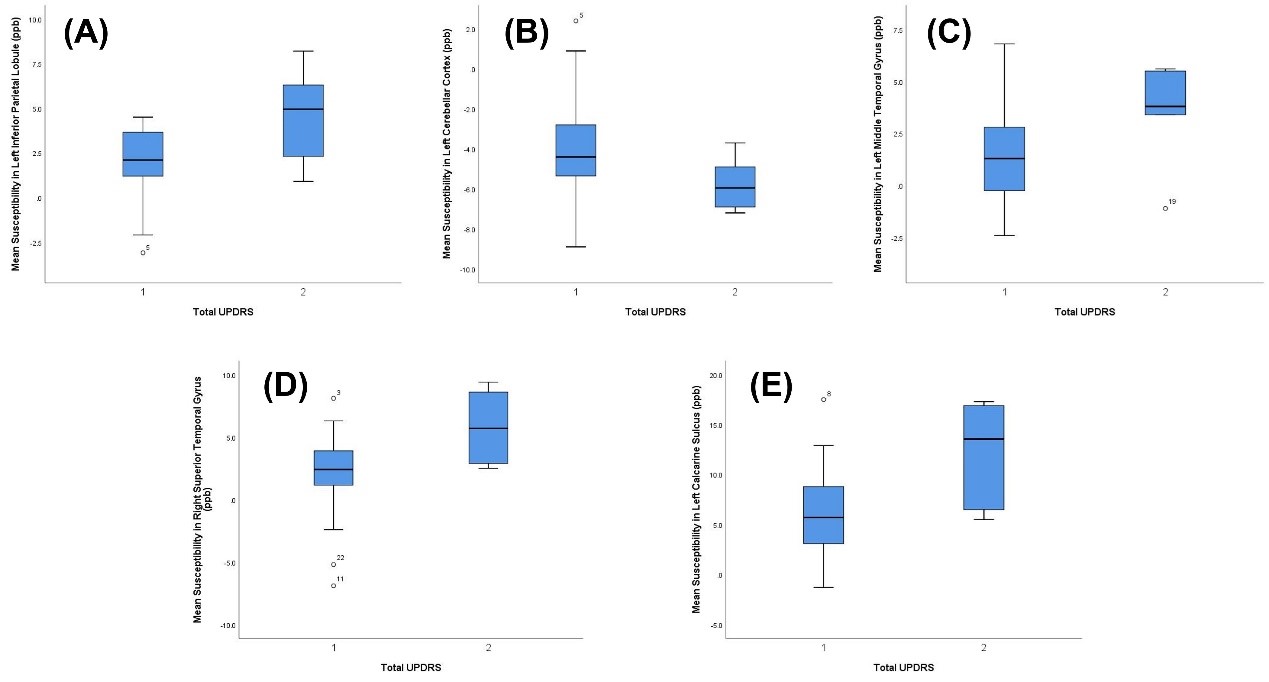
Figure 2 Boxplots show the mean susceptibilities within the left inferior parietal lobule (A), the left cerebellar cortex (B), the left middle temporal gyrus (C), the right superior temporal gyrus (D), and the left calcarine sulcus (E) between mild and moderate PD sub-groups. Boxes were drawn from the first quartile to the third quartile. The line goes through the box represents the median. The upper and lower whiskers represent the minimum and the maximum of the data and the outliers were represented by dots.
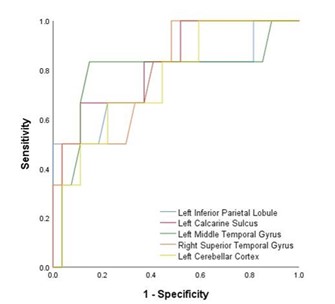
Figure 3 ROC analysis of mean susceptibilities in the left inferior parietal lobule, the left calcarine sulcus, the left middle temporal gyrus, the right superior temporal gyrus, and the left cerebellar cortex for differentiating mild PD from moderate PD.