2285
Estimation of 11C-PE2I PET based cerebral perfusion in Parkinson’s disease patients using quantitative transport mapping network (QTMnet)1Cornell University, New York, NY, United States, 2Weill Cornell Medicine, New York, NY, United States, 3Hospital for Special Surgery, New York, NY, United States
Synopsis
Keywords: Parkinson's Disease, PET/MR
111Symposis
We propose to estimate 11C-PE2I PET based cerebral perfusionpermeability and vascular and extravascular extracellular space volume using deep learning (quantitative transport and mapping network, QTMnet). The neural network was trained on synthetic data by solving the transport equation in simulated vasculature obtained using constrained constructive optimization (CCO. Parameters obtained using this method were compared between Parkinson disease patients and healthy volunteers in 116 brain regions. Furthermore, perfusion parameters were correlated with cognitive assessment scores.Introduction
Quantitative transport mapping (QTM) method was proposed recently to overcome the dependence of kinetic modeling method on arterial input function (AIF) and has been used to solve multi-compartment kinetic modeling problem by applying a deep neural network (quantitative transport mapping network, QTMnet)1,2,3,4. Parkinson’s disease (PD) is a slowly progressive neurodegenerative disease characterized by the loss of dopaminergic neurons and terminals in the nigrostriatal system5. Dopamine transporter (DAT) imaging is a widely used technique for PD diagnosis and is usually performed with positron emission tomography (PET) with radioactive tracers such as carbon-11 labelled cocaine analog N-(3-iodoprop-2E-enyl)-2β-carbomethoxy-3β-(4-methyl-phenyl)-nortropane (11C-PE2I )6. In this study, we propose to analyze 11C-PE2I PET using QTMnet, which may reveal flow and exchange of dopamine transporter in vascular and extravascular space, and to correlate that with PD progression by testing the difference of perfusion parameters between PD patients and healthy volunteers. We furthermore tested the correlation between perfusion parameters and cognitive assessment scores.Methods
34 subjects were enrolled in this study, including 25 PD patients and 9 healthy controls (HC) with age varying from 47 yrs. to 81 yrs. All the subjects underwent a T1-weighted MR scan (in plane resolution 1mm, slice thickness 1mm, repetition time 2.3s, echo time 2.2ms) and a 60 min 11C-PE2I PET scan (in plane resolution 1mm, slice thickness 2mm, temporal resolution 3min, matrix size 400*400*109). PET images were firstly co-registered to T1 and then into AAL atlas using FSL (Analysis Group, FMRIB, Oxford, UK). Cognitive assessment score was acquired for all subjects using the Montreal Cognitive Assessment (MoCA)7.Four perfusion parameters (perfusion F, permeability Ktrans, vascular space volume Vp and extravascular extracellular space volume Ve) were calculated from PET using QTMnet, a perfusion method validated on numerical perfusion phantoms based on artificial and tumor vasculature4. A 28-layer 32*32*32 3D U-net with tracer concentration data as input was trained on 4000 simulated tracer concentration data (figure 1). The loss function was set as L1 norm of network output and ground truth of the parameters. The network weights were optimized using Adam method with epoch=40, batch number=1, learning rate=0.001.
Reconstructed perfusion parameters were averaged in 116 AAL atlas brain regions8. An unpaired t-test was performed to test the difference of perfusion values between PD patients and healthy volunteers in each brain region, and Spearman’s correlation test was performed to test the correlation between perfusion values and MoCA score.
Results
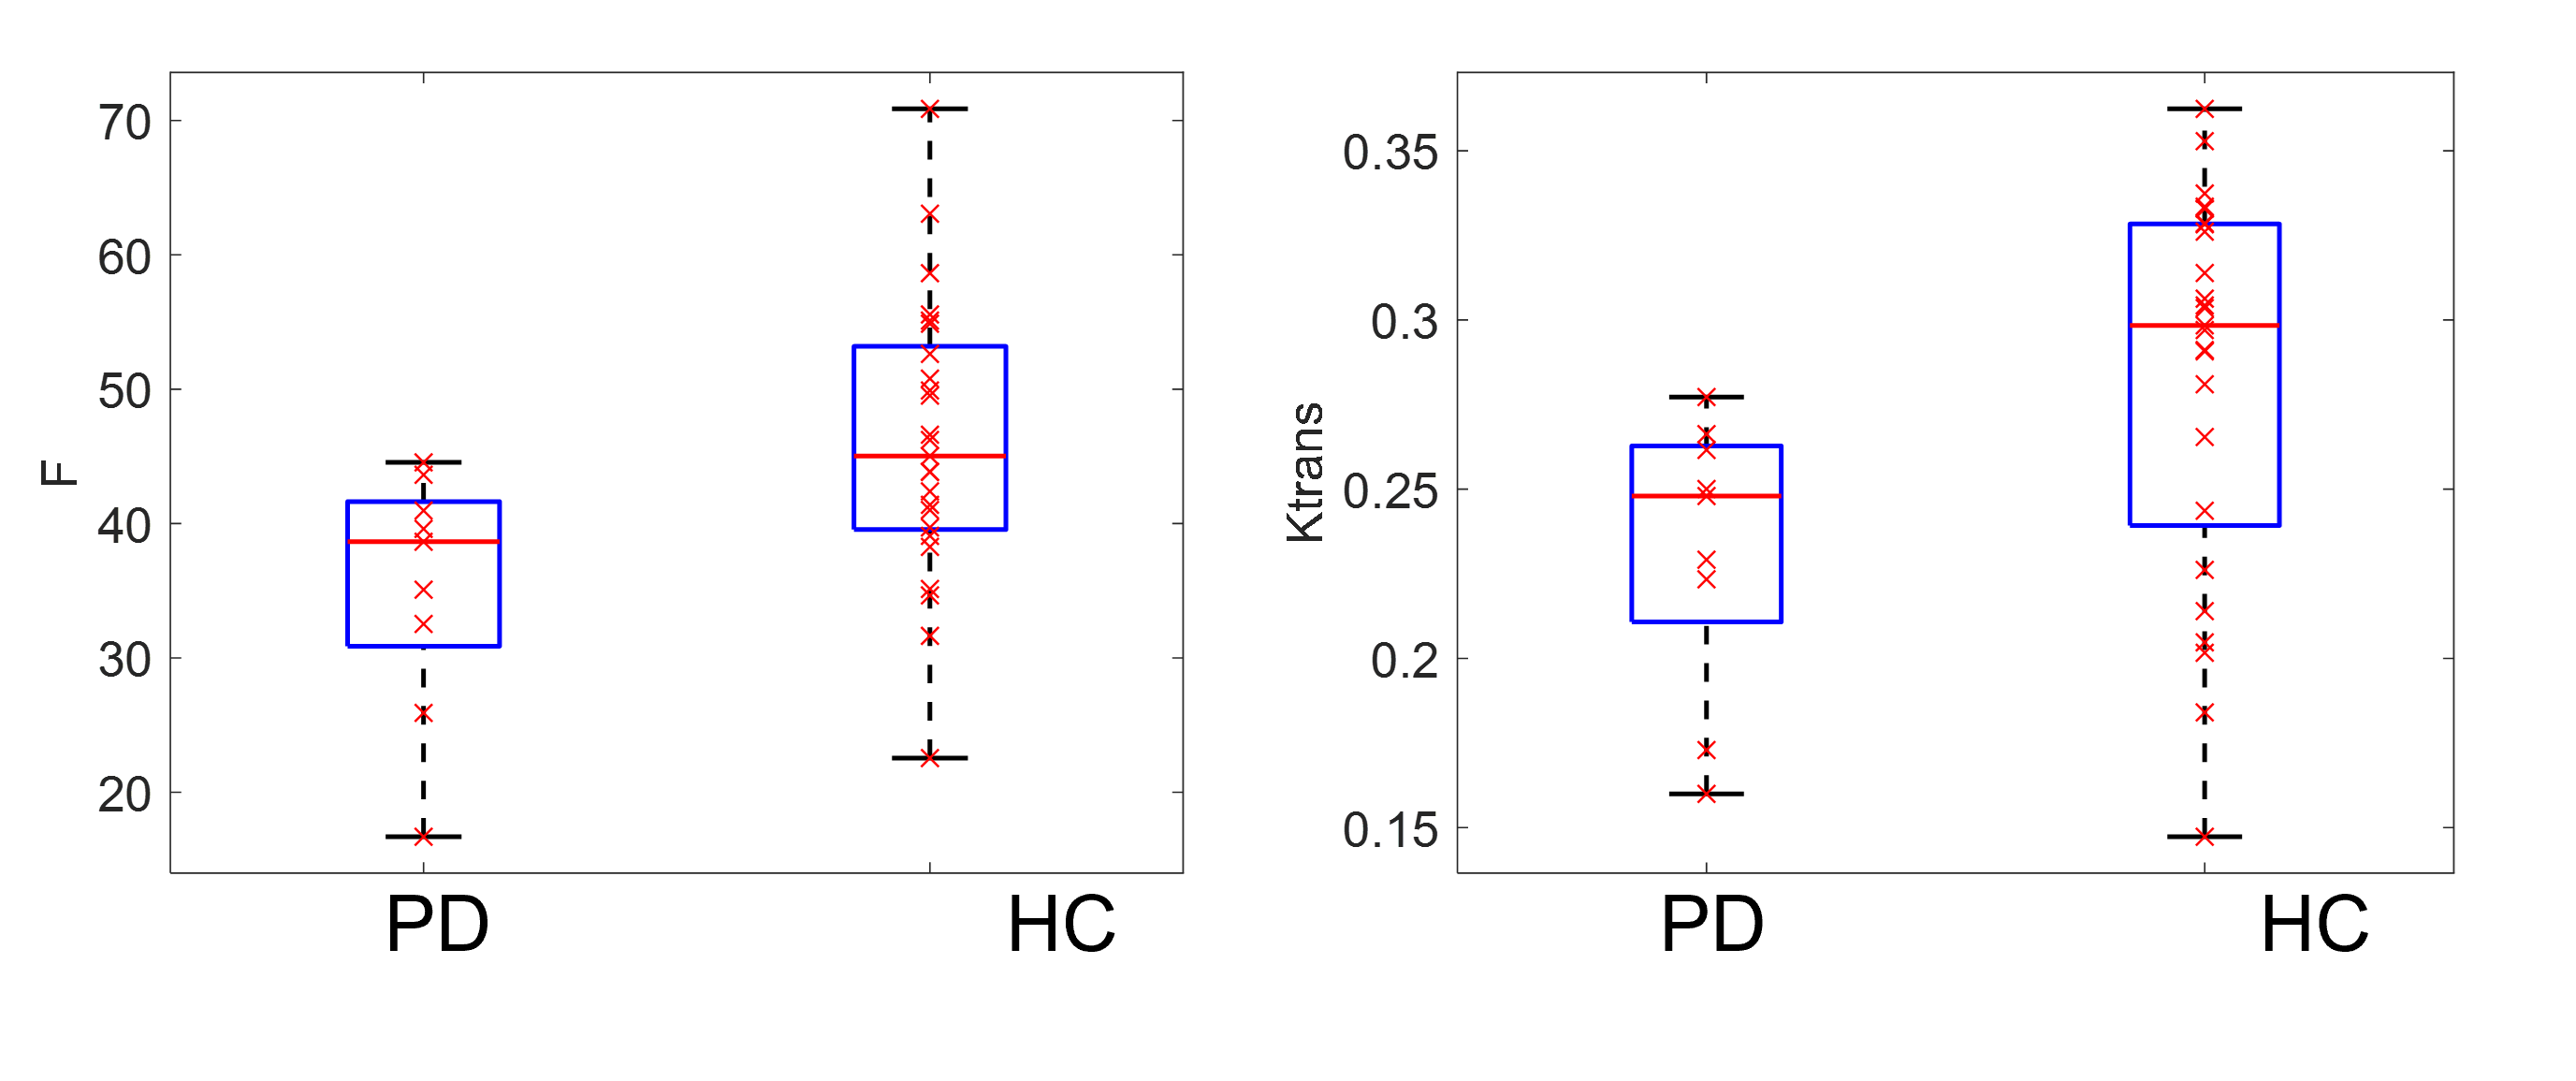
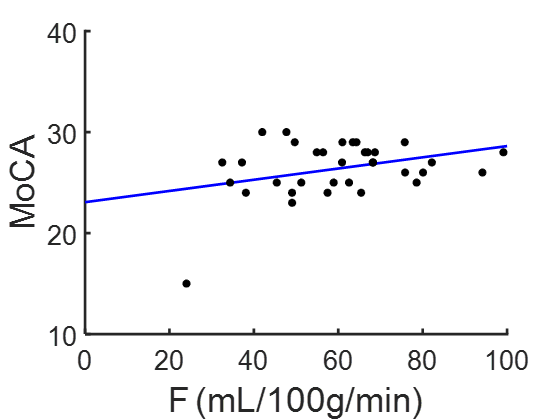
F, Ktrans, Vp and Ve maps of a 72 yrs. PD patient and a 65 yrs. healthy volunteer are shown in figure 2. Statistically, a significantly lower F and Ktrans of PD patients comparing with healthy volunteers is observed in Superior frontal gyrus (figure 3): perfusion F in caudate is 35±9 mL/100g/min for PD patient and 46±10 mL/100g/min for healthy volunteer (p=0.01). Ktrans in caudate is 0.23±0.04/min for PD patient and 0.28±0.05/min for healthy volunteer (p=0.03). Correlation test showed a positive correlation between MoCA score and F in middle frontal gyrus (F=4.25, p=0.04, R2=0.12), which is shown in figure 4.Discussion
We present here a perfusion analysis pipeline of [11C]PE2I PET based on QTMnet and AAL atlas, and a comparison of F, Ktrans, Vp and Ve for PD patients and healthy volunteers. We found a significantly lower F and Ktrans for PD patients in superior frontal gyrus, and a positive correlation of F and MoCA score in middle frontal gyrus, which is possible related with loss of dopaminergic neurons of PD patients. Future study may include longitudinal study of PD patients to test the perfusion parameter change with PD progression, and comparison of perfusion parameters of PD patients in different stage.Acknowledgements
No acknowledgement found.References
(1) Zhang, Qihao, Pascal Spincemaille, Michele Drotman, Christine Chen, Sarah Eskreis-Winkler, Weiyuan Huang, Liangdong Zhou et al. "Quantitative transport mapping (QTM) for differentiating benign and malignant breast lesion: Comparison with traditional kinetics modeling and semi-quantitative enhancement curve characteristics." Magnetic Resonance Imaging (2021).
(2) Zhang, Qihao, et al. "Fluid mechanics approach to perfusion quantification: vasculature computational fluid dynamics simulation, quantitative transport mapping (QTM) analysis of dynamics contrast enhanced MRI, and application in nonalcoholic fatty liver disease classification." IEEE Transactions on Biomedical Engineering (2022).
(3) Zhang, Qihao, et al. "Prediction of Lung Shunt Fraction for Yttrium-90 Treatment of Hepatic Tumors Using Dynamic Contrast Enhanced MRI with Quantitative Perfusion Processing." Tomography 8.6 (2022): 2687-2697.
(4) Zhang, Qihao, et al. "Estimating perfusion and permeability using neural network with training data generated from vessel construction and transport simulation", ISMRM 2021.
(5) Poewe, Werner, et al. "Parkinson disease." Nature reviews Disease primers 3.1 (2017): 1-21.
(6) Li, Weihua, et al. "11C‐PE2I and 18F‐Dopa PET for assessing progression rate in Parkinson's: A longitudinal study." Movement Disorders 33.1 (2018): 117-127.
(7) Nasreddine, Z. S., Phillips, N. A., BÃdirian, V. R., Charbonneau, S., Whitehead, V., Collin, I., et al. (2005). The montreal cognitive assessment, MoCA: a brief screening tool for mild cognitive impairment. J. Am. Geriatr. Soc. 53, 695–699. doi: 10.1111/j.1532-5415.2005.53221.x (8) Rolls, Edmund T., Marc Joliot, and Nathalie Tzourio-Mazoyer. "Implementation of a new parcellation of the orbitofrontal cortex in the automated anatomical labeling atlas." Neuroimage 122 (2015): 1-5.
Figures
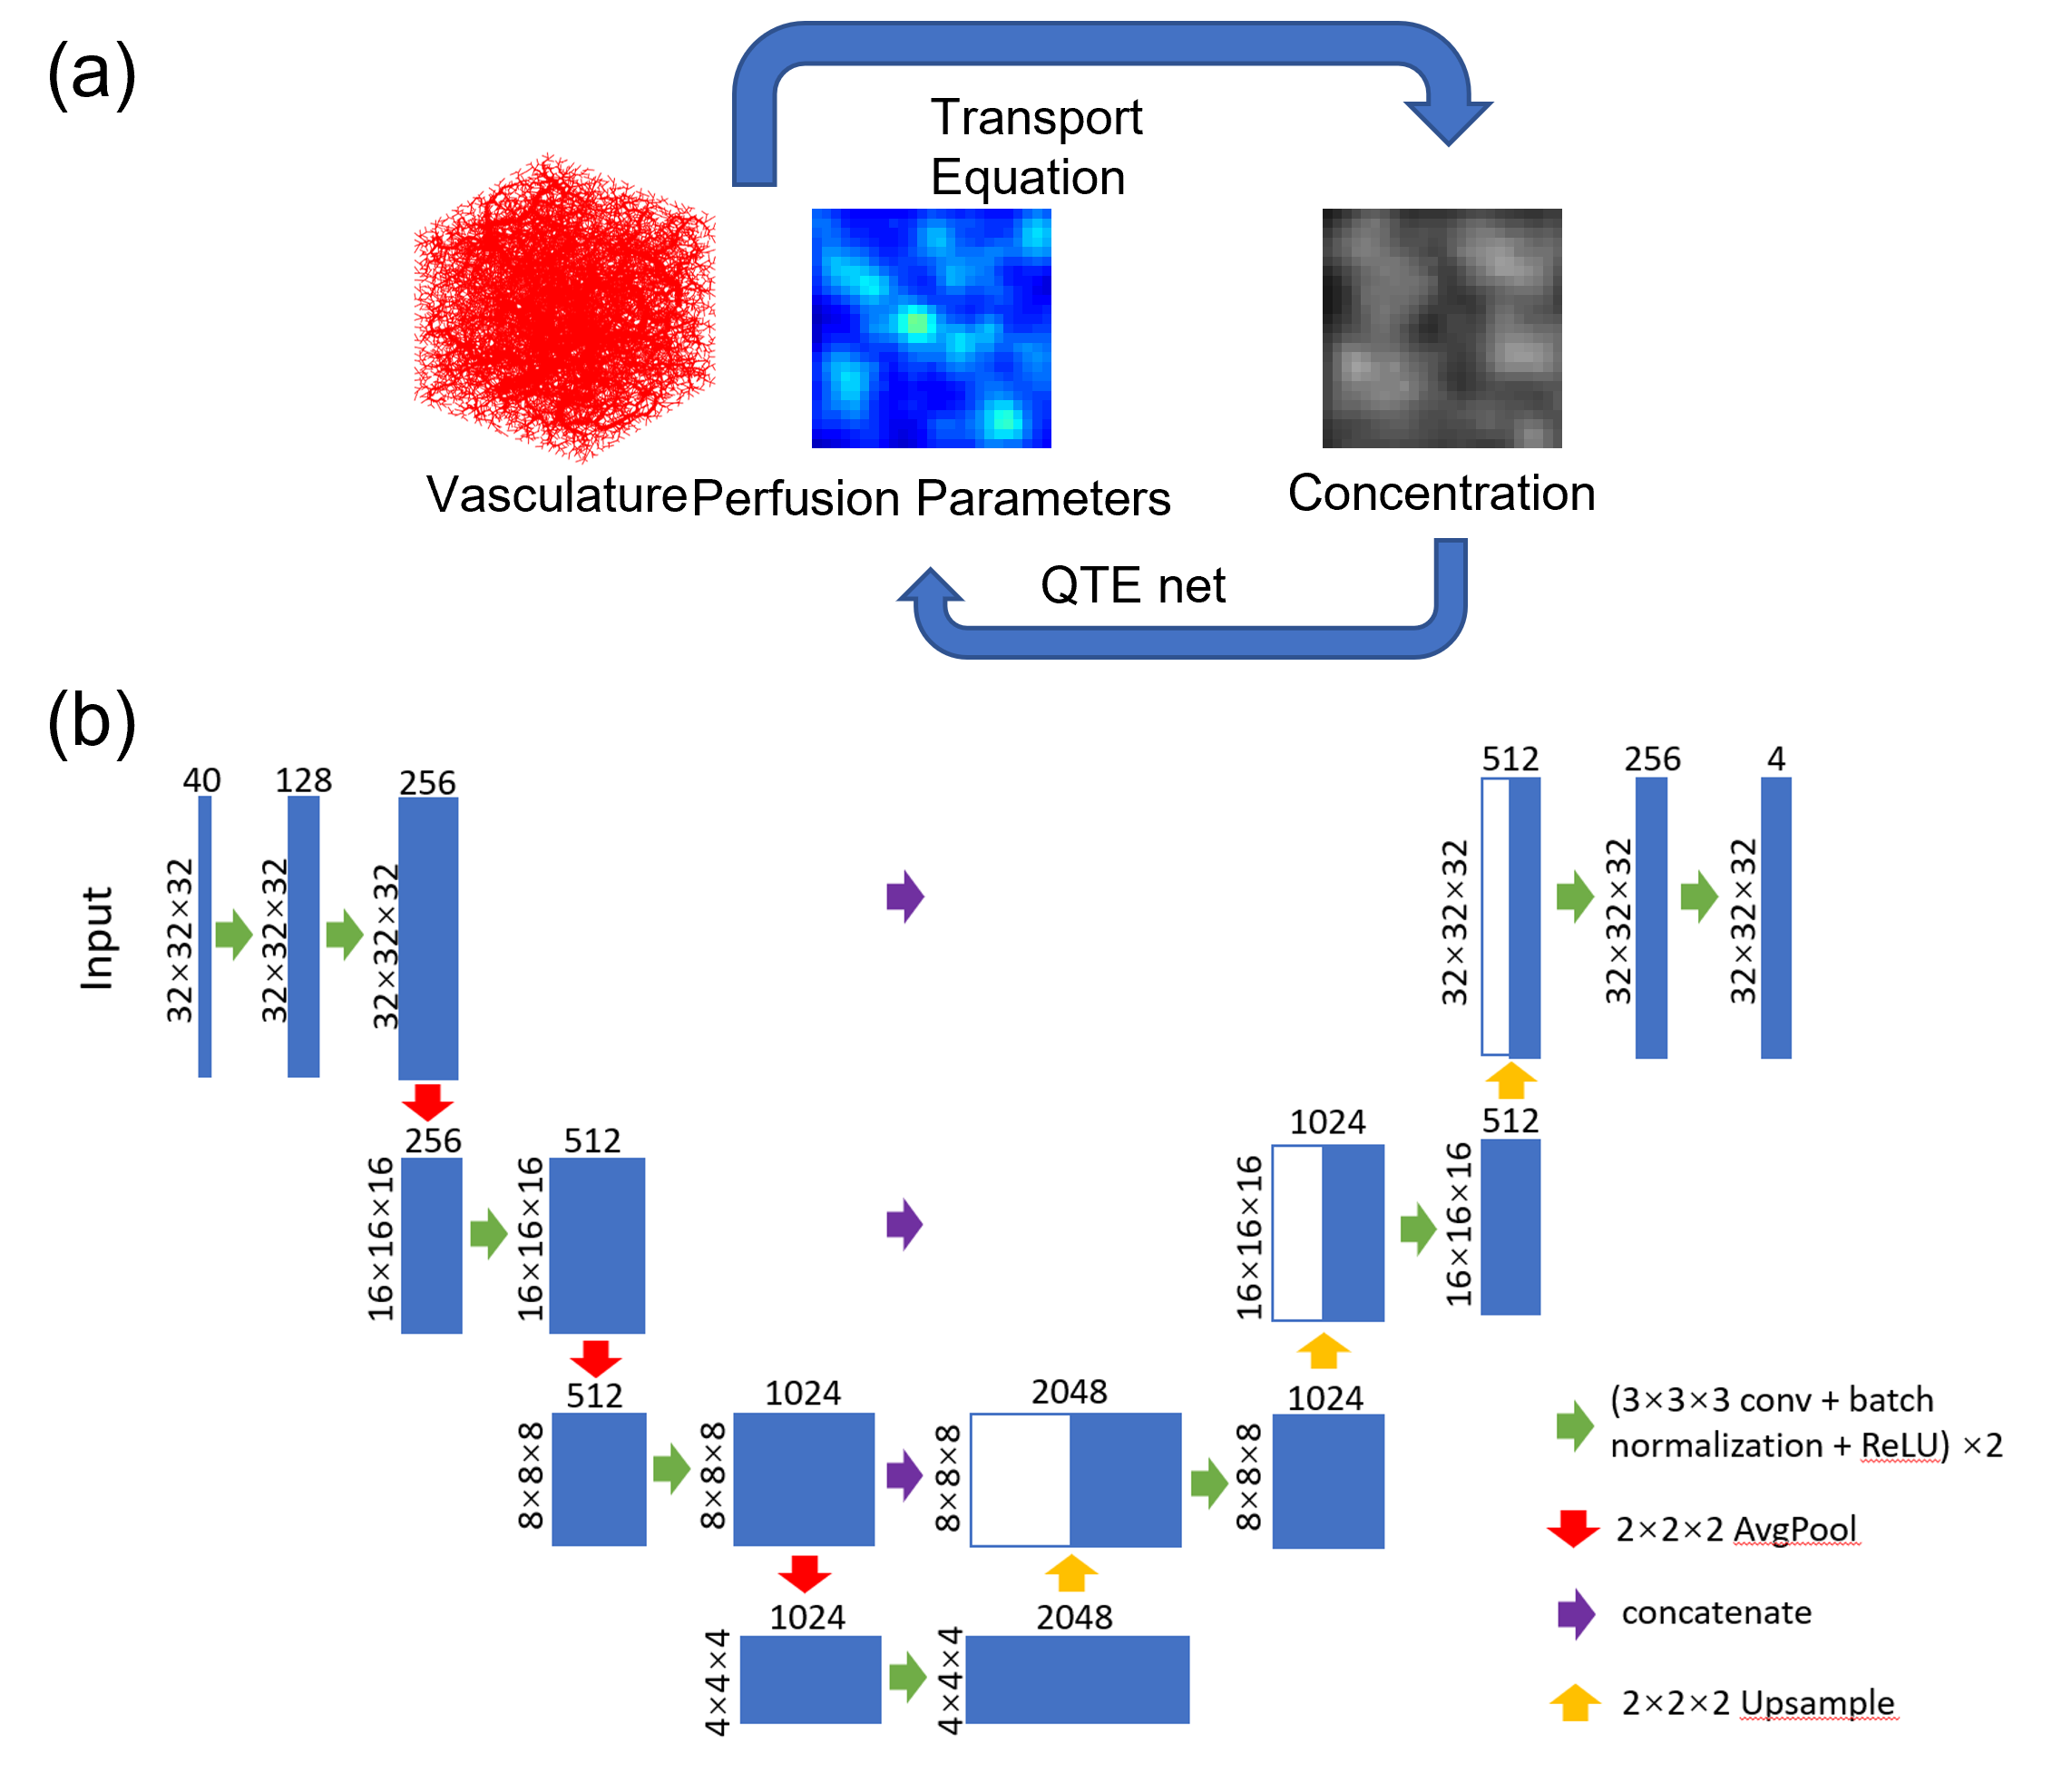
(a) Training pipeline of QTMnet. Vasculature was generated using CCO and tracer propagation was simulated based on transport equation and used to train the network to predict perfusion parameters.
(b) 3D-Unet architecture of QTMnet.

(a)-(d): F, Ktrans, Vp and Ve maps of a Parkinson disease patient, the unit is mL/100g/min, /min, unitless, unitless, accordingly.
(e)-(h): F, Ktrans, Vp and Ve maps of a healthy volunteer.