2284
Effect of levodopa on brain functional network connectivity in Parkinson’s disease patients with MCI.1Cleveland Clinic Lou Ruvo Center for Brain Health, Las Vegas, NV, United States, 2Memory & Cognitive Disorders Program Hoag, Pickup Family Neurosciences Institute, Newport Beach, CA, United States, 3Department of Neurology, The University of Alabama at Birmingham, Birmingham, AL, United States, 4Department of Radiology, The University of Alabama at Birmingham, Birmingham, AL, United States
Synopsis
Keywords: Parkinson's Disease, Brain Connectivity
Mild cognitive impairment in PD patients (PD-MCI) is shown to be a risk factor for the development of dementia over time. However, the distinct factors that contribute to conversion from MCI to dementia are not completely understood. While earlier studies have identified altered functional connectivity (FC) it is still not clear whether PD medication affects brain FC. In the current study, we aim to quantify the impact of medication effect on FC in PD-MCI using resting-state functional MRI. Our findings suggest that altered FC was observed between the groups and with respect to the medication state in the PD-MCI group.Introduction
Mild cognitive impairment in Parkinson’s disease patients (PD-MCI) is shown to be a risk factor for the development of dementia over time [1]. However, not all PD MCI patients progress to dementia, and the distinct factors that contribute to conversion from MCI to dementia are not completely understood. Several earlier studies have identified altered cortical-subcortical (frontostriatal) functional connectivity in Parkinson’s disease patients with mild cognitive impairment (PD-MCI) [1-3]. Insights from these studies are limited because it is still not clear how and to what extent PD medication affects brain functional connectivity [4]. In the current study, we aim to quantify the impact of medication effect on functional connectivity in PD-MCI and PD without MCI (PD-NC) using high temporal resolution resting-state functional MRI (rsfMRI) data and a well-characterized group of patients.Methods
RsfMRI data were obtained from 27 PD participants. 15 PD participants were identified as PD-NC (5 Females; Age: 68.47±7.39years; Years of education (YOE): 14.80±2.65years)) and 23 PD participants were identified as PD-MCI (6 Females; Age: 69.78±6.39years; YOE: 15.83±2.69years) by a consensus diagnosis between a practicing neurologist and neuropsychologist based on clinical presentation and neuropsychological evaluations of each participant. For diagnostic accuracy, PD-MCI was classified after applying a threshold of 1.5 standard deviations below appropriate norms on at least two neuropsychological tests following Movement Disorders Society (MDS) criteria [2]. 850 volumes were acquired at a TR of 700 ms on a 3T MRI scanner and participants were scanned in both OFF and ON states. After standard preprocessing, time series were obtained from 246 different ROIs identified based on the Brainnetome atlases [5]. A 246 x 246 connectivity matrix was obtained for each subject and the connectivity between two ROIs was estimated using Pearson’s correlation. Graph-theoretical measures used to compare group differences were obtained using custom Matlab® scripts and graph-theoretical network analysis (GRETNA) toolbox [6]. We also computed and compared rich-club measures. Non-parametric statistical tests were performed using network-based statistic (NBS) [7] to identify whether there was a difference in functional connectivity between the different groups and between OFF and ON states in the two groups (PD-NC vs PD-MCI (OFF state), PD-NC vs PD-MCI (ON state); OFF PD-NC vs ON PD-NC; OFF PD-MCI vs ON PD-MCI). Nonparametric statistical analyses of group differences between global network properties were then conducted using the permutation analysis of linear models (PALM) toolbox in FSL [8].Results
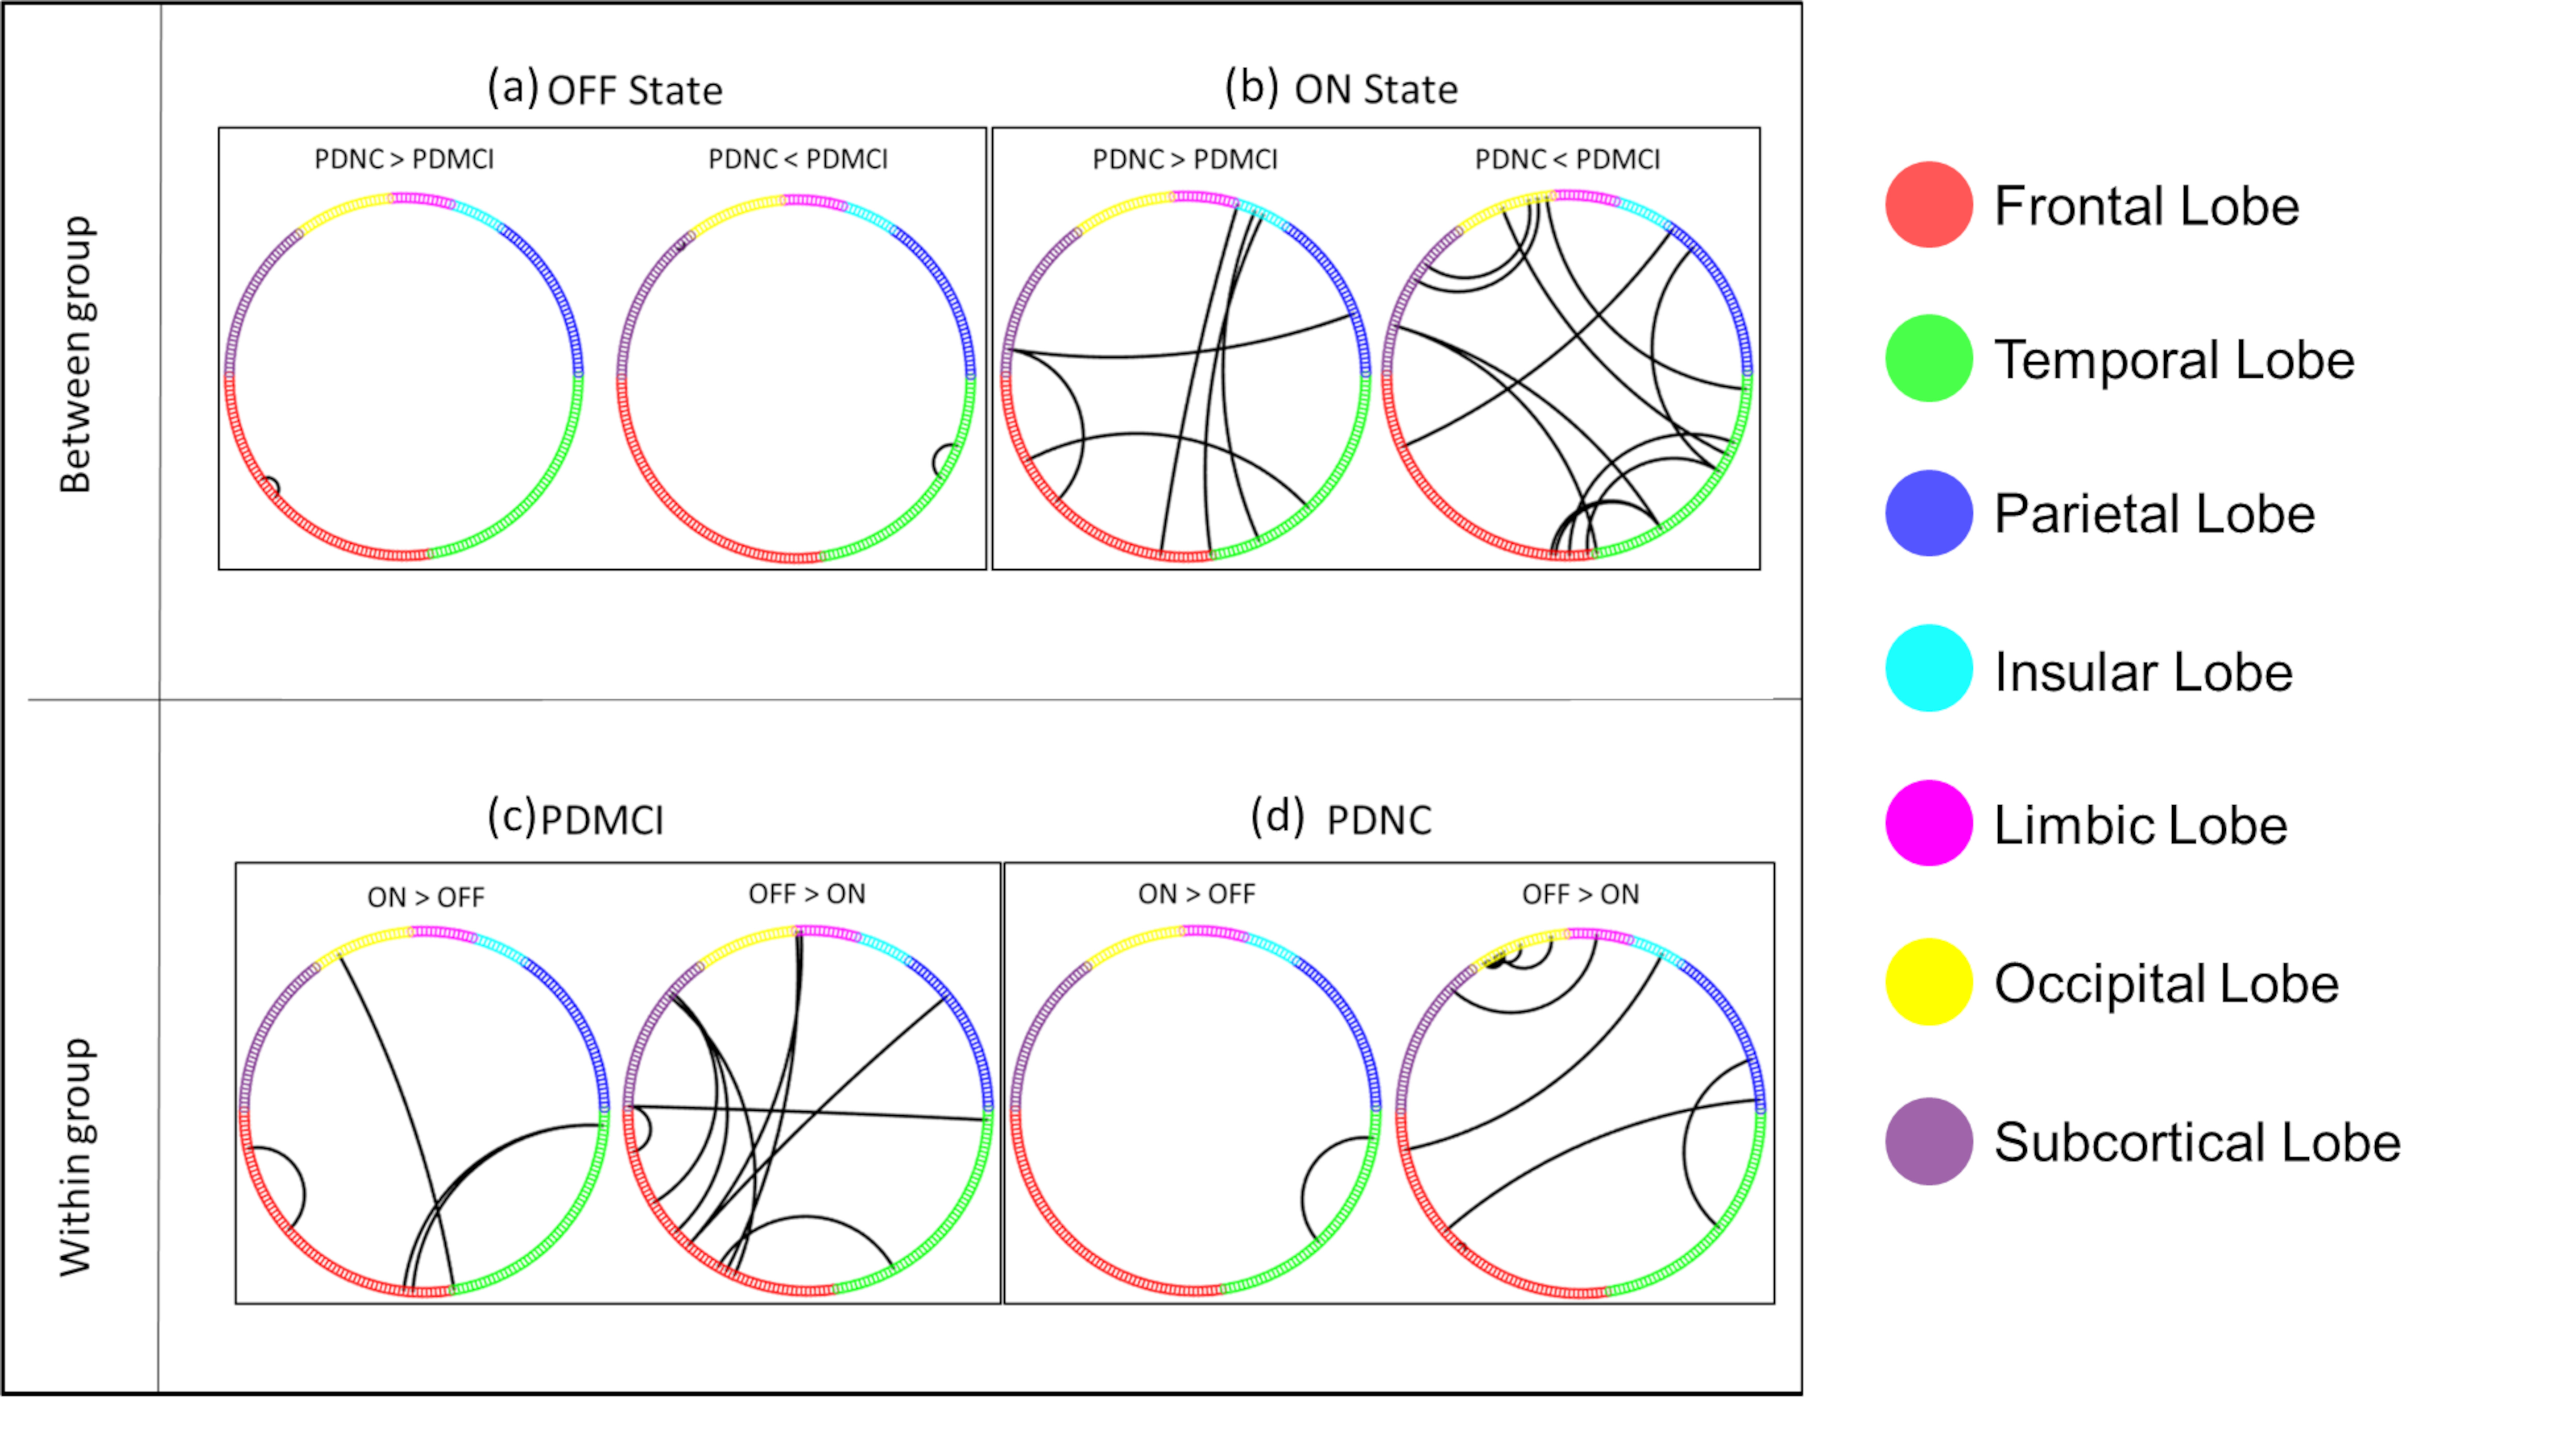
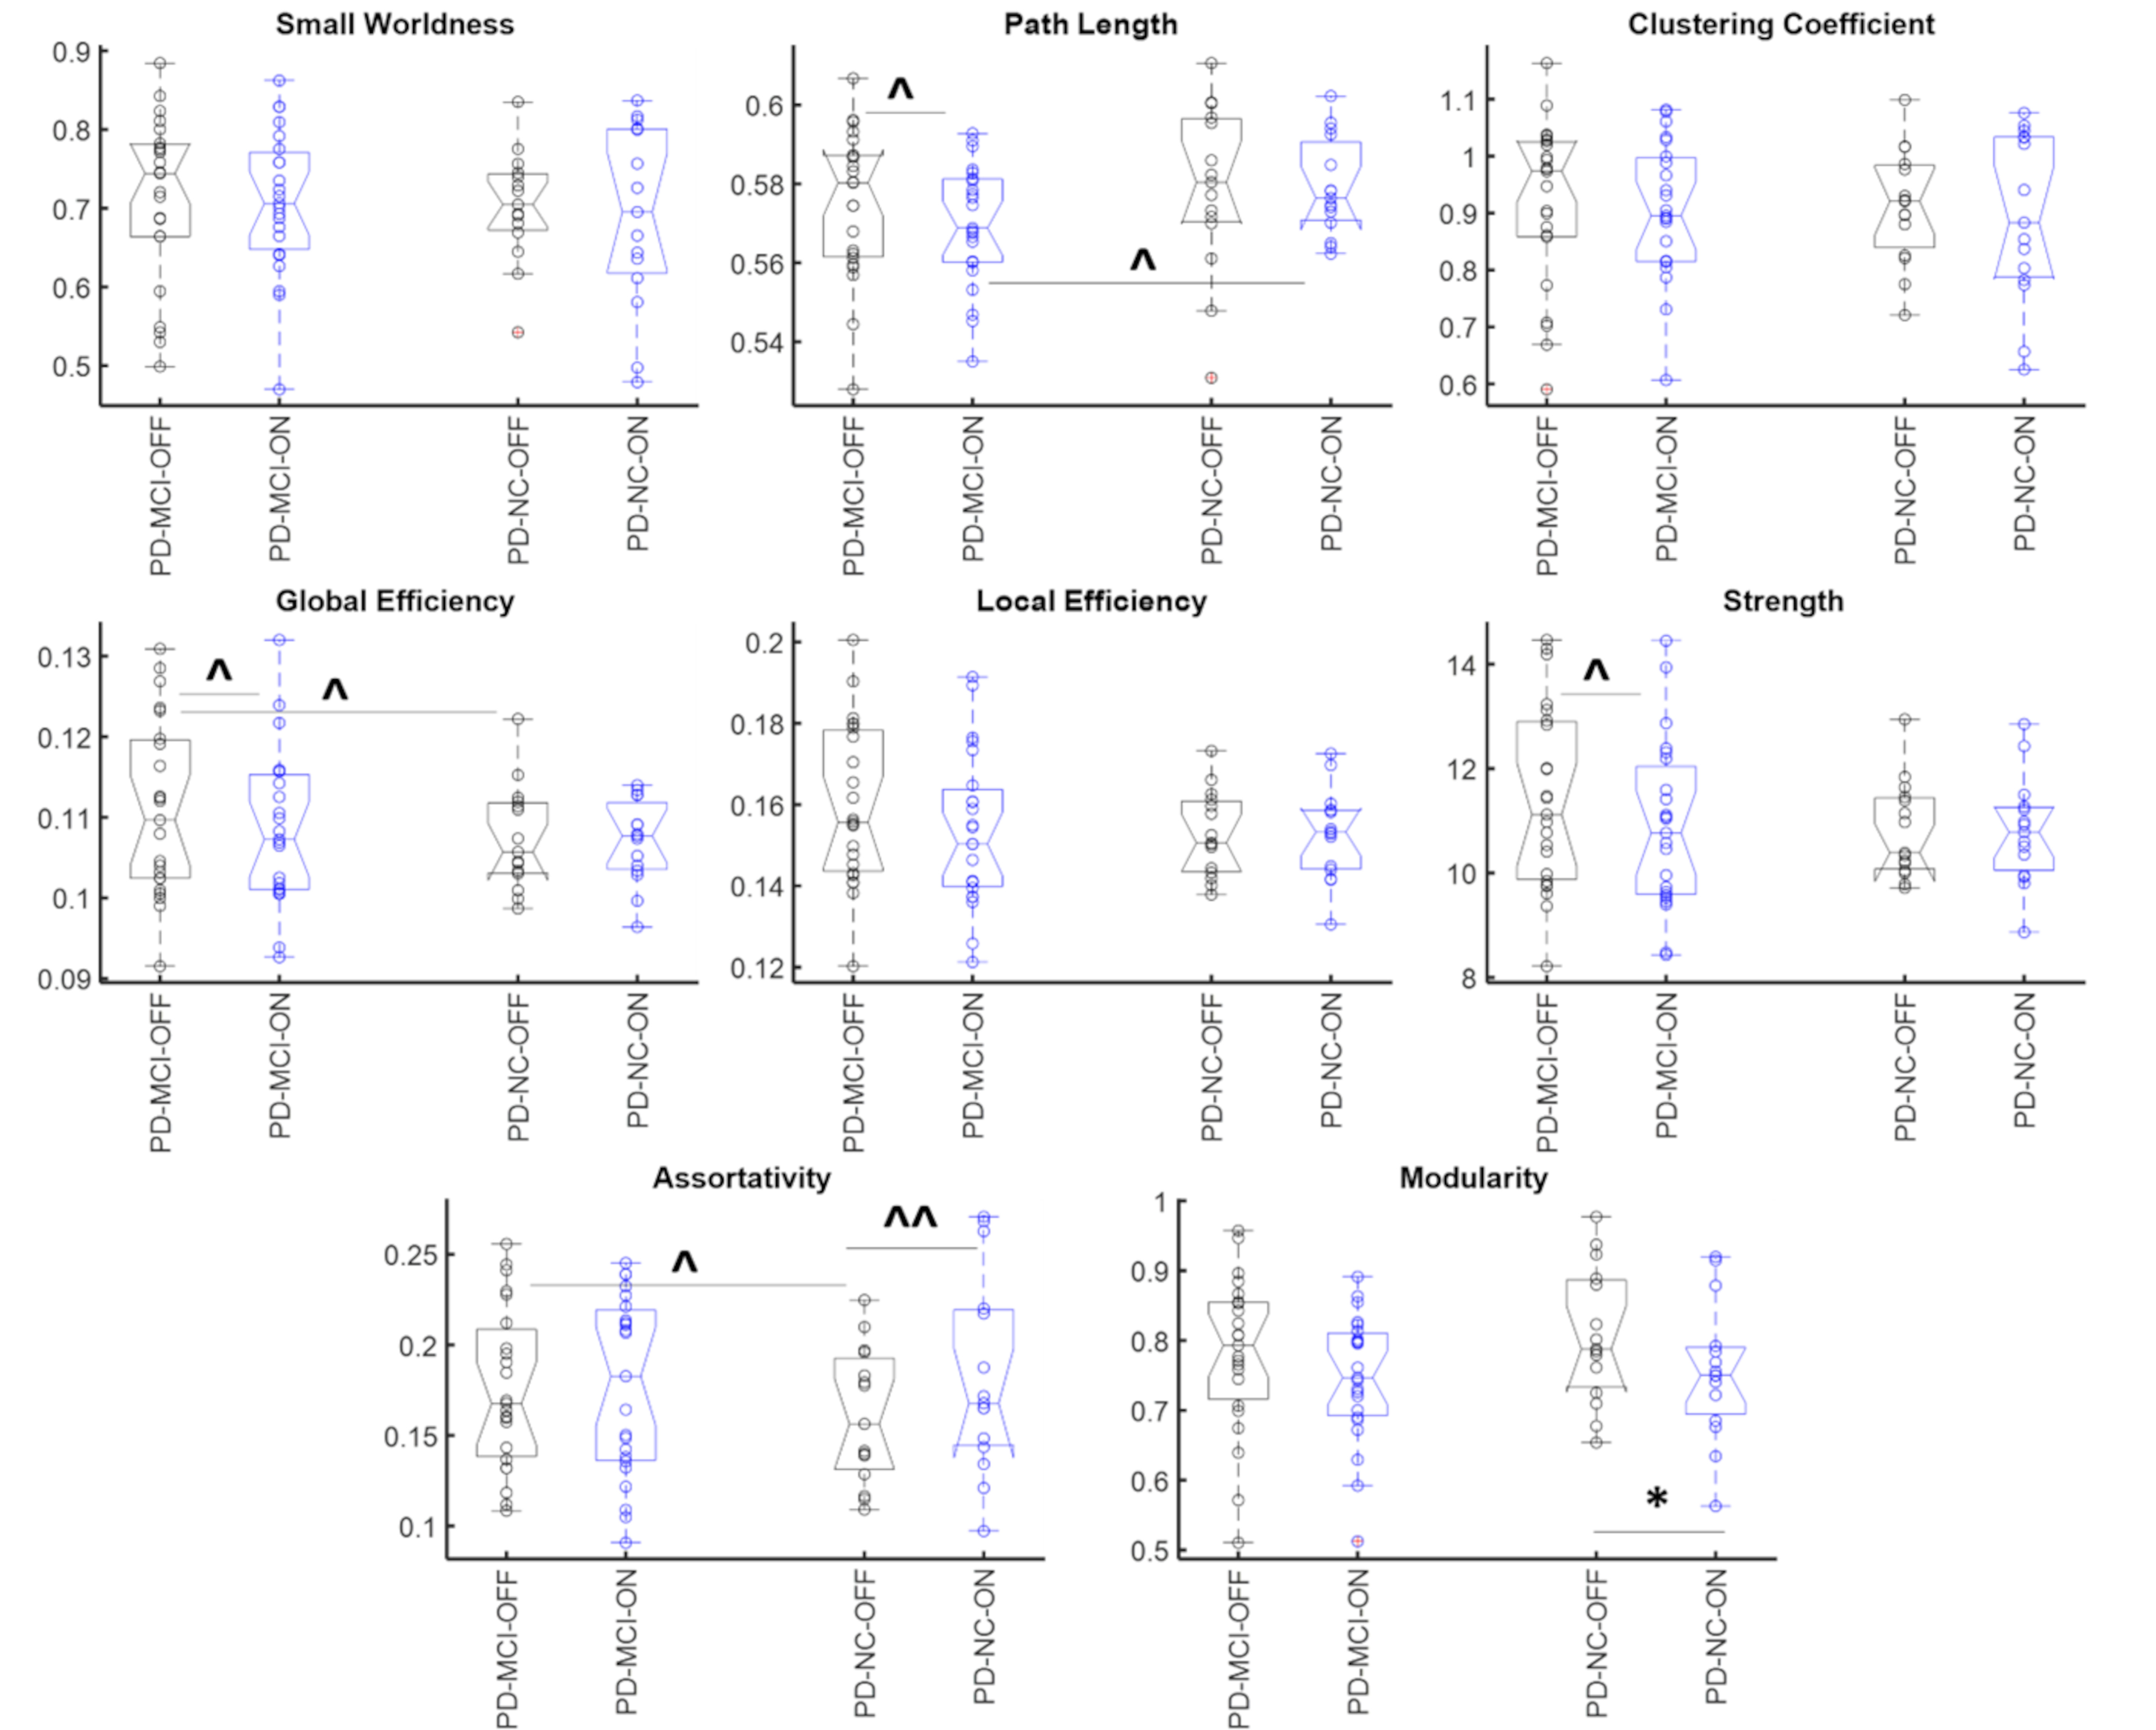
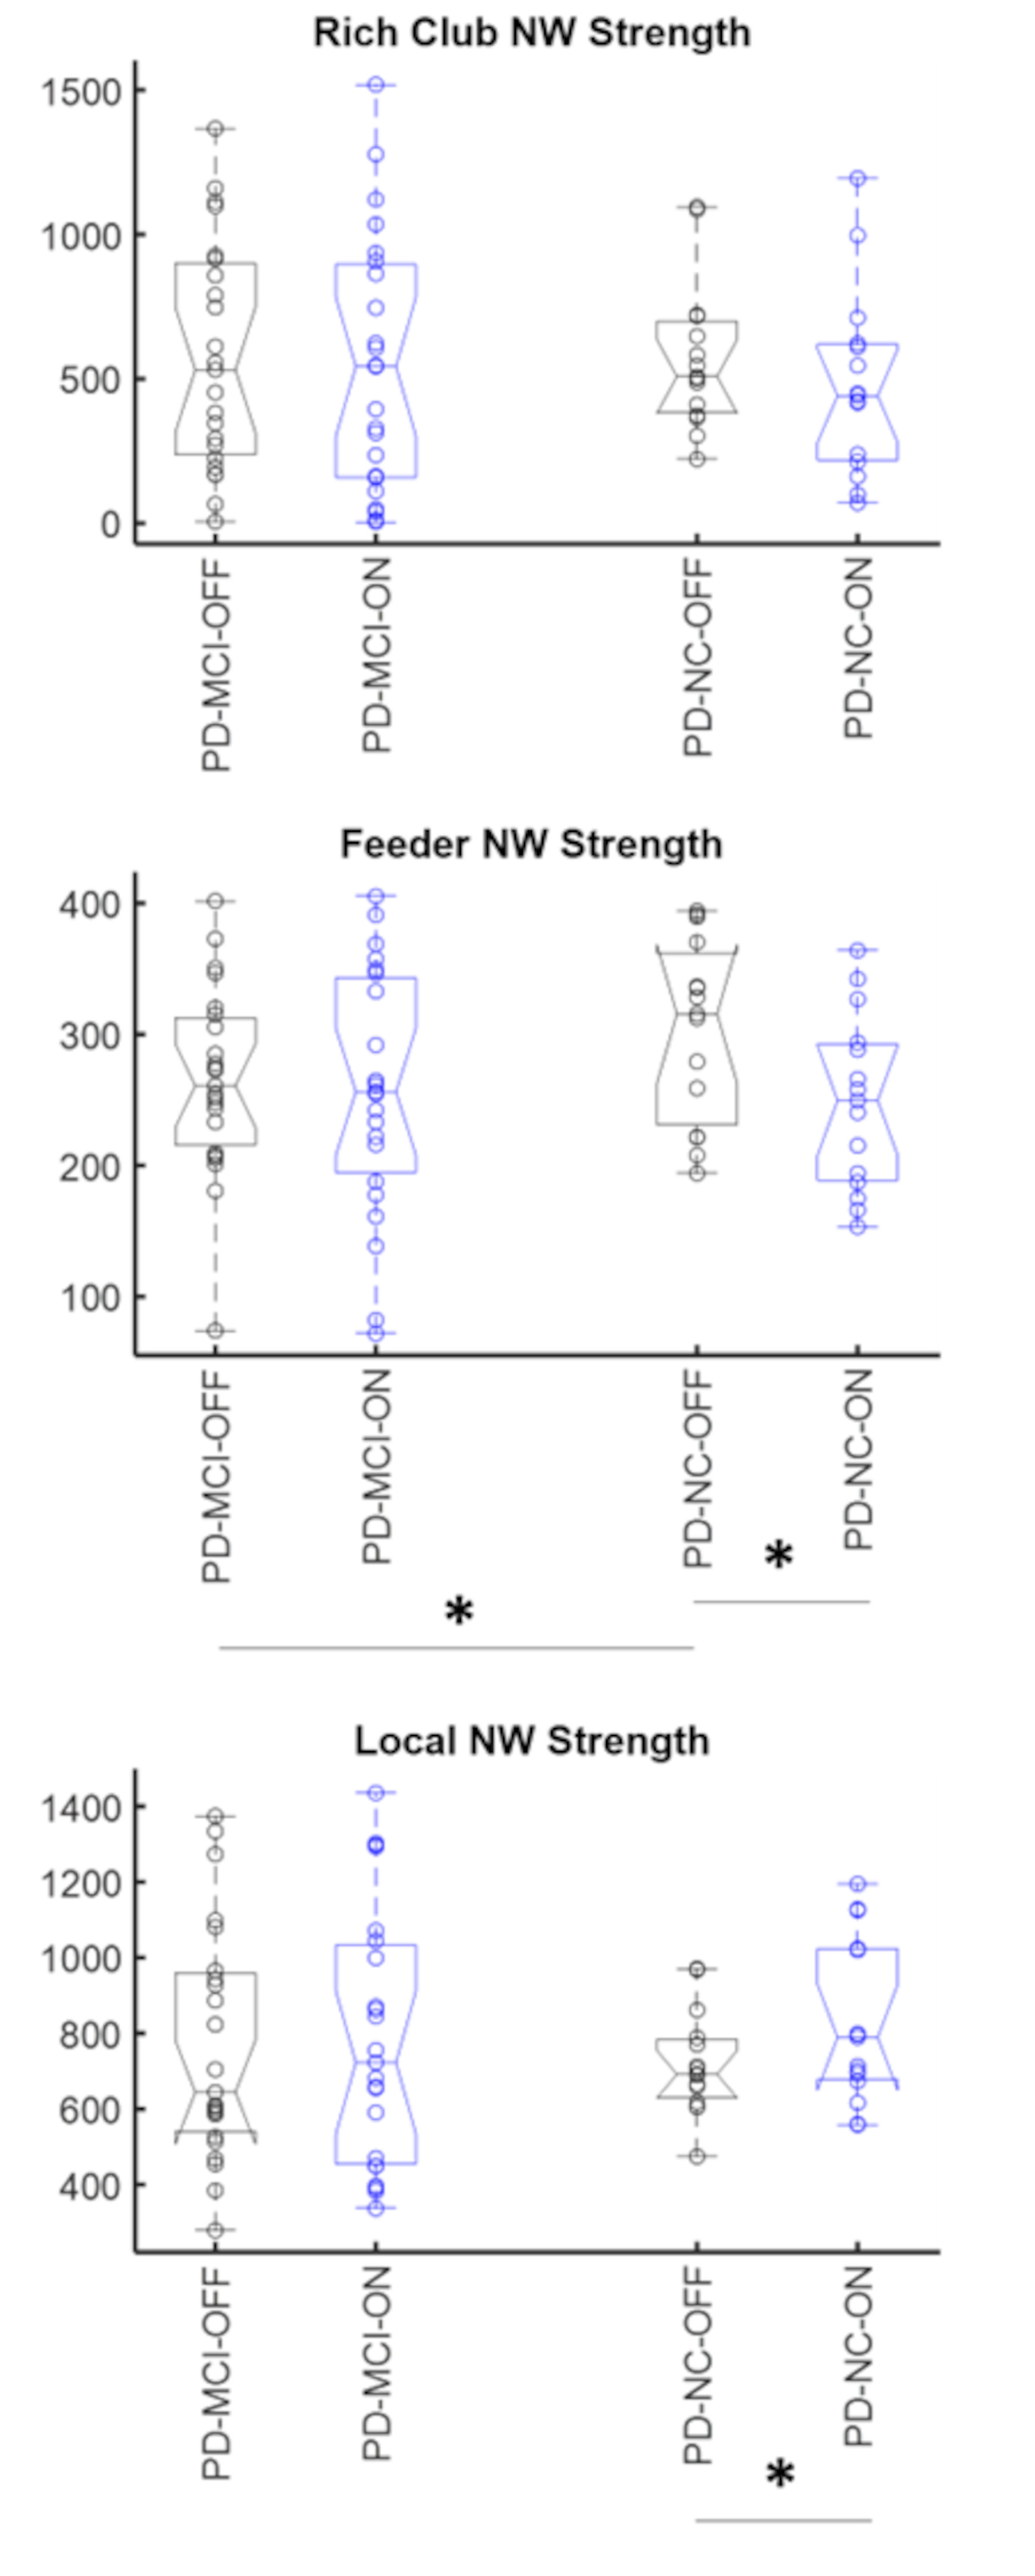
Fig 1a shows the 3 paths involving mainly the frontal lobe and temporal lobe that were significantly different (pFDR<0.05) between the groups in the OFF state. One of them was significantly (pFDR<0.05) greater in the PD-NC group and involved the frontal regions while the other two were greater in the PD-MCI group and involved the temporal and subcortical regions. In the ON state, however (Fig. 2b) the PD-MCI group showed hyper-connectivity involving mainly the temporal and the frontal regions. Some paths were also greater in the PD-NC group involving the frontal and the insular lobe. The ON vs OFF comparisons in the PD-MCI group (Fig. 2c) also showed significantly (pFDR<0.05) altered connectivity involving the frontal and temporal regions. The PD-NC group (Fig. 2d) however showed fewer connections that were different in the ON vs OFF comparisons and mainly involved the occipital region. Fig. 2 shows the network measures that were significantly different between the groups. The modularity was significantly lower in the PD-NC group in the ON compared to the OFF state. None of the other comparisons were statistically different however several network measures showed trend level differences with medium to large effect size mainly in the PD-MCI group (Cohen’s d>0.5). The feeder network and local strength were also significantly altered in the two groups. The PD-MCI group showed significantly reduced feeder network strength in the ON state compared to the PD-NC group (Fig 3b). There PD-NC showed significantly reduced feeder network strength and increased local network strength in the ON state vs OFF state.Discussion
These findings demonstrate that 1) hyper-connectivity was observed involving the frontal and temporal regions in the PD-MCI group compared to the PD-NC group in the ON state, 2) altered connectivity involving frontal and temporal regions was also seen in the PD-MCI group in the ON vs OFF state, and 3) Network properties were altered in both PD group but to a larger extent in the PD-MCI group. Correlations between connectivity and behavioral measures in both ON and OFF states, are currently underway to better understand the relationship between functional network connectivity and cognition and how it is affected by dopaminergic medication.Acknowledgements
This study is supported by the National Institutes of Health (grant 1R01EB014284, R01NS117547, P20GM109025, and P20AG068053), a private grant from the Peter and Angela Dal Pezzo funds, a private grant from Lynn and William Weidner, a private grant from Stacie and Chuck Matthewson and the Keep Memory Alive-Young Investigator Award (Keep Memory Alive Foundation).References
[1] Hely MA, Reid WG, Adena MA, Halliday GM, Morris JG. The Sydney multicenter study of Parkinson's disease: the inevitability of dementia at 20 years. Mov Disord. 2008 Apr 30;23(6):837-44. doi: 10.1002/mds.21956. PMID: 18307261.
[2] Litvan I, Goldman JG, Tröster AI, et al. Diagnostic criteria for mild cognitive impairment in Parkinson’s disease: Movement Disorder Society Task Force guidelines. Mov Disord. 2012/01/24. 2012;27:349–356.
[3] Monchi O, Hanganu A, Bellec P. Markers of cognitive decline in PD: The case for heterogeneity. Parkinsonism Relat Disord. 2016 Mar;24:8-14. doi: 10.1016/j.parkreldis.2016.01.002. Epub 2016 Jan 7. PMID: 26774536.
[4] M. Tahmasian, L.M. Bettray, T. van Eimeren, A. Drzezga, L. Timmermann, C.R. Eickhoff, S.B. Eickhoff, C. Eggers, A systematic review on the applications of resting-state fMRI in Parkinson’s disease: Does dopamine replacement therapy play a role?, Cortex. 73 (2015) 80–105. doi:10.1016/j.cortex.2015.08.005.
[5] Fan L, Li H, Zhuo J, Zhang Y, Wang J, Chen L, Yang Z, Chu C, Xie S, Laird AR, Fox PT, Eickhoff SB, Yu C, Jiang T. The Human Brainnetome Atlas: A New Brain Atlas Based on Connectional Architecture. Cereb Cortex. 2016 Aug;26(8):3508-26. doi: 10.1093/cercor/bhw157. Epub 2016 May 26. PMID: 27230218; PMCID: PMC4961028.
[6] Wang, J., Wang, X., Xia, M., Liao, X., Evans, A., He, Y., 2015. GRETNA: A graph theoretical network analysis toolbox for imaging connectomics. Front. Hum. Neurosci. 9, 386.
[7] Zalesky A, Fornito A, Bullmore ET. Network-based statistic: identifying differences in brain networks. Neuroimage 2010; 53: 1197–1207.
[8] Winkler AM, Ridgway GR, Webster MA, Smith SM, Nichols TE. Permutation inference for the general linear model. Neuroimage 2014; 92: 381–397.
Figures