2282
Application of QSM and tSWI in evaluating substantia nigra "swallow tail sign" in the diagnosis of Parkinson's disease1Department of Radiology, Ruijin Hospital, Shanghai Jiao Tong University School of Medicine, shanghai, China, 2SpinTech MRI, Bingham Farms, MI, United States
Synopsis
Keywords: Parkinson's Disease, Parkinson's Disease, swallow tail sign,substantia nigra,MRI
The incidence of Parkinson's disease(PD) is high and the clinical symptoms are diverse making the diagnosis of PD difficult. Loss of the “swallow tail sign” (STS) as an imaging biomarker in the diagnosis of PD. It is of great value in the early diagnosis of PD and the improvement of prognosis. In this study, QSM and tSWI, were used to evaluate the STS of substantia nigra in PD patients. The results show tSWI can better display STS than QSM and its accuracy is higher.Introduction
Parkinson's disease (PD) is a chronic and progressive neurodegenerative disease, which usually occurs in middle-aged and elderly people over the age of 50 years. Due to the lack of objective biomarkers, the diagnosis of PD mainly relies on the evaluation of clinical symptoms which is greatly influenced by subjective factors1. Therefore, there is a need for imaging biomarkers that reflect the pathophysiological changes of early PD. Such a biomarker should contribute to its early diagnosis and improve the prognosis of the patient. The early pathophysiological changes of PD involves a loss of dopaminergic neurons and subsequent iron deposition in the substantia nigra pars compacta (SNpc) ,especially the dorsolateral region of SNpc. This region is referred to as the nigrosome 1 (N1) and is the location where NM is first lost2-3.In T2*W or Susceptibility Weighted Imaging (SWI), the N1 region of healthy controls shows a high signal, surrounded by low signals from high iron content regions; this visual effect is called the "swallow tail sign" (STS)4. In PD patients, due to the loss of dopaminergic neurons in this region and the subsequent increase in iron content, the N1 sign disappears. Previous systematic reviews and meta-analyses have found that the loss of the STS can be used as an imaging marker for pathophysiological changes in PD patients5.Therefore, it is important for PD diagnosis to clearly show the STS. Quantitative susceptibility mapping (QSM) and true SWI ( tSWI) reveal the presence of iron and can be used to visualize the STS6-9. The purpose of this study was to evaluate the STS in the substantia nigra of PD patients using both QSM and tSWI and to compare the accuracy of the two methods.
Methods
A total of 100 healthy controls (HC) and 100 PD patients underwent head MRI examination in our hospital from October 2018 to April 2020 were collected. They were scanned on a 3T Philips MRI system.The MRI sequences included: whole-brain T2WI FLAIR, DWI; 3D-GRE sequences with two flip angles; and a 7-echo MTC-GRE (Magnetization transfer contrast-gradient echo) scan of the midbrain. The FOV=256mm×192mm, matrix=384×144; 3D-GRE sequence, flip angles=24°and 6°, TEs=7.5ms and 17.5ms, TR= 25ms, pixel bandwidth=220Hz/Px, slice number= 64, slice thickness=2mm, in-plane resolution = 0.67mm×1.34mm and a scan time = 1 min 53 s.. The 24° scan represents T1W imaging and the 6°scan proton weighted imaging. MTC-GRE sequence imaging parameters were: TE=75ms, ΔTE=7.5ms, TR=62ms, flip angle=30°, pixel bandwidth=174Hz/pixel, slice number=64, slice thickness=2mm, in-plane resolution=0.67mm×1.34mm, scanning time =4 min 47s. The amplitude and phase data of each echo of the GRE sequence with two flip angles were processed and the QSM and tSWI images calculated. The TE=7.5ms data was used to obtain the MTC NM image.The tSWI data was obtained by high pass filtering the QSM data and then creating a mask to suppress regions of high iron content10. Two senior neuroradiologists evaluated the N1 sign for all 200 cases of PD and HC based on the T2*W images, the neuromelanin image, the QSM map and the tSWI map. The diagnostic efficiency of the loss of STS in distinguishing PD from HC was obtained, which was taken as the "gold standard". Then two other doctors (A and B) evaluated the STS based on the QSM and tSWI images. The ICC was calculated based on their evaluations relative to the "gold standard" respectively.
Results
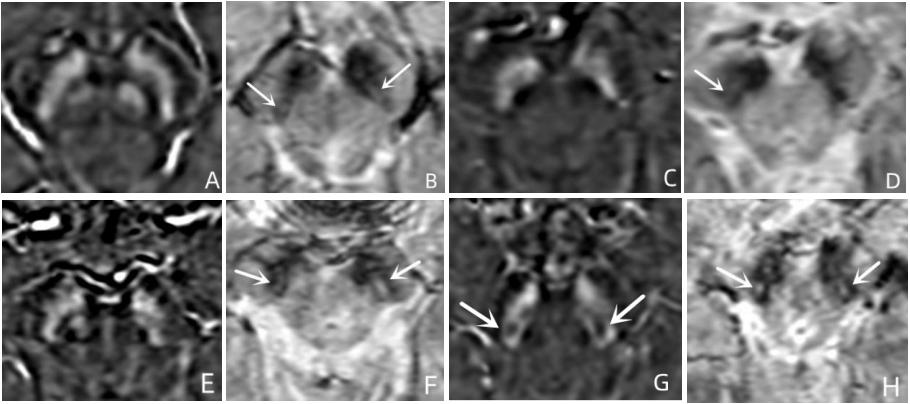
Among the 100 PD patients, 61 (61%) showed loss of unilateral or bilateral STS, including 23 unilateral cases and 38 bilateral cases (Figure1 A-D). Among 100 HCs, 8 (8%) showed loss of unilateral or bilateral STS,including 7 unilateral cases and 1 bilateral case (Figure1 E-F). The sensitivity, specificity and accuracy of distinguishing PD from HC were 61%, 92% and 76.50% respectively. The ICC value of STS evaluated by Radiologists A and B based on QSM and tSWI respectively was 0.832 for QSM and 0.909 for tSWI. For Radiologists A and B,based on QSM and tSWI, the accuracy of N1 compared with the gold standard was 65% and 91% for A and 60% and 90.5% for B, respectively.Discussion and Conclusion
Compared with previous studies3,5, the sensitivity of our study is low. The reason may be these are earlystage PD patients in which the STS is still present to some degree and has not completely disappeared. Todate, no one has yet carefully studied this issue of the expected size of the N1 hyperintense region. Hence,we are still counting a STS as long as it is visible even in part. In addition, the evaluation of STS in thisstudy was only divided into presence and complete loss, without quantitative evaluation. Our study showtSWI can better display STS than QSM, a finding similar to previous studies11,12.The tSWI images havehigher contrast as they combine the best features from the high pass filtered QSM data and the originalT2*W images9. Finally, although tSWI is similar to SWI, it no longer has orientation dependence or phasealiasing SWI's artifacts and it is able to show the STS clearly.Acknowledgements
NoReferences
1.Postuma RB, Berg D, Stern M, et al. Mds Clinical Diagnostic Criteria for Parkinson's Disease. Mov Disord.2015; 30(12):1591-601.
2.Jellinger K, Paulus W, Grundke-Iqbal I, et al. Brain Iron and Ferritin in Parkinson's and Alzheimer's Diseases. J Neural Transm Park Dis Dement Sect.1990; 2(4):327-40.
3.Schwarz ST, Mougin O, Xing Y, et al. Parkinson's Disease Related Signal Change in the Nigrosomes 1-5 and the Substantia Nigra Using T2* Weighted 7t Mri. Neuroimage Clin .2018; 19:683-9.
4.Schwarz ST, Afzal M, Morgan PS, et al. The 'Swallow Tail' Appearance of the Healthy Nigrosome - a New Accurate Test of Parkinson's Disease: A Case-Control and Retrospective Cross-Sectional Mri Study at 3t. PLoS One.2014; 9(4):e93814.
5.Mahlknecht P, Krismer F, Poewe W, et al. Meta-Analysis of Dorsolateral Nigral Hyperintensity on Magnetic Resonance Imaging as a Marker for Parkinson's Disease. Mov Disord.2017; 32(4):619-23.
6.Wang Y, Liu T. Quantitative Susceptibility Mapping (Qsm): Decoding Mri Data for a Tissue Magnetic Biomarker. Magn Reson Med.2015; 73(1):82-101.
7.Deistung A, Schafer A, Schweser F, et al. Toward in Vivo Histology: A Comparison of Quantitative Susceptibility Mapping (Qsm) with Magnitude-, Phase-, and R2*-Imaging at Ultra-High Magnetic Field Strength. Neuroimage. 2013; 65:299-314.
8.Liu C, Li W, Tong KA, et al. Susceptibility-Weighted Imaging and Quantitative Susceptibility Mapping in the Brain. J Magn Reson Imaging .2015; 42(1):23-41.
9.Gho SM, Liu C, Li W, et al. Susceptibility Map-Weighted Imaging (Smwi) for Neuroimaging. Magn Reson Med.2014; 72(2):337-46.
10.Liu S, Mok K, Neelavalli J, et al. Improved Mr Venography Using Quantitative Susceptibility-Weighted Imaging. J Magn Reson Imaging.2014; 40(3):698-708.
11.Nam Y, Gho SM, Kim DH, et al. Imaging of Nigrosome 1 in Substantia Nigra at 3t Using Multiecho Susceptibility Map-Weighted Imaging (Smwi). J Magn Reson Imaging. 2017; 46(2):528-36.
12.Liu X, Wang N, Chen C, et al. Swallow Tail Sign on Susceptibility Map-Weighted Imaging (Smwi) for Disease Diagnosing and Severity Evaluating in Parkinsonism. Acta Radiol. 2021; 62(2):234-42.
Figures