2280
Diffusion and structural MRI as potential biomarkers to reflect correlation with plasma biomarkers in nondemented Parkinson’s disease1Healthy Aging Research Center, Chang Gung University, Taoyuan, Taiwan, 2Department of Radiology, MacKay Memorial Hospital, Taipei, Taiwan, 3Department of Neurology, MacKay Memorial Hospital, Taipei, Taiwan, 4Department of Diagnostic Radiology, Chang Gung Memorial Hospital at Keelung, Keelung, Taiwan, 5Department of Medical Imaging and Radiological Sciences, Chang Gung University, Taoyuan, Taiwan
Synopsis
Keywords: Parkinson's Disease, Diffusion Tensor Imaging
Parkinson’s disease (PD) is a progressive neurodegenerative disease with motor dysfunction and cognitive impairments frequently. Previous studies indicated that diffusion MRI could detect white matter alteration in the brain, which can be correlated with disease severity. We use diffusion MRI to investigate the relationship between cognitive functions and these plasma biomarkers. Our study showed that the involved regions might play important roles in early cognitive decline as related to the pathological deposition of the respective plasma biomarkers. This observation might help to elucidate the early pathological change of the brain contributing to different cognitive declines in PD patients.Introduction
Parkinson’s disease (PD) is a progressive neurodegenerative disease. The main symptoms is motor dysfunction. However, cognitive impairments frequently occur. Such cognitive decline raised serious concerns from public health, because the impact was expected to increase in an aging society 1. The disease was often related to plasma markers, for example, Amyloid beta peptide (Aβ) and total tau (T-tau). Both can be indicators of increased risk of dementia in PD patients 2.Diffusion MRI can detect white matter alteration in the brain, which can be correlated with disease severity 3-5. Such regional diffusion alteration in the brain can be related to the cognitive impairments in PD subjects 6. Identification of the early pathological foci is helpful in the prediction of cognitive decline and can be crucial in the progression of dementia.
The relationship between the cognitive functions and these plasma biomarkers was investigated by using diffusion MRI. The aim of the study was to identify the potential target deposition regions of the plasma biomarkers in the brain and to evaluate the correlation between these plasma biomarkers on the early cognitive decline.
Methods
The study was performed in accordance with the Declaration of Helsinki and was approved by the local Institutional Review Board. All participants provided written informed consent after full explanation of the study procedures. In total, 51 eligible PD participants (men/women: 27/24; mean age: 72.8±8.6 years) was enrolled.The levels of plasma Aβ-42, and T-tau were measured by immunomagnetic reduction assay 2. Imaging was performed on a 1.5T MR scanner (Magnetom Aera; Siemens, Erlangen, Germany). T1 weighted images were acquired by using a MPRAGE sequence for anatomical reference. Diffusion weighted images were acquired with the diffusion weighted gradients applied along 64 non-collinear directions and a b-value = 1000 s/mm2.
Diffusion tensor was reconstructed by using Diffusion Kurtosis Estimator 7 from diffusion-weighted images. Tensor derived indices included mean diffusivity (MD), radial diffusivity (RD), axial diffusivity (AD), and fractional anisotropy (FA). The image parcellation followed Tsai et al. 4. The median value of tensor derived index in each 116 parcellated brain regions were recorded. Cortical surface area, thickness and volume, in 68 cortical regions as specified by Desikan-Killiany atlas 8, were calculated from T1-weighted images by using FreeSurfer 5.3.
Results
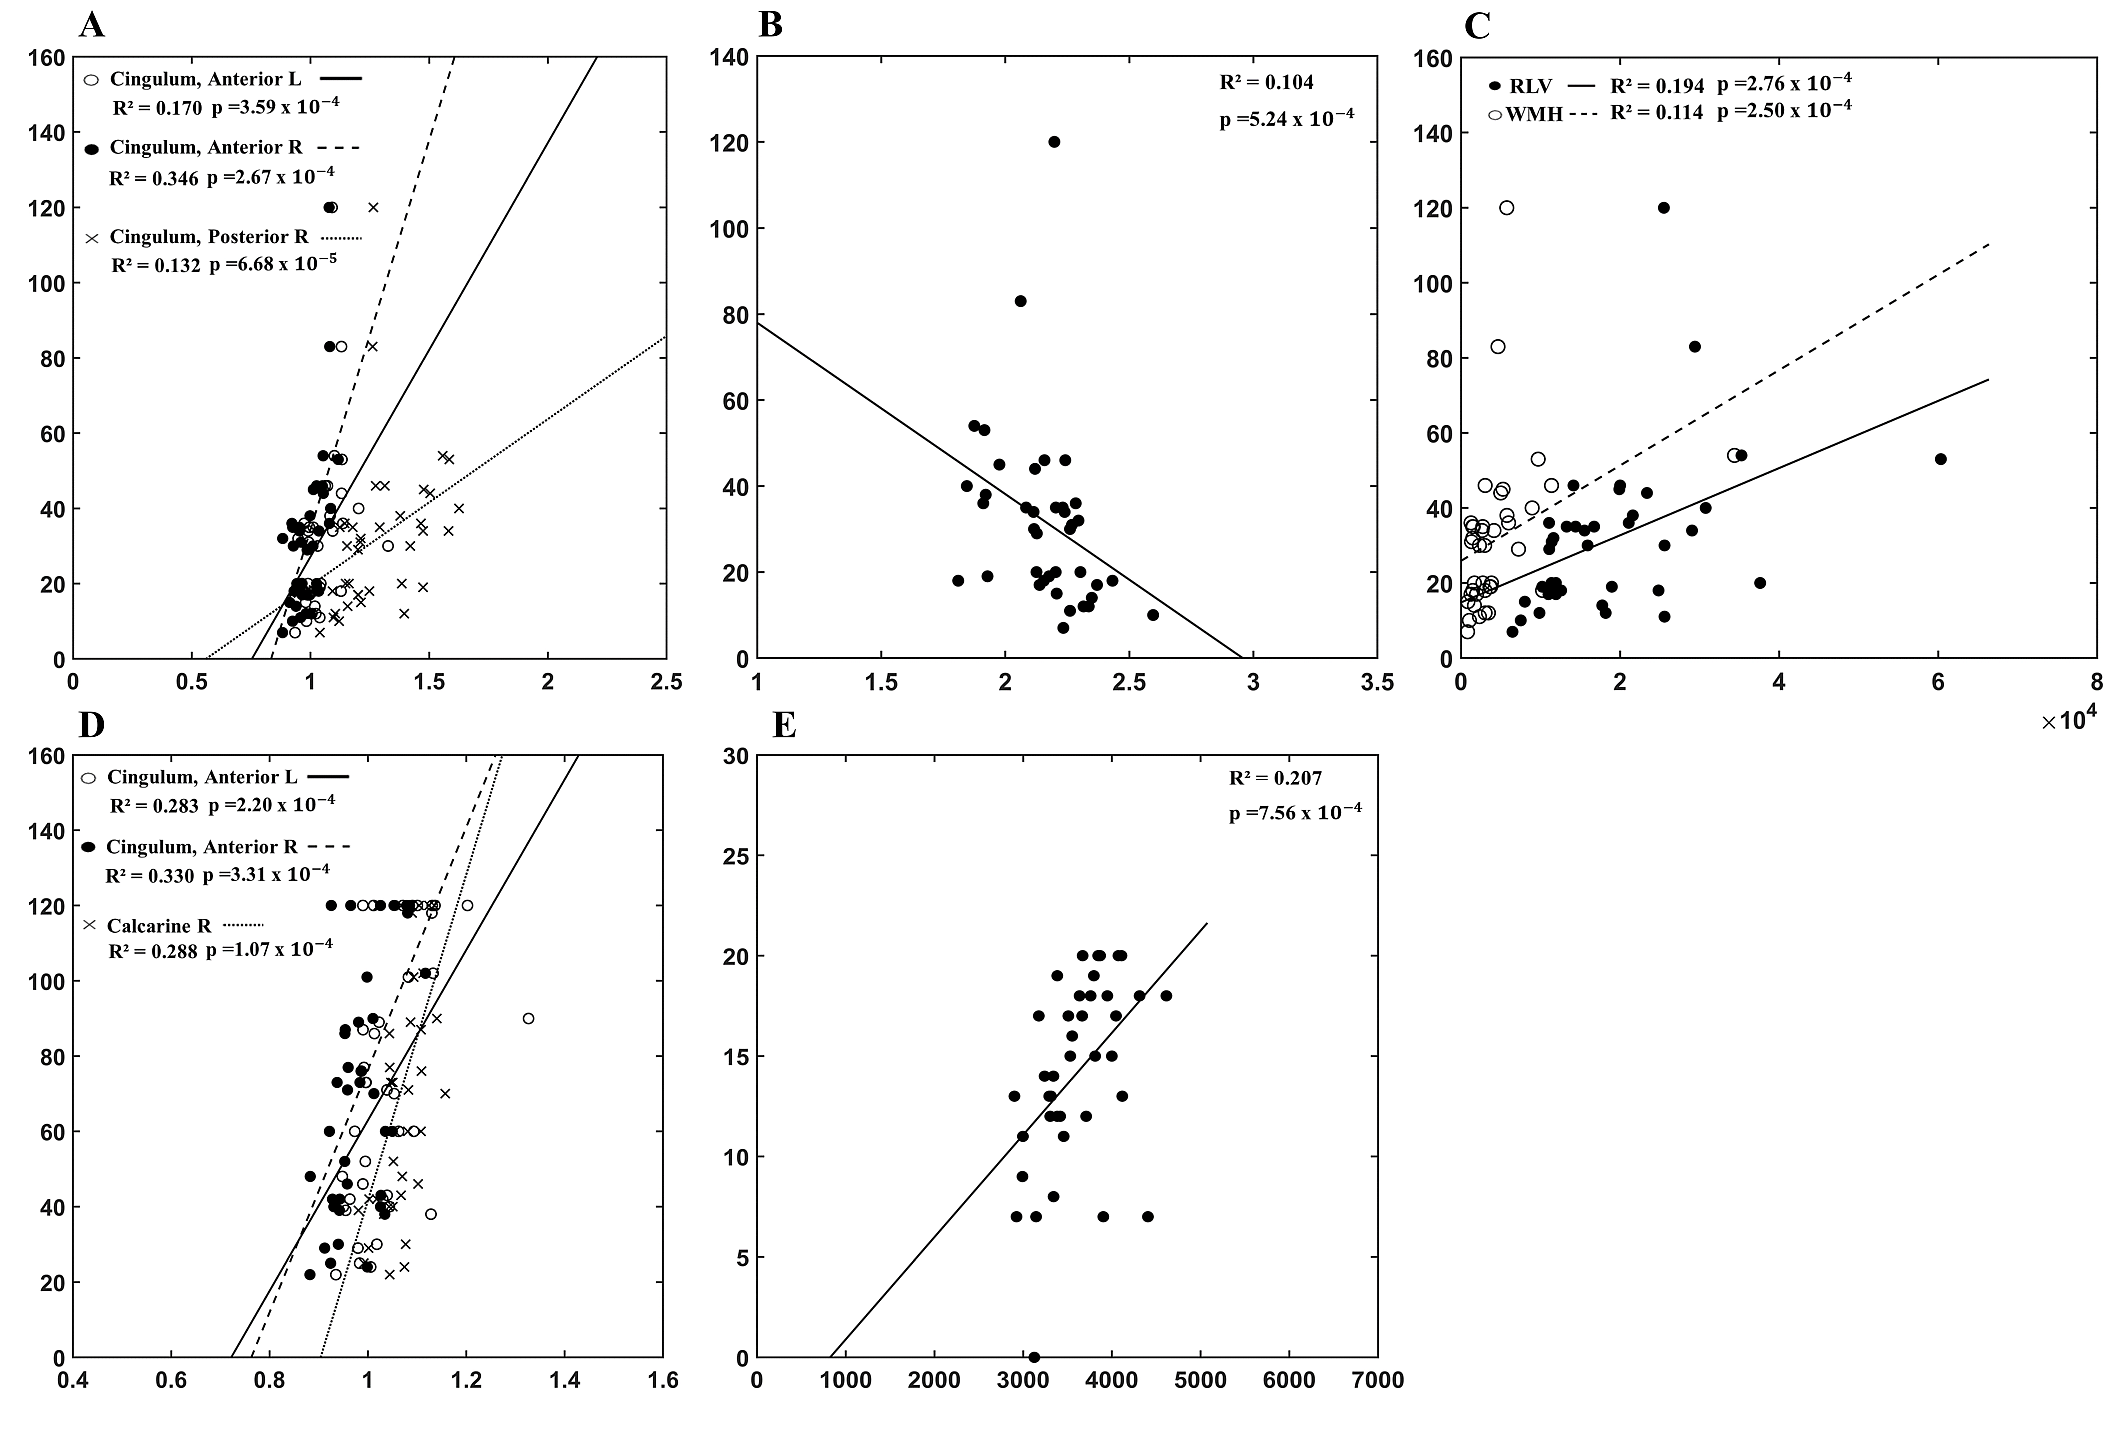
Figure 1 showed the regression analysis of MRI and plasma markers. A negative correlation between the plasma level of Aβ-42 and FA of the right inferior temporal gyrus (adjusted R2=0.277, p=3.95x10⁻⁴, Panel A) was found. There was positive correlation between the plasma T-tau level and the average surface area of the isthmus of right cingulate gyrus (adjusted R2=0.404, p=1.27x10⁻⁴, Panel B).Figure 2 showed a widespread damage in the brain as related to visuospatial function. In Trail Making Test-A, positive correlation (Panel A) can be noticed with AD in the cingulate gyrus, including the anterior parts bilaterally (Left/Right: adjusted R2=0.170/0.346, p=3.59x10⁻⁴/ 2.67x10⁻⁴) and the right posterior part (adjusted R2=0.132, p=6.68x10⁻⁵). This finding was consistent with the structural analysis, where negative correlation was noticed with the average thickness of the isthmus of left cingulate gyrus (adjusted R2=0.104, p=5.24x10⁻⁴, panel B). Furthermore, we also noticed a positive correlation (Panel C) with the right lateral ventricle volume (adjusted R2=0.194, p=2.76x10⁻⁴) and the white matter hypointensities (adjusted R2=0.114, p=2.50x10⁻⁴). Figure 2D showed positive correlation between the Trail Making Test-B and AD of the anterior part of bilateral cingulate gyrus (Left/Right: adjusted R2=0.283/0.330, p=2.20x10⁻⁴/3.31x10-4), and the right calcarine fissure (adjusted R2=0.288, p=1.07x10⁻⁴). There was positive correlation between Judgment of Line Orientation and the volume of the right ventral diencephalon (adjusted R2=0.207, p=7.45x10⁻⁴, Figure 2E).
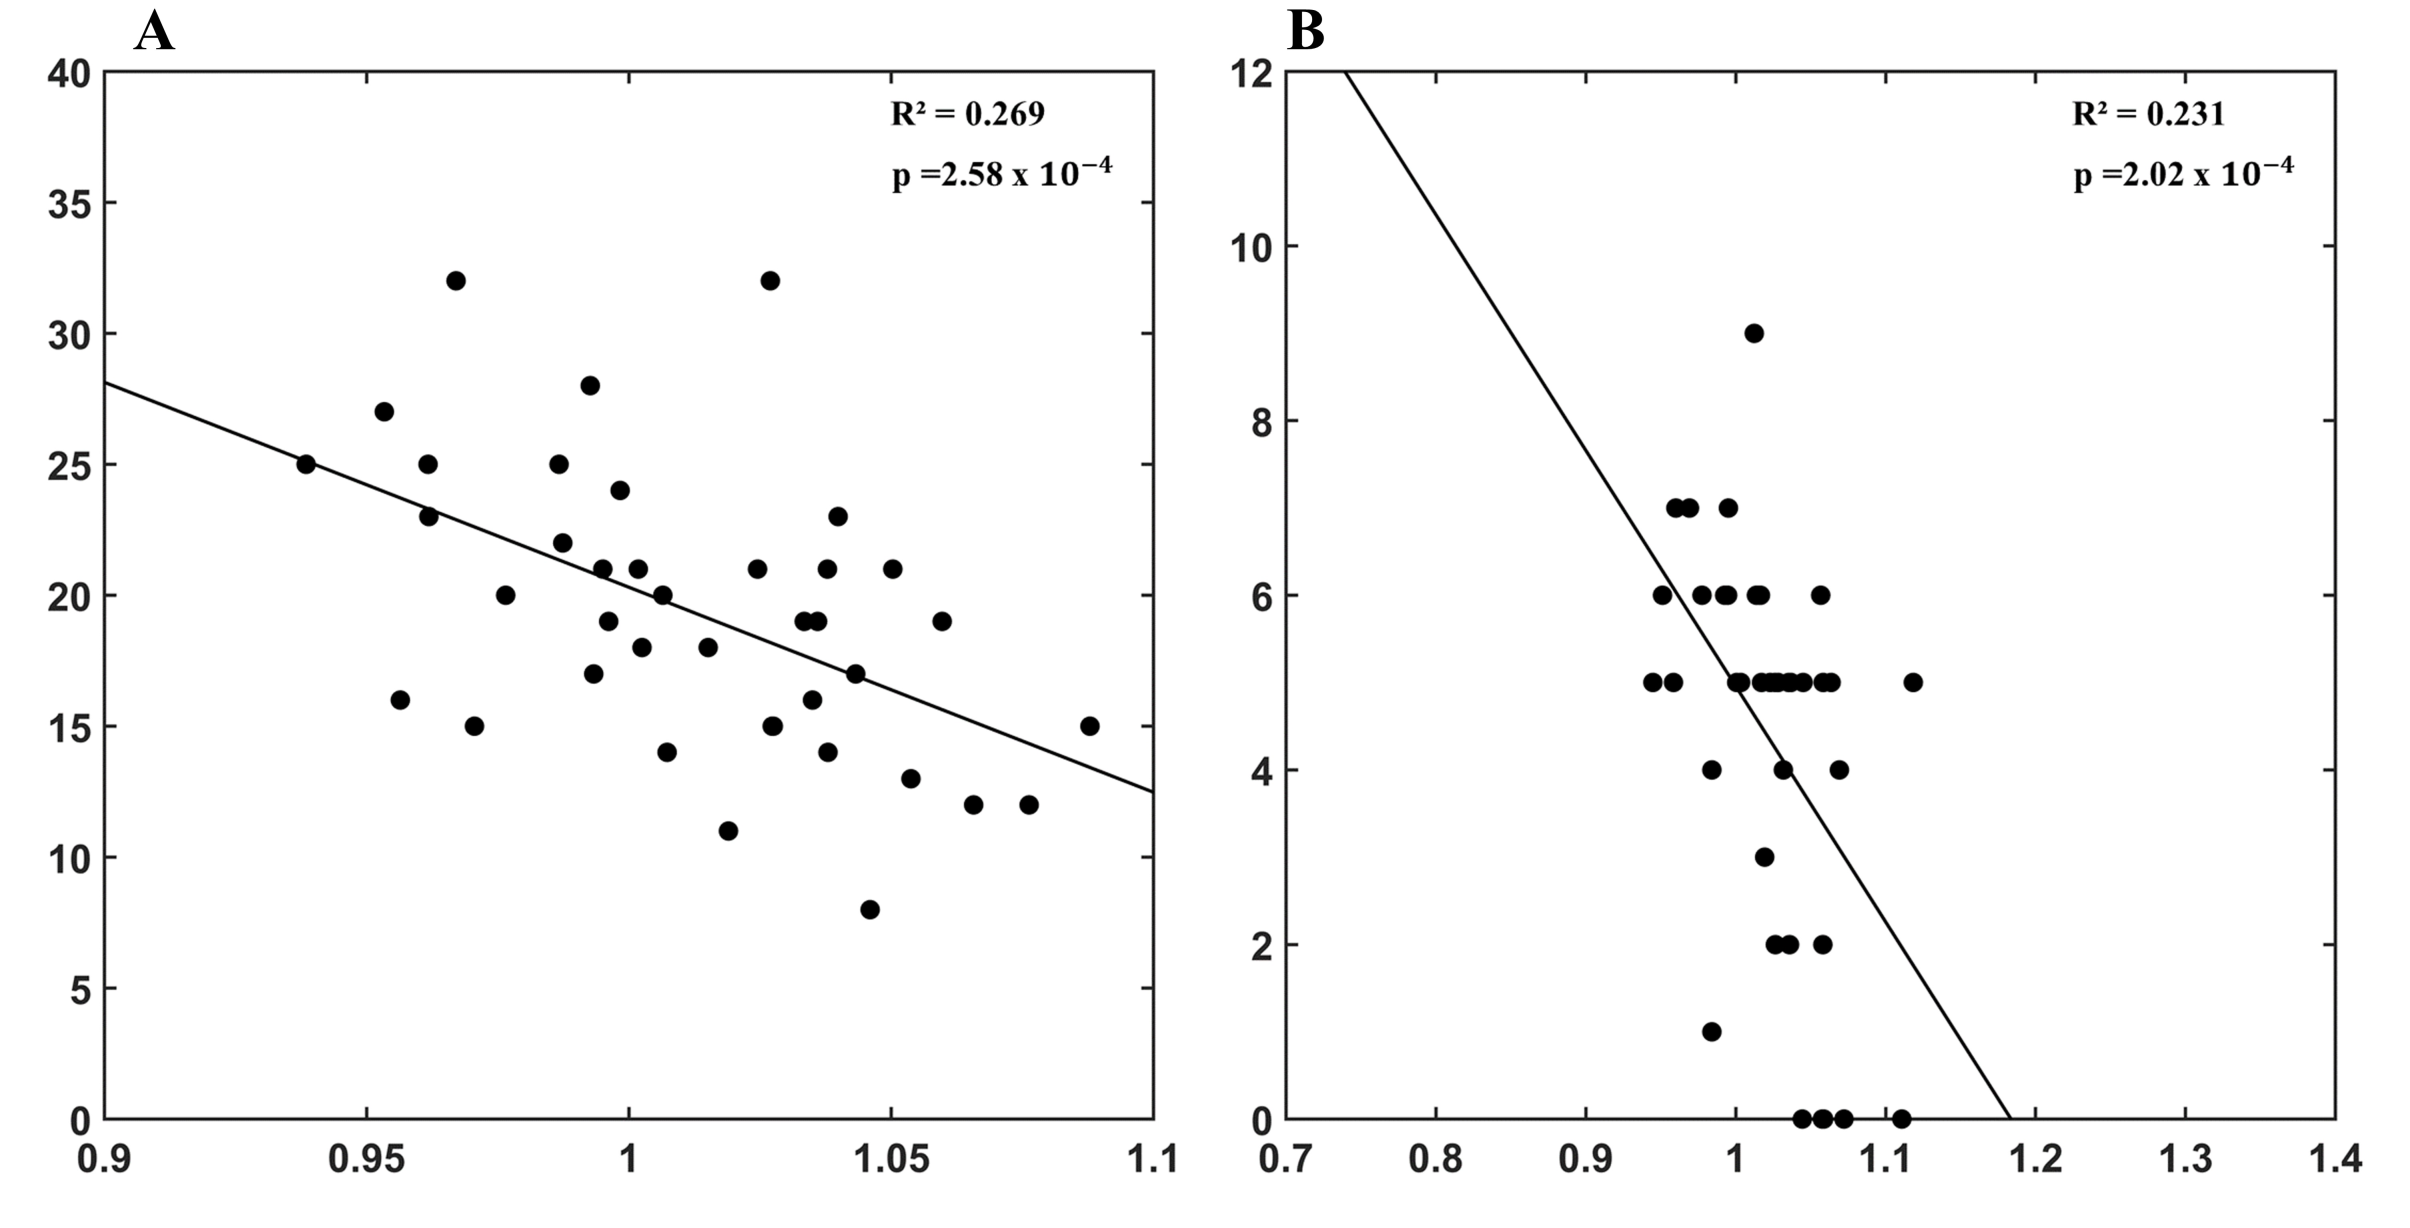
Figure 3 showed the correlation with the memory assessment (California Verbal Language Test-II Short Form) in our patients. A negative correlation with AD can be found with the total recall in the triangular part of the left inferior frontal gyrus (adjusted R2=0.269, p=2.58x10⁻⁴, Panel A), as well as the delay located in the orbital part of the left inferior frontal gyrus (adjusted R2=0.231, p=2.02x10⁻⁴, Panel B).
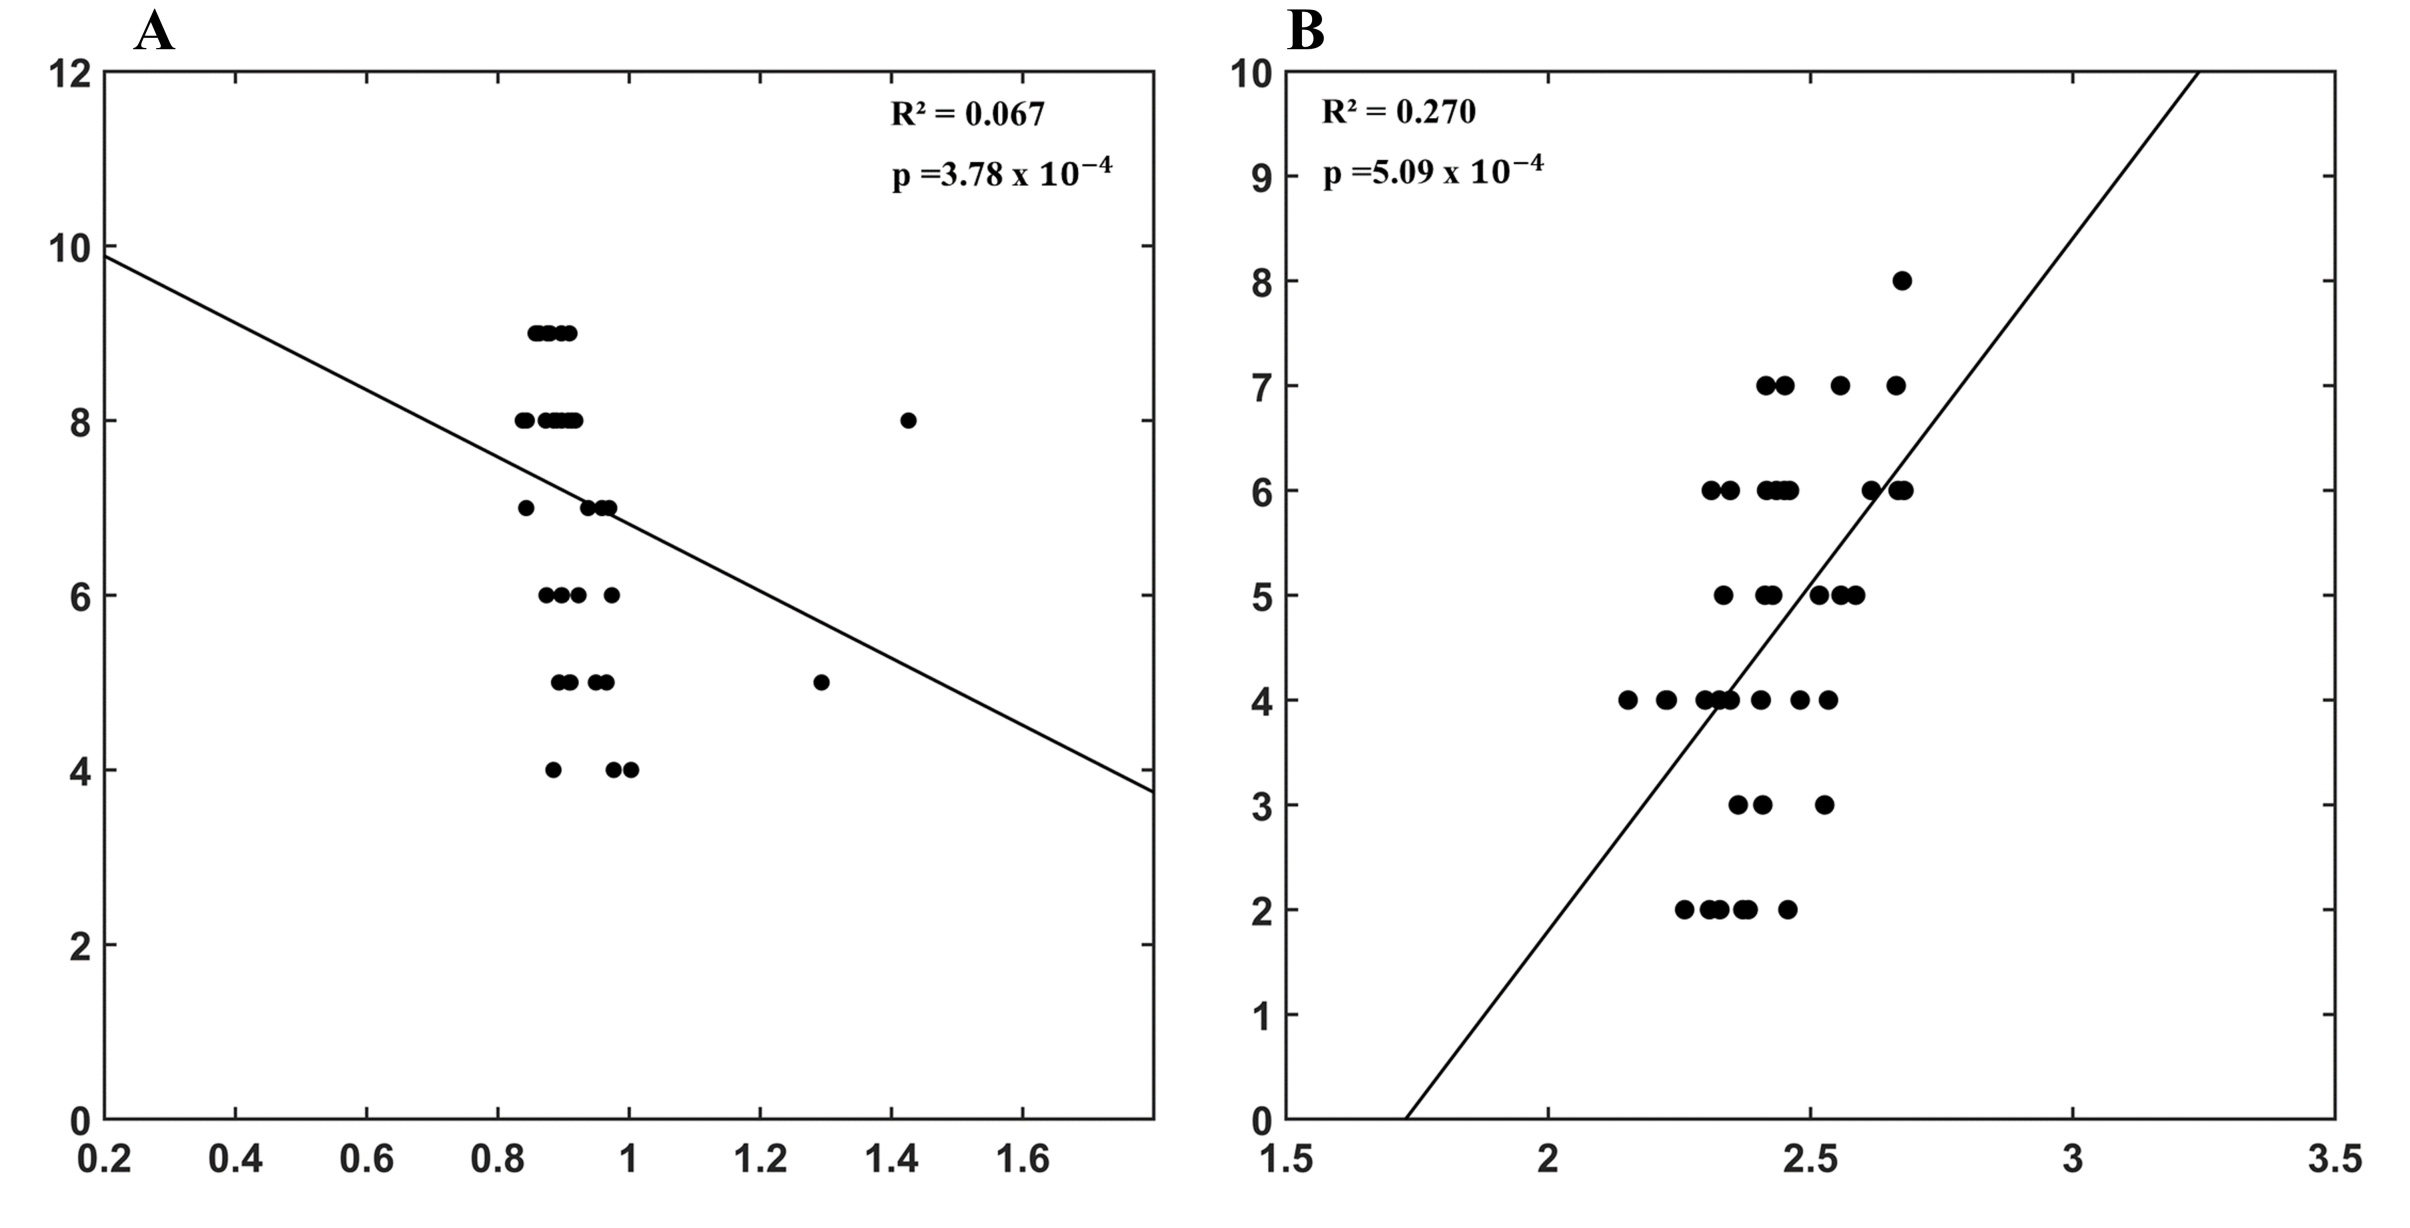
In the assessment of attention, we noticed a negative correlation between the forwards digit recall and AD in the cerebellar uvula (R2=0.067, p=3.78x10⁻⁴, Figure 4A) and a positive correlation between backwards digit recall and the average thickness of the left pars opercularis (R2=0.270, p=5.09x10⁻⁴, Figure 4B).
Discussion
We aimed to explore early and relevant neuroimaging biomarkers on a comprehensive neuropsychological assessment. Our result, noticeably AD of anterior cingulate cortex, demonstrated the potential from the impairment on executive dysfunction. It might suggest that the pattern of early cognitive impairment in PD can be similar to the frontal variant of Alzheimer’s disease. Furthermore, the right inferior temporal gyrus and the isthmus of right cingulate gyrus might be the target regions to reflect damage due to Aβ deposition and tau deposition, respectively, in nondemented PD patients. Regional changes in morphology showed correlation to executive function, memory, and visuospatial performance in these patients.Conclusion
Our study showed widespread brain damage with corresponding cognitive dysfunction might be expected to occur in PD patients even at the early stage of cognitive decline.Acknowledgements
This research was co-sponsored by Mackay Medical College; Mackay Memorial Hospital, Grant/Award Number: MMH-MM-10811; National Taipei University of Technology, Grant/Award Number: NTUT-MMH-109-07 ; Ministry of Science and Technology Taiwan (MOST 109-2221-E-182-009-MY3, MOST 109-2314-B-182-021-MY3); the Healthy Aging Research Center (grant EMRPD1I0501, EMRPD1I0471, EMRPD1M0451, EMRPD1M0431); and the Chang Gung Memorial Hospital (CMRPG2J0142, CMRPD1L0141).References
1. SAVICA R, GROSSARDT BR, ROCCA WA, BOWER JH. Parkinson disease with and without Dementia: A prevalence study and future projections. Mov Disord 2018;33:537-43.
2. LIN WT, SHAW JS, CHENG FY, CHEN PH. Plasma total tau predicts executive dysfunction in Parkinson's disease. Acta Neurol Scand 2022;145:30-37.
3. PYATIGORSKAYA N, GALLEA C, GARCIA-LORENZO D, VIDAILHET M, LEHERICY S. A review of the use of magnetic resonance imaging in Parkinson's disease. Ther Adv Neurol Disord 2014;7:206-20.
4. TSAI CC, LIN YC, NG SH, et al. A Method for the Prediction of Clinical Outcome Using Diffusion Magnetic Resonance Imaging: Application on Parkinson's Disease. J Clin Med 2020;9.
5. LU CS, NG SH, WENG YH, et al. Alterations of diffusion tensor MRI parameters in the brains of patients with Parkinson's disease compared with normal brains: possible diagnostic use. Eur Radiol 2016;26:3978-88.
6. DUNCAN GW, FIRBANK MJ, YARNALL AJ, et al. Gray and white matter imaging: A biomarker for cognitive impairment in early Parkinson's disease? Mov Disord 2016;31:103-10.
7. TABESH A, JENSEN JH, ARDEKANI BA, HELPERN JA. Estimation of tensors and tensor-derived measures in diffusional kurtosis imaging. Magn Reson Med 2011;65:823-36.
8. DESIKAN RS, SEGONNE F, FISCHL B, et al. An automated labeling system for subdividing the human cerebral cortex on MRI scans into gyral based regions of interest. Neuroimage 2006;31:968-80.
Figures