2279
Multimodality Neuroimaging Biomarkers in Parkinson’s Disease1Translational Imaging, Neuroscience, Abbvie, North Chicago, IL, United States, 2PET Center, Yale University, New Haven, CT, United States, 3Department of Psychiatry, Yale University, New Haven, CT, United States, 4Department of Biomedical Engineering, Yale University, New Haven, CT, United States, 5Department of Neurology, Yale University, New Haven, CT, United States
Synopsis
Keywords: Parkinson's Disease, Multimodal
Neuroimaging is widely used in Parkinson's disease patients to improve diagnosis, provide insights into the natural history of disease, and facilitate the development of new treatments. Different MRI sequences and contrasts have been employed to study structure and function, whilst PET have been used to image receptors, transporters, enzymes and metabolism. In this study we evaluate relationships between pathological and functional markers of neurodegeneration using a range of advanced MRI and PET methods, in the same subjects, cross sectionally and over time. To the best of our knowledge this combination of markers has yet to be reported.Introduction
Neuroimaging is widely used in Parkinson's disease (PD) patients to improve diagnosis, provide insights into the natural history of disease, and facilitate the development of new treatments. Different magnetic resonance imaging (MRI) sequences and contrasts have been employed to study structure and function, whilst positron emission tomography (PET) have been used to image receptors, transporters, enzymes and metabolism[1]. In this study we evaluate relationships between pathological and functional markers of neurodegeneration using a range of advanced MRI and PET methods, in the same subjects, cross sectionally and over time. To the best of our knowledge this combination of markers has yet to be reported.Methods and Results
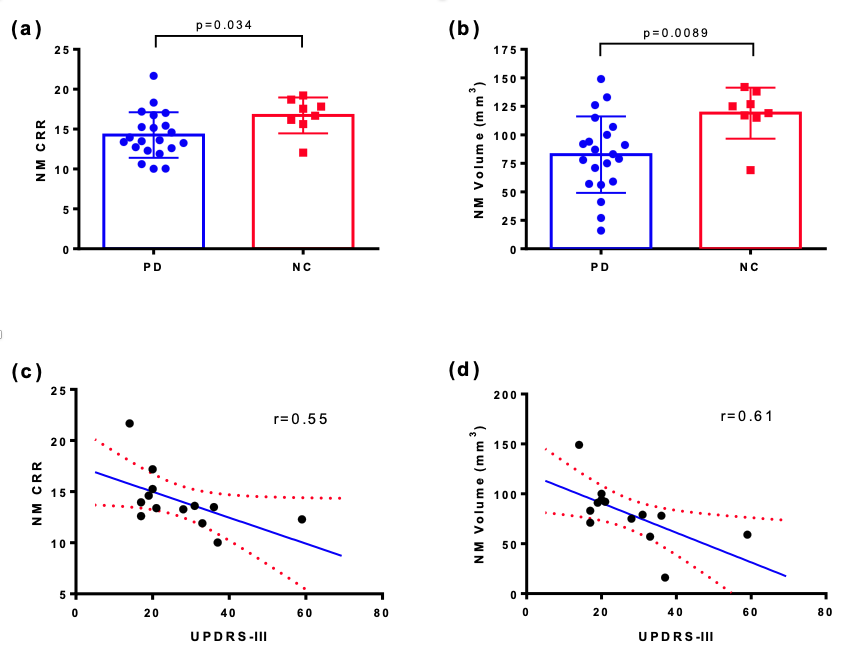
In this ongoing study we evaluate various imaging approaches in PD and normal control (NC) participants. Currently, a total of 44 PD and 16 NC have been enrolled into this study at Yale University. All PD subjects had mild bilateral disease with a Hoehn and Yahr scale score of 2 at the start of the study, and disease duration ranging from 0.5-13 years. Key MRI measurements included neuromelanin (NM)-MRI, diffusion tensor imaging (DTI) with neurite orientation dispersion and density imaging (NODDI), resting-state functional MRI (rs-fMRI). The study also included dopamine transporter (DAT) PET and synaptic vesicle glycoprotein 2A (SV2A) PET with [18F]FE-PE2I and [11C]UCB-J, respectively, both of which have shown promise in measuring substantia nigra (SN) deficits in PD.NM-MRI: 21 PD and 8 NC were included in the NM MRI analysis. NM sensitive images were acquired using a two-dimensional (2D) gradient-recalled-echo (GRE) sequence with magnetization transfer contrast (2D GRE-MTC). An automated NM analysis pipeline was developed in-house with modifications from the Wengler, et al.,[2]. Both mean contrast-to-reference ratio (CRR) and NM volumetric maps were generated to quantify group differences in NM level within SN pars compacta (SNpc). NM volume was estimated using a one-sided t-test including only voxels that were statistically similar to the control group and above a predefined threshold. Interim analyses revealed lower CRR in SNpc compared to controls (p=0.034, Fig 1.a), which suggested lower NM content in PD. Lower NM volumes in t-test based volumetric analysis (p=0.0089, Fig 1.b) provided additional confirmation of this effect. Strong linear negative correlations (r=0.61 for NM volumes, r=0.55 for CRR, Fig 1.c,d) were observed between NM-MRI and unified Parkinson's disease rating scale part III (UPDRS-III).
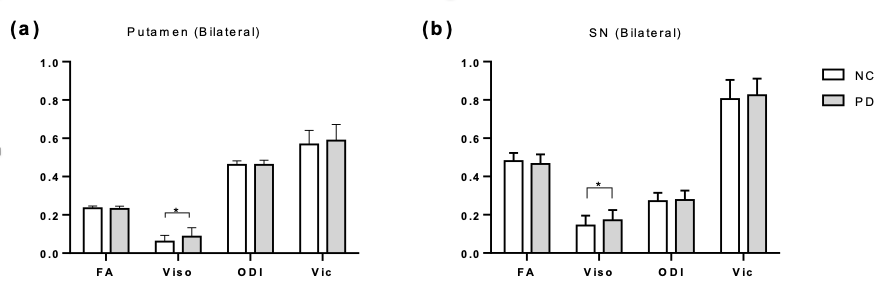
DTI-MRI: 28 PD and 10 NC were included in the baseline DTI/NODDI analysis. A two-shell diffusion-weighted sequence was used with b-value 700, 2000 s/mm2. Artifacts due to motion, eddy currents, and susceptibility distortions were corrected. Diffusion data were then fitted with FSL and NODDI Toolbox in NMI152 space[3]. Changes in fractional anisotropy (FA) along major white matter tracts were examined using Tract Based Spatial Statistics (TBSS). We observed significant increases in the fractional volume of free-water (FW or Viso) in PD in the bilateral putamen (p=0.0264, Fig 2.a) and bilateral SN (p=0.0463, Fig 2.b), which is consistent with the literature[4]. However, no changes were detected in SN connected white matter tracts with TBSS.
rs-fMRI: 28 PD and 10 NC were included in rs-fMRI analysis. Pre-selected subcortical regions and SN were used for seed-based analysis. Functional connectivity (FC) matrix for each subject was used for graph theoretical analysis. PD group show significantly lower FC in supramarginal gyrus seeded in SNpc (FDR corrected p=0.037). Interestingly, significantly lower FC was observed in supracalcarine cortex and frontal pole seeded in caudate (FDR corrected p=0.018). For graph theoretical analysis, we found significantly lower global efficiency in PD (FDR corrected p=0.036).
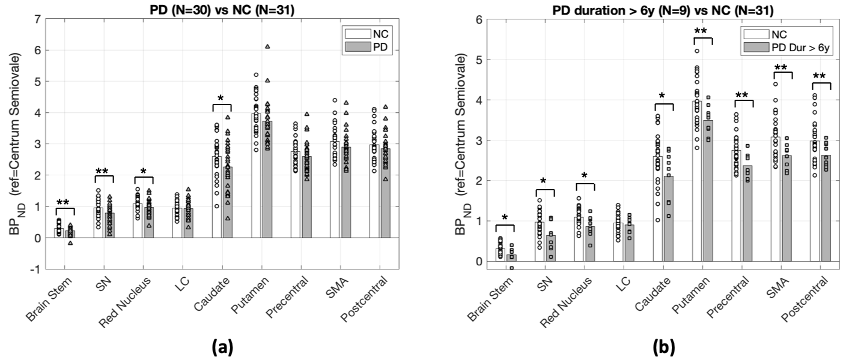
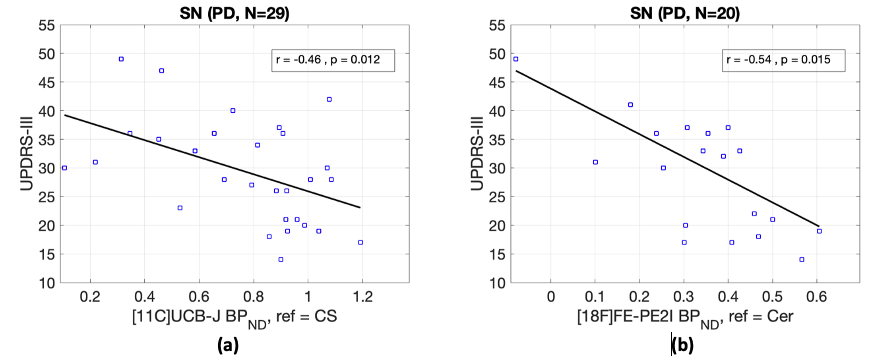
PET: Prospective PET studies with cross-sectional cohorts of PD patients and NCs (age and sex matched) were conducted at Yale to measure synaptic density ([11C]UCB-J, NPD=30, NNC=31 include subjects from other studies) and DAT availability ([18F]FE-PE2I, NPD=20, NNC=14). SV2A binding potential (BPND) was significantly lower in SN (18%), brainstem (28%), red nucleus (10%) and caudate (13%). Post-hoc analysis in more chronic PD (duration>6 years) revealed further reduced SV2A BPND across key brain regions affected in PD, including motor cortical regions (Fig 3). The trend in synaptic loss is consistent with Braak staging in PD. Regional DAT availability was significantly reduced in PD subjects in SN (39%), caudate (56%) and putamen (65%). Significant negative associations were found between the motor scores and both PET measures in SN (Fig 4).
Conclusion and discussion
The key findings of the study indicated NM-MRI was sensitive to differentiate the underlying neuroanatomical and pathophysiological changes in PD, but also found strong correlations with clinical motor severity scores, which indicates the connection between NM content and motor function. Our data also suggested that FW may identify disease induced neurodegeneration in PD. Additionally, we confirmed the association of lowered SV2A and DAT proteins in PD with PET.This study will continue as a longitudinal investigation and include additional NC to better balance group sizes. More recently, arterial spin labelling (ASL) and quantitative susceptibility mapping (QSM) were added to the protocol. Additional analysis will focus on disease progression by evaluating interconnections of synaptic density ([11C]UCB-J) and dopaminergic deficits ([18F]FE-PE2I) with different MRI readouts and their correlations to the clinical/functional or regional pathology.
Acknowledgements
No acknowledgement found.References
[1] Bae YJ, Kim JM, Sohn CH, Choi JH, Choi BS, Song YS, Nam Y, Cho SJ, Jeon B, Kim JH. Imaging the Substantia Nigra in Parkinson Disease and Other Parkinsonian Syndromes. Radiology. 2021 Aug;300(2):260-278. doi: 10.1148/radiol.2021203341. Epub 2021 Jun 8. PMID: 34100679.
[2] Wengler K, He X, Abi-Dargham A, Horga G. Reproducibility assessment of neuromelanin-sensitive magnetic resonance imaging protocols for region-of-interest and voxelwise analyses. Neuroimage. 2020 Mar;208:116457. doi: 10.1016/j.neuroimage.2019.116457. Epub 2019 Dec 11. PMID: 31841683; PMCID: PMC7118586.
[3] Zhang H, Schneider T, Wheeler-Kingshott CA, Alexander DC. NODDI: practical in vivo neurite orientation dispersion and density imaging of the human brain. Neuroimage. 2012 Jul 16;61(4):1000-16. doi: 10.1016/j.neuroimage.2012.03.072. Epub 2012 Mar 30. PMID: 22484410.
[4] Ofori E, Pasternak O, Planetta PJ, Burciu R, Snyder A, Febo M, Golde TE, Okun MS, Vaillancourt DE. Increased free water in the substantia nigra of Parkinson's disease: a single-site and multi-site study. Neurobiol Aging. 2015 Feb;36(2):1097-104. doi: 10.1016/j.neurobiolaging.2014.10.029. Epub 2014 Oct 31. PMID: 25467638;
Figures